



Frameless Solar Panels Market
Frameless Solar Panels Market Size, Share, Insights, Competitive Landscape, and Forecast 2026 to 2033
Report Overview
Frameless Solar Panels Market Size and Trend Analysis
How Big Will the Frameless Solar Panels Market Be by 2033?
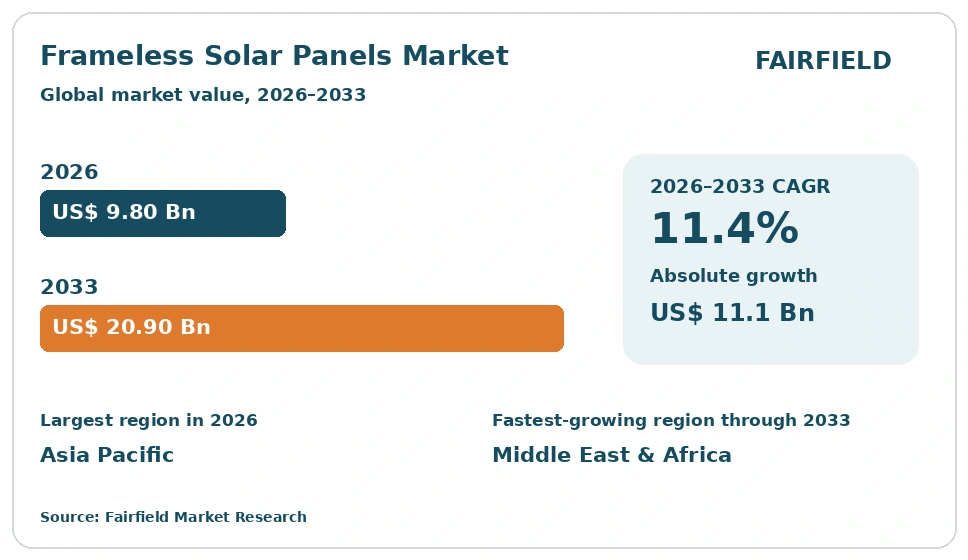
The global Frameless Solar Panels market size is expected to be valued at US$ 9.8 billion in 2026 and projected to reach US$ 20.9 billion by 2033, growing at a CAGR of 11.4% between 2026 and 2033. Growth rests on the move to glass-glass laminates that carry longer performance warranties than framed modules. Bifacial designs without aluminium edges capture more reflected light, lifting yield on trackers and reflective ground cover. Utility buyers also value reduced water pooling, lower potential-induced degradation and simpler end-of-life glass recovery. The market advanced at a CAGR of 10.7% between 2020 and 2025, and the absolute dollar opportunity through 2033 stands at US$ 11.1 billion.
Key Report Takeaways
- By Cell Technology: TOPCon led with 38% share in 2026, while heterojunction (HJT) is projected to expand at a 15.2% CAGR through 2033, driven by lower temperature coefficients that suit hot, high-irradiance project sites.
- By Mounting Type: Single-axis tracker mounts held 36% share in 2026, while floating and canopy mounts are set to grow at a 14.6% CAGR through 2033, driven by land scarcity around dense electricity load centres.
- By Application: Utility-scale power plants accounted for 47% of revenue in 2026, while building-integrated photovoltaics should advance at a 15.8% CAGR through 2033, driven by tighter building energy codes in commercial construction.
- By End User: Independent power producers and utilities took 44% share in 2026, while construction and real estate developers are forecast to rise at a 15.1% CAGR through 2033, driven by corporate net-zero commitments covering new assets.
- By Region: Asia Pacific led with 46% share in 2026 across North America, Europe, Asia Pacific, Latin America and Middle East & Africa, while Middle East & Africa should post a 14.3% CAGR through 2033 on desert tenders.
Market Trends and Insights
Market Growth Drivers
Longer Service Life Pulls Utility Buyers Toward Glass-Glass Modules
Frameless construction lifts demand because plant owners buy on lifetime energy, not sticker price. Taking out the aluminium frame removes the main route for moisture to reach the edge seal and the ledge that traps dirt and standing water. Encapsulant held between two glass sheets ages slower under ultraviolet exposure, so yearly power loss stays lower. Lenders modelling thirty-year asset lives accept these modules more readily, which widens the buyer pool.
Module makers support the claim with extended performance warranties and testing against IEC durability standards for damp heat and mechanical load. Glass-glass laminates need no frame grounding, which trims electrical balance-of-system work. Manufacturers have converted large shares of capacity to dual-glass formats as thinner glass cut the weight penalty. Recycling rules add pressure, since separating bonded frames complicates clean glass recovery.
Bifacial Energy Gain Strengthens Project Returns
Frameless dual-glass modules raise revenue per installed watt because the rear glass admits reflected light that framed laminates block. On single-axis trackers over light-coloured ground, that rear contribution adds a meaningful share of annual output without extra land, cabling or inverters. Developers bidding into competitive auctions treat the gain as a direct cut in generation cost. The absence of a frame shadow near the module edge also reduces cell mismatch.
Design practice has moved with the evidence. Engineers now raise mounting height, widen row pitch and specify brighter ground cover to lift rear-side irradiance. Tracker suppliers have reworked torque tubes and purlins so they shade less of the back surface. Energy modelling tools have added bifacial gain calculations, giving financiers a repeatable basis for yield assumptions. That confidence has pushed frameless bifacial products into mainstream utility procurement.
Restraints Impact Analysis of Market
Added Glass Weight Raises Handling and Structural Cost
Two sheets of glass make frameless modules heavier and more awkward than framed equivalents, which holds back adoption on weight-sensitive roofs. Older commercial buildings often cannot take the extra load without structural reinforcement, and that cost can cancel the energy advantage. Installers need more care during transport, since an unframed laminate has no rigid edge to absorb knocks. Breakage during delivery and mounting raises project contingency budgets.
Mounting also differs in practice. Frameless laminates rely on clamps bearing on glass, bonded rail systems or structural glazing details rather than bolts through a frame. Each route demands tighter tolerance, correct clamp pressure and approved gaskets, so labour hours per installed watt stay higher. Training gaps across smaller contractors slow uptake in rooftop work, where speed of installation usually decides the chosen product.
Glass Supply Tightness and Module Oversupply Squeeze Margins
Thin, low-iron solar glass is the critical input, and frameless modules need two sheets instead of one. When furnace capacity lags module output, glass pricing and lead times move sharply, which disrupts delivery schedules. Capacity cannot be added quickly because rolled glass furnaces take years to build and run continuously once lit. Broad module oversupply has also driven selling prices down, leaving thin headroom to pass higher glass costs through.
Trade measures on cells, wafers and finished modules add a further layer of uncertainty. Shifting duty regimes change the delivered cost of imported product and push manufacturers to relocate assembly, which raises working capital needs. Smaller producers without captive glass supply or long-term contracts carry the most exposure. Several have slowed frameless expansion until pricing settles and contracted glass volumes are secured.
Market Opportunities
Agrivoltaics Opens a Distinct Application Channel
Frameless modules create new revenue in agrivoltaics because crops and livestock need controlled light, not full shade. Glass-glass laminates with spaced cells pass diffuse light through the gaps, so growers keep usable yield under the array. The absence of a frame lip stops rain, dust and plant debris collecting at the module edge, which matters where cleaning access is limited. Elevated structures above fields also gain from the strength two glass sheets provide.
Agricultural ministries and rural energy programmes in several regions now recognise dual land use in permitting, which removes a long-standing barrier. Research farms and university trials have measured crop response under different transparency levels, giving designers practical guidance. Module makers have responded with semi-transparent and spaced-cell product families aimed at this use. Grower cooperatives seeking stable income from land see a practical fit.
Building-Integrated Glazing Creates Premium Product Demand
Building-integrated photovoltaics gives frameless modules a high-value channel that framed products cannot serve. Architects need the module to work as a building element, so the glass must meet facade, skylight and canopy requirements for safety, colour and transparency. A frameless laminate reads as architectural glazing rather than bolted-on equipment, which wins specification on visible elevations. Prices per square metre sit well above utility module levels because the product also replaces cladding.
Building energy codes across commercial construction keep tightening performance targets, and on-site generation is one of the few ways to meet them on dense urban sites. Glass processors have adapted laminating, tempering and patterning lines to handle active glass. Testing against IEC photovoltaic standards alongside construction product rules gives specifiers assurance. Curtain wall fabricators are partnering with module makers to supply finished units.
Category-wise Insights
Why Does TOPCon Lead Frameless Module Shipments?
TOPCon leads because it reached mass production fastest while delivering the rear-side output frameless buyers want, holding 38% share in 2026. The technology upgraded existing PERC lines at modest cost, so suppliers scaled volume without rebuilding factories. Its bifaciality ratio suits glass-glass construction, and the n-type wafer base resists the light-induced degradation that shortened earlier module life. Monocrystalline PERC retains 29% share, mostly in price-led tenders.
Heterojunction (HJT) is the growth leader at a 15.2% CAGR through 2033. Its low temperature coefficient protects output in hot climates, and its symmetrical cell structure fits dual-glass lamination naturally. Thinner wafers and lower-temperature processing also cut factory energy use. Thin-film (CdTe) holds 11% share in frameless formats, while back-contact and other designs account for 5%. The split pushes equipment suppliers toward flexible lines.
Tracker Mounting Dominates Volume While Floating Systems Scale Quickly
Single-axis tracker mounts hold 36% share in 2026 because they pair naturally with bifacial frameless modules. Raising the array and tilting it through the day lifts both front and rear irradiance, and open torque-tube designs shade little of the back glass. Tracker makers have published clamping details approved for unframed laminates, removing an early warranty obstacle. Fixed-tilt ground mounts follow at 31%, chosen where wind loading or budget rules out moving structures.
Floating and canopy mounts form the fastest-growing route at a 14.6% CAGR through 2033, from a 5% base. Water bodies and parking structures sit close to load centres where land is scarce, and cooling over water lifts output. Glass-glass construction resists the constant humidity that corrodes aluminium frames. Rail-and-clamp rooftop mounts take 19% share and facade and structural glazing systems 9%.
Utility-Scale Plants Anchor Volume as Building-Integrated Demand Accelerates
Utility-scale power plants account for 47% of revenue in 2026, the clearest sign that frameless technology has moved past niche status. Large plants gain most from the format because small percentage yield improvements multiply across hundreds of megawatts. Long power purchase agreements also reward slower degradation, since late-life output carries contracted value. Commercial and industrial rooftop projects take 23% share, concentrated on newer buildings with sufficient structural capacity.
Building-integrated photovoltaics is the fastest-growing application at a 15.8% CAGR through 2033 from a 10% base. Office, retail and institutional buildings face tighter energy performance requirements, and facade or skylight generation is often the only remaining option on constrained sites. Agrivoltaics holds 13% share as dual land use gains permitting support, and residential rooftop takes 7%.
Power Producers Buy Most Modules While Property Developers Expand Fastest
Independent power producers and utilities purchased 44% of frameless modules in 2026 because they own the asset across its full life and model output decades ahead. Their procurement teams run detailed bankability reviews, and glass-glass warranties clear those tests more easily. Bulk ordering also secures supply during glass shortages. Commercial and industrial enterprises follow at 25%, buying to cut electricity costs and meet reported emissions targets.
Construction and real estate developers form the fastest-rising buyer group at a 15.1% CAGR through 2033, from 14% share. Green building certification and tenant expectations now shape leasing value, so generation is designed into new projects rather than retrofitted. Agriculture and horticulture operators hold 11% and residential owners 6%. The widening buyer base pushes manufacturers to build construction-sector sales channels.
Geography Analysis
North America Rebuilds Domestic Glass-Glass Module Capacity
North America held 18% share in 2026 and is set to grow at a 10.2% CAGR through 2033. The United States dominates regional demand through utility-scale build-out across the Southwest and Texas, with Canada adding commercial rooftop volume. Federal manufacturing incentives have pulled module assembly onshore, and several plants now run dual-glass lines. Domestic solar glass remains the weak link, so producers rely partly on imported sheet. Trade measures on imported cells and modules keep supply planning complex and raise delivered cost. Utility buyers accept the frameless format because long-dated power purchase agreements reward slow degradation. Interconnection queue delays now set the pace of deployment.
Europe Pairs Frameless Modules With Strict Building Rules
Europe accounted for 25% share in 2026 and should expand at an 11.0% CAGR through 2033. Germany, Spain, Italy, France and the Netherlands lead installations, combining ground-mounted plants with dense rooftop and facade activity. Building energy performance rules and national renovation programmes push generation into the building envelope, which favours frameless glazing products. Circular economy rules reinforce the shift, since recovering clean glass is easier without a bonded aluminium frame. Agrivoltaics has gained formal planning recognition in several countries, opening farmland to dual use. European module makers position glass-glass construction as a quality marker against lower-cost imports. Grid connection capacity and permitting speed remain the main constraints on faster growth.
Which Region Is Leading the Frameless Solar Panels Market?
Asia Pacific leads the Frameless Solar Panels market with 46% share in 2026 and is forecast to grow at an 11.6% CAGR through 2033. China anchors the position through concentrated cell, module and solar glass production, giving its manufacturers the shortest supply chain for dual-glass formats. Domestic deployment across desert bases and distributed rooftop programmes absorbs much of that output. India, Japan, Australia, South Korea and Vietnam add further volume. India has expanded module assembly under local content rules, while Japan applies frameless products in building-integrated and agrivoltaic projects. Regional glass furnaces sit close to module plants, shortening lead times.
Latin America Adds Frameless Capacity in High-Irradiance Zones
Latin America held 4% share in 2026 and is projected to grow at a 13.1% CAGR through 2033. Brazil, Chile and Mexico drive most activity, supported by strong irradiance and competitive auction frameworks that reward low generation cost. Chilean desert sites offer high ground reflectance, so bifacial frameless modules deliver measurable rear-side gains. Brazilian distributed generation rules have built a large commercial rooftop base. Modules are almost entirely imported, which exposes projects to freight cost and breakage risk on unframed laminates. Mining operators in Chile and Peru are contracting solar supply for processing loads. Currency movement and financing cost shape project timing more than technology choice.
Which Region Is Growing Fastest in the Frameless Solar Panels Market?
Middle East & Africa is growing fastest in the Frameless Solar Panels market at a 14.3% CAGR through 2033, from 7% share in 2026. Saudi Arabia, the United Arab Emirates, Egypt, Morocco and South Africa lead through gigawatt-scale tenders awarded at very low generation prices. Those tariffs leave no room for yield loss, so bidders favour bifacial frameless modules on trackers over bright desert ground. Sand abrasion, extreme heat and salt air degrade framed modules faster, while glass-glass laminates with no aluminium edge resist corrosion. Sovereign diversification programmes provide long-term project pipelines and local assembly commitments. African rural electrification schemes add distributed demand where maintenance access is limited.
Competitive Landscape
The Frameless Solar Panels market is moderately concentrated. A group of large integrated Chinese manufacturers supplies most global volume, while specialist European, North American and Indian producers hold defensible positions in premium, building-integrated and domestically sourced segments. Scale decides cost, so vertically integrated firms controlling wafer, cell, module and glass steps set the price floor. Smaller producers avoid direct competition on utility tenders and concentrate on architectural, agrivoltaic and high-durability niches. Persistent module oversupply has squeezed margins and accelerated the restructuring of subscale capacity.
Competition centres on measurable performance and proven reliability. Vendors differentiate on bifaciality ratio, temperature coefficient, degradation rate and warranty length, all tested against IEC photovoltaic standards. Cell architecture choice is now a strategic position rather than a technical detail, with suppliers backing TOPCon, heterojunction or back-contact platforms. Thinner glass, improved encapsulants and edge-sealing methods matter because they address weight and breakage, the two objections buyers raise most often. New entrants from the flat glass and curtain wall industries bring facade expertise that traditional module makers lack.
Strategic activity follows the same logic. Capacity investment focuses on dual-glass-capable lines and captive solar glass supply, since glass availability limits output more than cell capacity does. Geographic diversification of assembly addresses shifting trade rules and local content requirements. Partnerships between module makers and mounting, tracker and glazing suppliers resolve the clamping and structural details that unframed laminates require. Research spending targets higher cell efficiency and lower silver use per watt.
Competitive direction is set by cost discipline, bankable durability data and the ability to serve construction customers as well as power producers.
Industry Leaders
- LONGi Green Energy Technology Co., Ltd.
- JinkoSolar Holding Co., Ltd.
- Trina Solar Co., Ltd.
- JA Solar Technology Co., Ltd.
- Canadian Solar Inc.
- First Solar, Inc.
- Hanwha Qcells
- Risen Energy Co., Ltd.
Companies Covered in the Report
- LONGi Green Energy Technology Co., Ltd.
- JinkoSolar Holding Co., Ltd.
- Trina Solar Co., Ltd.
- JA Solar Technology Co., Ltd.
- Canadian Solar Inc.
- First Solar, Inc.
- Hanwha Qcells
- Risen Energy Co., Ltd.
- Astronergy (Chint Solar)
- Maxeon Solar Technologies, Ltd.
- REC Group
- Meyer Burger Technology AG
- SOLARWATT GmbH
- Waaree Energies Limited
- Vikram Solar Limited
Frameless Solar Panels Market Report Scope
The Frameless Solar Panels market is segmented by cell technology, mounting type, application, end user and region.
| By Cell Technology | TOPCon, Monocrystalline PERC, Heterojunction (HJT), Thin-Film (CdTe), Back-Contact and Others |
| By Mounting Type | Single-Axis Tracker Mount, Fixed-Tilt Ground Mount, Rail-and-Clamp Rooftop Mount, Facade and Structural Glazing Mount, Floating and Canopy Mount |
| By Application | Utility-Scale Power Plants, Commercial and Industrial Rooftop, Agrivoltaics, Building-Integrated Photovoltaics, Residential Rooftop |
| By End User | Independent Power Producers and Utilities, Commercial and Industrial Enterprises, Construction and Real Estate Developers, Agriculture and Horticulture Operators, Residential Owners |
| By Region | North America, Europe, Asia Pacific, Latin America, Middle East & Africa |
1. Executive Summary
1.1 Frameless Solar Panels Market Snapshot
1.2 Future Projections
1.3 Key Industry Highlights
1.4 Geographical Snapshot
2. Market Overview
2.1 Market Definition and Segmentation
2.2 Historical Market Trends
2.3 Market Dynamics
2.3.1 Drivers
2.3.1.1 Longer Service Life Pulls Utility Buyers Toward Glass-Glass Modules
2.3.1.2 Bifacial Energy Gain Strengthens Project Returns
2.3.2 Restraints
2.3.2.1 Added Glass Weight Raises Handling and Structural Cost
2.3.2.2 Glass Supply Tightness and Module Oversupply Squeeze Margins
2.3.3 Market Opportunities
2.3.3.1 Agrivoltaics Opens a Distinct Application Channel
2.3.3.2 Building-Integrated Glazing Creates Premium Product Demand
3. Global Frameless Solar Panels Market Outlook, 2026–2033
3.1 Global Frameless Solar Panels Market Outlook, by Cell Technology, Value (US$ Billion), 2026–2033
3.1.1 TOPCon
3.1.2 Monocrystalline PERC
3.1.3 Heterojunction (HJT)
3.1.4 Thin-Film (CdTe)
3.1.5 Back-Contact and Others
3.2 Global Frameless Solar Panels Market Outlook, by Mounting Type, Value (US$ Billion), 2026–2033
3.2.1 Single-Axis Tracker Mount
3.2.2 Fixed-Tilt Ground Mount
3.2.3 Rail-and-Clamp Rooftop Mount
3.2.4 Facade and Structural Glazing Mount
3.2.5 Floating and Canopy Mount
3.3 Global Frameless Solar Panels Market Outlook, by Application, Value (US$ Billion), 2026–2033
3.3.1 Utility-Scale Power Plants
3.3.2 Commercial and Industrial Rooftop
3.3.3 Agrivoltaics
3.3.4 Building-Integrated Photovoltaics
3.3.5 Residential Rooftop
3.4 Global Frameless Solar Panels Market Outlook, by End User, Value (US$ Billion), 2026–2033
3.4.1 Independent Power Producers and Utilities
3.4.2 Commercial and Industrial Enterprises
3.4.3 Construction and Real Estate Developers
3.4.4 Agriculture and Horticulture Operators
3.4.5 Residential Owners
3.5 Global Frameless Solar Panels Market Outlook, by Region, Value (US$ Billion), 2026–2033
3.5.1 North America
3.5.2 Europe
3.5.3 Asia Pacific
3.5.4 Latin America
3.5.5 Middle East & Africa
4. North America Frameless Solar Panels Market Outlook, 2026–2033
4.1 North America Frameless Solar Panels Market Outlook, by Cell Technology, Value (US$ Billion), 2026–2033
4.1.1 TOPCon
4.1.2 Monocrystalline PERC
4.1.3 Heterojunction (HJT)
4.1.4 Thin-Film (CdTe)
4.1.5 Back-Contact and Others
4.2 North America Frameless Solar Panels Market Outlook, by Mounting Type, Value (US$ Billion), 2026–2033
4.2.1 Single-Axis Tracker Mount
4.2.2 Fixed-Tilt Ground Mount
4.2.3 Rail-and-Clamp Rooftop Mount
4.2.4 Facade and Structural Glazing Mount
4.2.5 Floating and Canopy Mount
4.3 North America Frameless Solar Panels Market Outlook, by Application, Value (US$ Billion), 2026–2033
4.3.1 Utility-Scale Power Plants
4.3.2 Commercial and Industrial Rooftop
4.3.3 Agrivoltaics
4.3.4 Building-Integrated Photovoltaics
4.3.5 Residential Rooftop
4.4 North America Frameless Solar Panels Market Outlook, by End User, Value (US$ Billion), 2026–2033
4.4.1 Independent Power Producers and Utilities
4.4.2 Commercial and Industrial Enterprises
4.4.3 Construction and Real Estate Developers
4.4.4 Agriculture and Horticulture Operators
4.4.5 Residential Owners
4.5 North America Frameless Solar Panels Market Outlook, by Country, Value (US$ Billion), 2026–2033
4.5.1 United States Frameless Solar Panels Market Outlook, by Cell Technology, 2026–2033
4.5.2 United States Frameless Solar Panels Market Outlook, by Mounting Type, 2026–2033
4.5.3 United States Frameless Solar Panels Market Outlook, by Application, 2026–2033
4.5.4 United States Frameless Solar Panels Market Outlook, by End User, 2026–2033
4.5.5 Canada Frameless Solar Panels Market Outlook, by Cell Technology, 2026–2033
4.5.6 Canada Frameless Solar Panels Market Outlook, by Mounting Type, 2026–2033
4.5.7 Canada Frameless Solar Panels Market Outlook, by Application, 2026–2033
4.5.8 Canada Frameless Solar Panels Market Outlook, by End User, 2026–2033
5. Europe Frameless Solar Panels Market Outlook, 2026–2033
5.1 Europe Frameless Solar Panels Market Outlook, by Cell Technology, Value (US$ Billion), 2026–2033
5.1.1 TOPCon
5.1.2 Monocrystalline PERC
5.1.3 Heterojunction (HJT)
5.1.4 Thin-Film (CdTe)
5.1.5 Back-Contact and Others
5.2 Europe Frameless Solar Panels Market Outlook, by Mounting Type, Value (US$ Billion), 2026–2033
5.2.1 Single-Axis Tracker Mount
5.2.2 Fixed-Tilt Ground Mount
5.2.3 Rail-and-Clamp Rooftop Mount
5.2.4 Facade and Structural Glazing Mount
5.2.5 Floating and Canopy Mount
5.3 Europe Frameless Solar Panels Market Outlook, by Application, Value (US$ Billion), 2026–2033
5.3.1 Utility-Scale Power Plants
5.3.2 Commercial and Industrial Rooftop
5.3.3 Agrivoltaics
5.3.4 Building-Integrated Photovoltaics
5.3.5 Residential Rooftop
5.4 Europe Frameless Solar Panels Market Outlook, by End User, Value (US$ Billion), 2026–2033
5.4.1 Independent Power Producers and Utilities
5.4.2 Commercial and Industrial Enterprises
5.4.3 Construction and Real Estate Developers
5.4.4 Agriculture and Horticulture Operators
5.4.5 Residential Owners
5.5 Europe Frameless Solar Panels Market Outlook, by Country, Value (US$ Billion), 2026–2033
5.5.1 Germany Frameless Solar Panels Market Outlook, by Cell Technology, 2026–2033
5.5.2 Germany Frameless Solar Panels Market Outlook, by Mounting Type, 2026–2033
5.5.3 Germany Frameless Solar Panels Market Outlook, by Application, 2026–2033
5.5.4 Germany Frameless Solar Panels Market Outlook, by End User, 2026–2033
5.5.5 Spain Frameless Solar Panels Market Outlook, by Cell Technology, 2026–2033
5.5.6 Spain Frameless Solar Panels Market Outlook, by Mounting Type, 2026–2033
5.5.7 Spain Frameless Solar Panels Market Outlook, by Application, 2026–2033
5.5.8 Spain Frameless Solar Panels Market Outlook, by End User, 2026–2033
5.5.9 Italy Frameless Solar Panels Market Outlook, by Cell Technology, 2026–2033
5.5.10 Italy Frameless Solar Panels Market Outlook, by Mounting Type, 2026–2033
5.5.11 Italy Frameless Solar Panels Market Outlook, by Application, 2026–2033
5.5.12 Italy Frameless Solar Panels Market Outlook, by End User, 2026–2033
5.5.13 France Frameless Solar Panels Market Outlook, by Cell Technology, 2026–2033
5.5.14 France Frameless Solar Panels Market Outlook, by Mounting Type, 2026–2033
5.5.15 France Frameless Solar Panels Market Outlook, by Application, 2026–2033
5.5.16 France Frameless Solar Panels Market Outlook, by End User, 2026–2033
5.5.17 Netherlands Frameless Solar Panels Market Outlook, by Cell Technology, 2026–2033
5.5.18 Netherlands Frameless Solar Panels Market Outlook, by Mounting Type, 2026–2033
5.5.19 Netherlands Frameless Solar Panels Market Outlook, by Application, 2026–2033
5.5.20 Netherlands Frameless Solar Panels Market Outlook, by End User, 2026–2033
6. Asia Pacific Frameless Solar Panels Market Outlook, 2026–2033
6.1 Asia Pacific Frameless Solar Panels Market Outlook, by Cell Technology, Value (US$ Billion), 2026–2033
6.1.1 TOPCon
6.1.2 Monocrystalline PERC
6.1.3 Heterojunction (HJT)
6.1.4 Thin-Film (CdTe)
6.1.5 Back-Contact and Others
6.2 Asia Pacific Frameless Solar Panels Market Outlook, by Mounting Type, Value (US$ Billion), 2026–2033
6.2.1 Single-Axis Tracker Mount
6.2.2 Fixed-Tilt Ground Mount
6.2.3 Rail-and-Clamp Rooftop Mount
6.2.4 Facade and Structural Glazing Mount
6.2.5 Floating and Canopy Mount
6.3 Asia Pacific Frameless Solar Panels Market Outlook, by Application, Value (US$ Billion), 2026–2033
6.3.1 Utility-Scale Power Plants
6.3.2 Commercial and Industrial Rooftop
6.3.3 Agrivoltaics
6.3.4 Building-Integrated Photovoltaics
6.3.5 Residential Rooftop
6.4 Asia Pacific Frameless Solar Panels Market Outlook, by End User, Value (US$ Billion), 2026–2033
6.4.1 Independent Power Producers and Utilities
6.4.2 Commercial and Industrial Enterprises
6.4.3 Construction and Real Estate Developers
6.4.4 Agriculture and Horticulture Operators
6.4.5 Residential Owners
6.5 Asia Pacific Frameless Solar Panels Market Outlook, by Country, Value (US$ Billion), 2026–2033
6.5.1 China Frameless Solar Panels Market Outlook, by Cell Technology, 2026–2033
6.5.2 China Frameless Solar Panels Market Outlook, by Mounting Type, 2026–2033
6.5.3 China Frameless Solar Panels Market Outlook, by Application, 2026–2033
6.5.4 China Frameless Solar Panels Market Outlook, by End User, 2026–2033
6.5.5 India Frameless Solar Panels Market Outlook, by Cell Technology, 2026–2033
6.5.6 India Frameless Solar Panels Market Outlook, by Mounting Type, 2026–2033
6.5.7 India Frameless Solar Panels Market Outlook, by Application, 2026–2033
6.5.8 India Frameless Solar Panels Market Outlook, by End User, 2026–2033
6.5.9 Japan Frameless Solar Panels Market Outlook, by Cell Technology, 2026–2033
6.5.10 Japan Frameless Solar Panels Market Outlook, by Mounting Type, 2026–2033
6.5.11 Japan Frameless Solar Panels Market Outlook, by Application, 2026–2033
6.5.12 Japan Frameless Solar Panels Market Outlook, by End User, 2026–2033
6.5.13 Australia Frameless Solar Panels Market Outlook, by Cell Technology, 2026–2033
6.5.14 Australia Frameless Solar Panels Market Outlook, by Mounting Type, 2026–2033
6.5.15 Australia Frameless Solar Panels Market Outlook, by Application, 2026–2033
6.5.16 Australia Frameless Solar Panels Market Outlook, by End User, 2026–2033
6.5.17 South Korea Frameless Solar Panels Market Outlook, by Cell Technology, 2026–2033
6.5.18 South Korea Frameless Solar Panels Market Outlook, by Mounting Type, 2026–2033
6.5.19 South Korea Frameless Solar Panels Market Outlook, by Application, 2026–2033
6.5.20 South Korea Frameless Solar Panels Market Outlook, by End User, 2026–2033
6.5.21 Vietnam Frameless Solar Panels Market Outlook, by Cell Technology, 2026–2033
6.5.22 Vietnam Frameless Solar Panels Market Outlook, by Mounting Type, 2026–2033
6.5.23 Vietnam Frameless Solar Panels Market Outlook, by Application, 2026–2033
6.5.24 Vietnam Frameless Solar Panels Market Outlook, by End User, 2026–2033
7. Latin America Frameless Solar Panels Market Outlook, 2026–2033
7.1 Latin America Frameless Solar Panels Market Outlook, by Cell Technology, Value (US$ Billion), 2026–2033
7.1.1 TOPCon
7.1.2 Monocrystalline PERC
7.1.3 Heterojunction (HJT)
7.1.4 Thin-Film (CdTe)
7.1.5 Back-Contact and Others
7.2 Latin America Frameless Solar Panels Market Outlook, by Mounting Type, Value (US$ Billion), 2026–2033
7.2.1 Single-Axis Tracker Mount
7.2.2 Fixed-Tilt Ground Mount
7.2.3 Rail-and-Clamp Rooftop Mount
7.2.4 Facade and Structural Glazing Mount
7.2.5 Floating and Canopy Mount
7.3 Latin America Frameless Solar Panels Market Outlook, by Application, Value (US$ Billion), 2026–2033
7.3.1 Utility-Scale Power Plants
7.3.2 Commercial and Industrial Rooftop
7.3.3 Agrivoltaics
7.3.4 Building-Integrated Photovoltaics
7.3.5 Residential Rooftop
7.4 Latin America Frameless Solar Panels Market Outlook, by End User, Value (US$ Billion), 2026–2033
7.4.1 Independent Power Producers and Utilities
7.4.2 Commercial and Industrial Enterprises
7.4.3 Construction and Real Estate Developers
7.4.4 Agriculture and Horticulture Operators
7.4.5 Residential Owners
7.5 Latin America Frameless Solar Panels Market Outlook, by Country, Value (US$ Billion), 2026–2033
7.5.1 Brazil Frameless Solar Panels Market Outlook, by Cell Technology, 2026–2033
7.5.2 Brazil Frameless Solar Panels Market Outlook, by Mounting Type, 2026–2033
7.5.3 Brazil Frameless Solar Panels Market Outlook, by Application, 2026–2033
7.5.4 Brazil Frameless Solar Panels Market Outlook, by End User, 2026–2033
7.5.5 Chile Frameless Solar Panels Market Outlook, by Cell Technology, 2026–2033
7.5.6 Chile Frameless Solar Panels Market Outlook, by Mounting Type, 2026–2033
7.5.7 Chile Frameless Solar Panels Market Outlook, by Application, 2026–2033
7.5.8 Chile Frameless Solar Panels Market Outlook, by End User, 2026–2033
7.5.9 Mexico Frameless Solar Panels Market Outlook, by Cell Technology, 2026–2033
7.5.10 Mexico Frameless Solar Panels Market Outlook, by Mounting Type, 2026–2033
7.5.11 Mexico Frameless Solar Panels Market Outlook, by Application, 2026–2033
7.5.12 Mexico Frameless Solar Panels Market Outlook, by End User, 2026–2033
7.5.13 Peru Frameless Solar Panels Market Outlook, by Cell Technology, 2026–2033
7.5.14 Peru Frameless Solar Panels Market Outlook, by Mounting Type, 2026–2033
7.5.15 Peru Frameless Solar Panels Market Outlook, by Application, 2026–2033
7.5.16 Peru Frameless Solar Panels Market Outlook, by End User, 2026–2033
8. Middle East & Africa Frameless Solar Panels Market Outlook, 2026–2033
8.1 Middle East & Africa Frameless Solar Panels Market Outlook, by Cell Technology, Value (US$ Billion), 2026–2033
8.1.1 TOPCon
8.1.2 Monocrystalline PERC
8.1.3 Heterojunction (HJT)
8.1.4 Thin-Film (CdTe)
8.1.5 Back-Contact and Others
8.2 Middle East & Africa Frameless Solar Panels Market Outlook, by Mounting Type, Value (US$ Billion), 2026–2033
8.2.1 Single-Axis Tracker Mount
8.2.2 Fixed-Tilt Ground Mount
8.2.3 Rail-and-Clamp Rooftop Mount
8.2.4 Facade and Structural Glazing Mount
8.2.5 Floating and Canopy Mount
8.3 Middle East & Africa Frameless Solar Panels Market Outlook, by Application, Value (US$ Billion), 2026–2033
8.3.1 Utility-Scale Power Plants
8.3.2 Commercial and Industrial Rooftop
8.3.3 Agrivoltaics
8.3.4 Building-Integrated Photovoltaics
8.3.5 Residential Rooftop
8.4 Middle East & Africa Frameless Solar Panels Market Outlook, by End User, Value (US$ Billion), 2026–2033
8.4.1 Independent Power Producers and Utilities
8.4.2 Commercial and Industrial Enterprises
8.4.3 Construction and Real Estate Developers
8.4.4 Agriculture and Horticulture Operators
8.4.5 Residential Owners
8.5 Middle East & Africa Frameless Solar Panels Market Outlook, by Country, Value (US$ Billion), 2026–2033
8.5.1 Saudi Arabia Frameless Solar Panels Market Outlook, by Cell Technology, 2026–2033
8.5.2 Saudi Arabia Frameless Solar Panels Market Outlook, by Mounting Type, 2026–2033
8.5.3 Saudi Arabia Frameless Solar Panels Market Outlook, by Application, 2026–2033
8.5.4 Saudi Arabia Frameless Solar Panels Market Outlook, by End User, 2026–2033
8.5.5 United Arab Emirates Frameless Solar Panels Market Outlook, by Cell Technology, 2026–2033
8.5.6 United Arab Emirates Frameless Solar Panels Market Outlook, by Mounting Type, 2026–2033
8.5.7 United Arab Emirates Frameless Solar Panels Market Outlook, by Application, 2026–2033
8.5.8 United Arab Emirates Frameless Solar Panels Market Outlook, by End User, 2026–2033
8.5.9 Egypt Frameless Solar Panels Market Outlook, by Cell Technology, 2026–2033
8.5.10 Egypt Frameless Solar Panels Market Outlook, by Mounting Type, 2026–2033
8.5.11 Egypt Frameless Solar Panels Market Outlook, by Application, 2026–2033
8.5.12 Egypt Frameless Solar Panels Market Outlook, by End User, 2026–2033
8.5.13 Morocco Frameless Solar Panels Market Outlook, by Cell Technology, 2026–2033
8.5.14 Morocco Frameless Solar Panels Market Outlook, by Mounting Type, 2026–2033
8.5.15 Morocco Frameless Solar Panels Market Outlook, by Application, 2026–2033
8.5.16 Morocco Frameless Solar Panels Market Outlook, by End User, 2026–2033
8.5.17 South Africa Frameless Solar Panels Market Outlook, by Cell Technology, 2026–2033
8.5.18 South Africa Frameless Solar Panels Market Outlook, by Mounting Type, 2026–2033
8.5.19 South Africa Frameless Solar Panels Market Outlook, by Application, 2026–2033
8.5.20 South Africa Frameless Solar Panels Market Outlook, by End User, 2026–2033
9. Competitive Landscape
9.1 Industry Leaders
9.2 Company Profiles
9.2.1 LONGi Green Energy Technology Co., Ltd.
9.2.2 JinkoSolar Holding Co., Ltd.
9.2.3 Trina Solar Co., Ltd.
9.2.4 JA Solar Technology Co., Ltd.
9.2.5 Canadian Solar Inc.
9.2.6 First Solar, Inc.
9.2.7 Hanwha Qcells
9.2.8 Risen Energy Co., Ltd.
9.2.9 Astronergy (Chint Solar)
9.2.10 Maxeon Solar Technologies, Ltd.
9.2.11 REC Group
9.2.12 Meyer Burger Technology AG
9.2.13 SOLARWATT GmbH
9.2.14 Waaree Energies Limited
9.2.15 Vikram Solar Limited
10. Appendix
10.1 Research Methodology
10.2 Report Assumptions
10.3 Acronyms and Abbreviations
| By Cell Technology | TOPCon, Monocrystalline PERC, Heterojunction (HJT), Thin-Film (CdTe), Back-Contact and Others |
| By Mounting Type | Single-Axis Tracker Mount, Fixed-Tilt Ground Mount, Rail-and-Clamp Rooftop Mount, Facade and Structural Glazing Mount, Floating and Canopy Mount |
| By Application | Utility-Scale Power Plants, Commercial and Industrial Rooftop, Agrivoltaics, Building-Integrated Photovoltaics, Residential Rooftop |
| By End User | Independent Power Producers and Utilities, Commercial and Industrial Enterprises, Construction and Real Estate Developers, Agriculture and Horticulture Operators, Residential Owners |
| By Region | North America, Europe, Asia Pacific, Latin America, Middle East & Africa |
Our Research Methodology
Considering the volatility of business today, traditional approaches to strategizing a game plan can be unfruitful if not detrimental. True ambiguity is no way to determine a forecast. A myriad of predetermined factors must be accounted for such as the degree of risk involved, the magnitude of circumstances, as well as conditions or consequences that are not known or unpredictable. To circumvent binary views that cast uncertainty, the application of market research intelligence to strategically posture, move, and enable actionable outcomes is necessary.
View Methodology
Quality Assured
Rigorous Validation Process

Confidentiality Assured
End-to-end Data Security

Custom Research Services
Tailored To Your Objectives
FAQs
The market is valued at US$ 9.8 billion in 2026 and is projected to reach US$ 20.9 billion by 2033 on steady demand.
The market should grow at a CAGR of 11.4% between 2026 and 2033, adding an absolute opportunity of US$ 11.1 billion.
Utility-scale power plants lead with 47% share in 2026, while building-integrated photovoltaics grows fastest at a 15.8% CAGR through 2033.
Asia Pacific holds the largest share at 46% in 2026, supported by concentrated cell, module and solar glass manufacturing capacity.
The market is moderately concentrated, with large integrated manufacturers supplying most volume and specialist producers serving architectural and agrivoltaic niches.
Related Reports
Building Energy Management Systems Market Size, Share, Insights, Competitive Landscape, and Forecast 2026 to 2033
Explore the building energy management systems market outlook for 2026–2033, with component trends, deployment insights, regions, and key suppliers.
Fuel Management System Market Size, Share, Insights, Competitive Landscape, and Forecast 2026 to 2033
The global fuel management system market is valued at US$21.4 billion in 2026, reaching US$38.6 billion by 2033, growing at an 8.8% CAGR
Oil Immersed Current Transformer Market Size, Share, Insights, Competitive Landscape, and Forecast 2026 to 2033
The oil immersed current transformer market is projected to grow from US$2.4 billion in 2026 to US$3.6 billion by 2033 at a 6.0% CAGR.
Load Forecasting Solution Market Size, Share, Insights, Competitive Landscape, and Forecast 2026 to 2033
The load forecasting solution market is projected to reach US$3.0 billion by 2033. Explore demand by forecast horizon, deployment mode, and end user.
Enhanced Oil Recovery Market Size, Share, Insights, Competitive Landscape, and Forecast 2026 to 2033
The global enhanced oil recovery market is valued at US$46.5 billion in 2026, reaching US$58.9 billion by 2033, growing at a 3.43% CAGR
Biochar Gasification Market Size, Share, Insights, Competitive Landscape, and Forecast 2026 to 2033
The global biochar gasification market is valued at US$0.6 billion in 2026, reaching US$1.4 billion by 2033, growing at a 12.87% CAGR