



GMO Testing Market
GMO Testing Market Size, Share, Insights, Competitive Landscape, and Forecast 2026 to 2033
GMO Testing Market Size and Trend Analysis
How Large Is the GMO Testing Market Today?
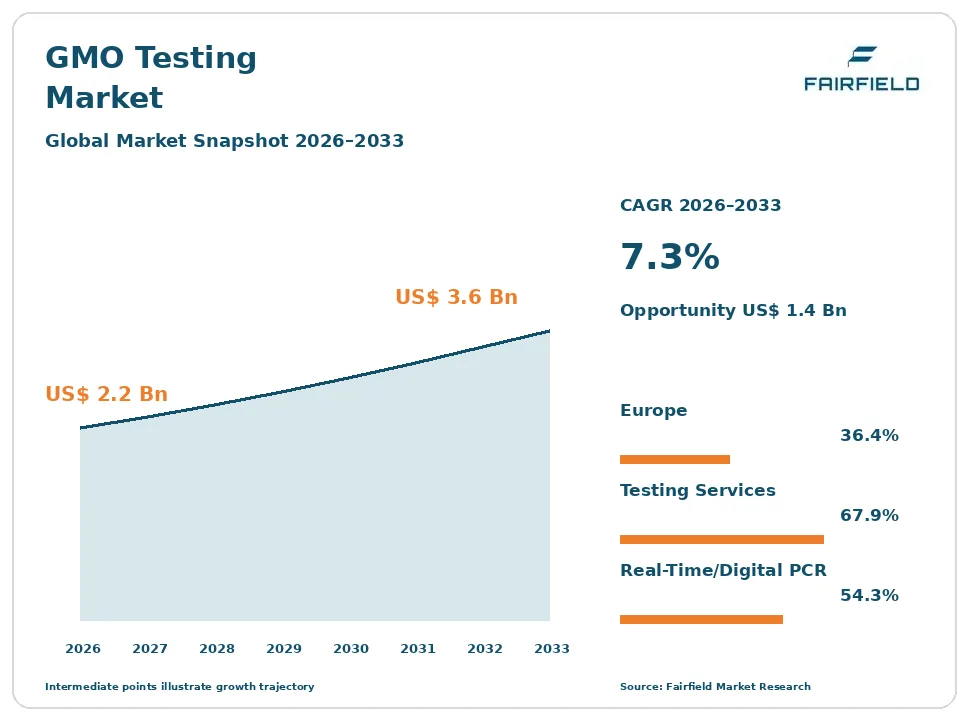
The global GMO testing market size is expected to be valued at US$ 2.2 billion in 2026 and projected to reach US$ 3.6 billion by 2033, growing at a CAGR of 7.3% between 2026 and 2033.
The market grew at roughly a 6.4% CAGR between 2020 and 2025, tracking the volume of grain, feed and processed food crossing borders under labelling and traceability rules. Three factors carry the forecast. Events authorised in exporting countries but not yet in importing ones force routine screening of commodity shipments. Private non-genetically modified and organic verification schemes add testing that no law requires. Identity preservation in feed and grain supply chains generates repeat sampling at every transfer point. Growth is therefore steady and compliance-led, and this remains a laboratory services business rather than an instrument technology market.
Key Report Takeaways
- By Offering: Testing services held 67.9% share in 2026, while kits and reagents are projected to expand at an 8.1% CAGR through 2033, as manufacturers bring routine screening in-house to cut turnaround time.
- By Technology: Real-time and digital polymerase chain reaction held 54.3% share in 2026, while next-generation sequencing is projected to grow at a 12.4% CAGR through 2033, because it identifies unknown and unauthorised events that targeted assays miss.
- By Sample Type: Grain and raw commodities held 36.8% share in 2026, while processed food is projected to advance at an 8.4% CAGR through 2033, reflecting retailer specifications that extend verification to finished products.
- By End User: Contract and commercial testing laboratories held 48.5% share in 2026, while in-house food and feed manufacturer laboratories are projected to rise at an 8.2% CAGR through 2033, driven by cost per sample and scheduling control.
- By Geography: Europe held 36.4% share in 2026, while Asia Pacific is projected to grow at a 9.1% CAGR through 2033, led by import screening in China, Japan, South Korea and India.
Global GMO Testing Market Trends and Insights
Drivers Impact Analysis
| Driver | Impact on CAGR Forecast | Geographic Relevance | Impact Timeline |
| Asynchronous event approvals across trading partners | High | Europe, Asia Pacific, global trade | Short term (≤2 years) |
| Private non-genetically modified and organic verification schemes | Medium | North America, Europe | Medium term (2–4 years) |
Two forces generate most of the recurring sample volume behind the forecast.
Asynchronous Approvals Force Repeated Screening of Every Traded Grain Consignment
Approval timing mismatches between countries create the most reliable source of recurring test volume. A trait cleared for cultivation in an exporting country may remain unauthorised in an importing one, and under a zero-tolerance approach any detectable presence can render a shipment non-compliant. Traders therefore screen before loading, on arrival and sometimes at intermediate transfer points, which multiplies samples per cargo.
The mechanism is regulatory divergence rather than technology. Approval dossiers move through separate scientific and political processes in each jurisdiction, with different timelines and evidence requirements, so the authorised event lists never fully align. Soybean, maize, rapeseed and cotton derivatives are the most affected commodities. The Cartagena Protocol on Biosafety adds documentation duties for transboundary movements of living modified organisms, reinforcing the paper trail that laboratory results support.
Private Non-Genetically Modified and Organic Verification Schemes Add Testing No Law Requires
Private standards now generate a substantial block of demand that sits entirely outside statutory obligation. Retailer specifications, non-genetically modified verification programmes and organic certification schemes that exclude modified inputs all require documented testing at defined points in the chain. Because these are contractual rather than legal requirements, the sampling frequency is often higher than regulation demands, and suppliers pay to keep listings.
The commercial driver is brand risk. A retailer or branded manufacturer that makes a non-genetically modified claim must be able to defend it, so verification extends back through ingredient suppliers, feed used in animal production and co-products such as lecithin and protein isolates. Dairy and poultry supply chains in Germany, France, Austria and the United States are notable examples. Each audited supplier becomes an additional recurring testing account.
Restraints Impact Analysis
| Restraint | Impact on CAGR Forecast | Geographic Relevance | Impact Timeline |
| Price competition and buyer treatment of testing as a compliance cost | High | Global | Short term (≤2 years) |
| Quantification limits in degraded matrices and method maintenance costs | Medium | Europe, North America | Long term (≥4 years) |
Two constraints keep growth measured despite expanding regulatory scope.
Per-Sample Price Competition Compresses Laboratory Margins Across the Testing Sector
Pricing pressure is the sharpest constraint on revenue growth in this sector. Buyers treat genetic modification screening as a compliance cost to be minimised, not a value-adding service, so procurement is run through competitive tenders on price per sample and turnaround time. Laboratories with similar accreditations and method scopes find it hard to differentiate, and incumbents frequently cut rates to retain annual grain and feed contracts.
The cost structure explains why this bites. Screening assays are highly standardised, automation has reduced hands-on labour, and large laboratory networks spread fixed overhead across very high sample throughput. That lets the largest networks quote rates smaller independents cannot match while still covering accreditation, proficiency testing and reference material costs. The result is consolidation pressure and thin margins on routine screening, with profitability concentrated in complex quantification and identification work.
Degraded DNA in Processed Foods and Rising Method Maintenance Costs Limit Testing Reliability
Technical limits constrain what laboratories can actually deliver, particularly at the processed end of the chain. Heat, pressure, enzymatic treatment and refining fragment DNA, so a result that is straightforward in whole grain becomes unreliable in starch, lecithin, protein isolate or a baked product. Quantification against a labelling threshold is especially difficult, because degraded template and inhibitory matrix components distort copy number estimates.
Method maintenance is the second cost. The list of events in commercial circulation keeps growing, and each requires validated detection methods, event-specific primers and certified reference materials to calibrate against. Laboratories must hold ISO 17025 accreditation, participate in proficiency schemes and follow the ISO 21569, ISO 21570 and ISO 21571 series on methods of analysis for detecting genetically modified organisms. Those fixed obligations rise faster than achievable per-sample prices.
Market Opportunities
Two revenue pools sit beyond routine threshold screening.
Unresolved New Genomic Techniques Rules Create Demand for Documentation and Advanced Analysis
The sector’s largest uncertainty is also, in the near term, a commercial opportunity. The European Union operates a framework built on detecting authorised events above a threshold and rejecting unauthorised ones. Yet products of newer gene-editing techniques may carry changes that analysis cannot distinguish from conventional breeding, so a detection-led regime cannot be enforced by testing alone for that category. The European Commission has advanced a legislative proposal on new genomic techniques that would treat some edited plants differently. The question remains unresolved and politically contested.
Until it settles, buyers and regulators lean harder on documentation, identity preservation and more sophisticated analytical work. Seed companies, grain traders and importers are the customer groups paying for this. Laboratories offering method development, traceability auditing and support for evidence packages can capture work that routine screening does not cover.
Next-Generation Sequencing Opens an Identification Market That Targeted Assays Cannot Serve
Next-generation sequencing creates a distinct high-value revenue pool centred on identification rather than screening. Targeted polymerase chain reaction assays answer only the question they were designed for, so an unexpected or unauthorised construct may pass undetected. Sequencing-based approaches can characterise insertions without prior knowledge of the event, which turns an unanswerable enquiry into a billable investigation at a far higher price per sample.
The demand comes from border control and government laboratories handling suspect consignments, seed companies verifying the genetic integrity of breeding lines, and importers facing a disputed result that must be resolved. Capture requires sequencing platforms, bioinformatics capability and validated interpretation workflows, which favours larger networks and specialist laboratories. The European Union Reference Laboratory for GM Food and Feed and the European Network of GMO Laboratories provide the validation context that makes such results defensible.
Segment Analysis
By Offering: Testing Services Dominate While Kits and Reagents Expand Fastest
Testing services accounted for 67.9% of 2026 revenue, because most buyers lack the accredited facilities, validated methods and proficiency records needed to produce a result that a regulator or customer will accept. Outsourcing also transfers liability for the analysis. Kits and reagents are the fastest-growing offering at an 8.1% CAGR through 2033, as food and feed manufacturers bring routine screening in-house to shorten turnaround and reduce cost per sample on high-frequency checks. Certified reference materials and proficiency testing form a smaller but essential segment, since every quantitative result depends on calibration against recognised standards. The practical implication is a split market: external laboratories retain confirmatory, quantitative and disputed work, while simple presence-or-absence screening migrates toward the point where the sample is taken.
By Technology: Polymerase Chain Reaction Carries Volume as Sequencing Grows Quickest
Real-time and digital polymerase chain reaction held 54.3% of 2026 revenue, the reference approach for both screening and quantification against labelling thresholds, with validated methods published and recognised internationally. End-point polymerase chain reaction and multiplex screening remain widely used for low-cost initial sorting, while immunoassay and lateral flow strip tests dominate rapid checks at grain elevators and receiving bays where no laboratory is available. Next-generation sequencing is the fastest-growing technology at a 12.4% CAGR through 2033, because it can characterise unknown or unauthorised constructs that targeted assays are blind to. Cost and bioinformatics requirements still restrict it to specialist and government laboratories. The consequence is a tiered methodology, with cheap screening at the front and sequencing reserved for identification and dispute resolution.
By Sample Type: Grain and Raw Commodities Lead as Processed Food Testing Accelerates
Grain and raw commodities represented 36.8% of 2026 revenue, the largest pool because bulk soybean, maize, rapeseed and cotton derivatives move across borders in enormous volumes and are tested repeatedly along the way. Seed testing commands high value per sample, since purity verification protects the commercial worth of a breeding programme, while animal feed generates steady throughput under traceability requirements. Processed food is the fastest-growing sample type at an 8.4% CAGR through 2033, driven by retailer specifications that push verification all the way to finished products. That growth is technically demanding, because refining and heat treatment degrade DNA and complicate quantification. Laboratories that can deliver defensible results in difficult matrices therefore command better pricing than those limited to whole-grain screening.
By End User: Contract Laboratories Lead While Manufacturer Laboratories Grow Faster
Contract and commercial testing laboratories held 48.5% of 2026 revenue, reflecting their accreditation scope, geographic coverage near ports and processing hubs, and ability to issue certificates that buyers and regulators accept. Government and border control laboratories hold a smaller share but set the methodological benchmark that commercial providers are measured against. Seed company laboratories test intensively, though mostly for internal breeding and purity programmes rather than for sale. In-house food and feed manufacturer laboratories are the fastest-growing end user at an 8.2% CAGR through 2033, as processors install screening capability to control scheduling and cut per-sample spend on routine checks. The result is a shifting boundary rather than displacement, with manufacturers absorbing high-frequency screening while continuing to send confirmatory, quantitative and contested samples to accredited external providers.
Geography Analysis
North America Testing Demand Rests on Disclosure Rules and Private Verification Rather Than Thresholds
North America accounted for 27.8% of 2026 revenue and is growing at roughly 6.5% annually, with the United States and Canada both significant. The regulatory logic differs sharply from other major markets. The US National Bioengineered Food Disclosure Standard works through disclosure rather than analytical thresholds, and highly refined ingredients containing no detectable modified genetic material fall outside its requirements, so statutory testing demand is narrower than the volume of trade would suggest.
Private standards fill much of that space. Non-genetically modified verification programmes, organic certification and retailer specifications drive recurring sampling across grain handling, dairy, poultry and ingredient manufacturing. Export screening for destination markets adds further volume. The main constraint is aggressive price competition among large laboratory networks, which keeps routine screening margins thin despite healthy sample counts.
Which Region Is Leading the GMO Testing Market?
Europe leads the GMO testing market with 36.4% of global revenue in 2026, growing at about 6.4% annually. Leadership follows directly from the strictest regulatory architecture in the world. The regional rules on genetically modified food and feed and on traceability and labelling require labelling above a 0.9% adventitious presence threshold and reject unauthorised events outright, which makes quantitative analysis a routine condition of trade.
Germany, France, the Netherlands, Italy and Spain generate the most volume, concentrated around feed imports entering Rotterdam, Hamburg and other major ports. The European Union Reference Laboratory for GM Food and Feed maintains the validated method database, and the European Network of GMO Laboratories harmonises practice across national laboratories. The unresolved legislative question over new genomic techniques is the defining uncertainty for regional testing demand.
Which Region Is Growing Fastest in the GMO Testing Market?
Asia Pacific is the fastest-growing region in this market, advancing at a 9.1% CAGR between 2026 and 2033 from a 24.1% revenue share in 2026. Growth is import-driven. China, Japan, South Korea, Taiwan and India are major buyers of soybean, maize and rapeseed, and each operates its own approval list and labelling regime, so arriving cargoes must be screened against domestic authorisations rather than exporter ones.
Laboratory capacity is expanding quickly to meet that demand, with accredited facilities opening near major ports and crushing complexes. Australia and New Zealand apply their own labelling framework through a joint food standards system. The region’s growth also reflects rising domestic food manufacturing and retailer specifications. The main barrier is uneven accreditation depth across smaller markets, which limits mutual recognition of results.
Latin America Tests at the Origin End of the World’s Largest Grain Export Flows
Latin America held 7.4% of 2026 revenue and is expanding at roughly 7.9% annually. Brazil, Argentina, Paraguay and Uruguay are among the world’s largest exporters of soybean and maize, so testing here happens at origin, before loading, to satisfy the requirements of destination buyers rather than domestic rules. Identity preserved and non-genetically modified soybean programmes serving feed buyers abroad are an important and well-established volume source.
Barriers persist. Accredited laboratory capacity is concentrated in a few cities, sampling at inland collection points is inconsistent, and currency volatility complicates investment in instrumentation and reference materials. Brazilian labelling requirements provide some domestic demand. The clearest opportunity is in segregated, traceable soybean supply chains, where documented verification earns a premium that routine export screening does not.
Middle East & Africa Builds Testing Capacity Around Import Control and Food Security Programmes
Middle East & Africa represented 4.3% of 2026 revenue, growing at about 7.2% annually from the smallest base. Demand is concentrated in grain-importing economies, with Saudi Arabia, the United Arab Emirates, Egypt, Turkey and South Africa accounting for most activity. Several countries operate approval lists and labelling rules for imported food and feed, and border control laboratories screen arriving wheat, maize and soybean consignments accordingly. South Africa is unusual in the region as a cultivator as well as an importer.
Constraints are structural. Accredited capacity is limited outside a few national laboratories, trained analysts are scarce, and reference materials and consumables must be imported at significant cost. Public investment in food control infrastructure is the most important change underway, and it is gradually shifting work from overseas laboratories to domestic ones.
Competitive Landscape
The GMO testing market is moderately concentrated. A small group of global testing, inspection and certification networks handles a large share of accredited service volume, while a long tail of national laboratories, university-linked facilities and specialist providers serves local and niche requirements. Concentration is higher in services than in consumables, where kit and reagent supply is divided among life science companies with established molecular biology portfolios. Consolidation has been continuous for years, as large networks absorb regional food testing laboratories to add geographic coverage near ports and processing hubs, and because accreditation, proficiency participation and reference material costs reward scale.
Competition rests on accreditation scope, turnaround time, price per sample, proximity to the point of sampling, and the breadth of events a laboratory can detect and quantify. Method validation status matters greatly, because results obtained with recognised methods are far harder to contest. Consumables suppliers compete on assay sensitivity, multiplexing capability, workflow simplicity and the availability of matching reference materials. New entrants are mostly specialists in sequencing-based identification and providers offering screening systems designed for non-laboratory users at grain receiving points.
Strategic activity centres on extending analytical scope and moving closer to the customer. Providers are broadening event panels, adding digital polymerase chain reaction and sequencing capability, building bioinformatics support, and integrating testing with traceability and certification services so a single supplier can cover verification end to end.
The prevailing direction is toward bundled assurance rather than standalone analysis. Vendors are positioning testing as one component of supply chain verification, which protects margin in a sector where routine screening prices continue to fall.
GMO Testing Industry Leaders
- Eurofins Scientific SE
- SGS SA
- Bureau Veritas SA
- Intertek Group plc
- Neogen Corporation
Recent Industry Developments
- April 2004: The European Union’s regulations on genetically modified food and feed and on traceability and labelling became applicable, setting the 0.9% labelling threshold for adventitious presence — establishing quantitative analysis as a routine condition of trade.
- July 2018: The Court of Justice of the European Union ruled that organisms obtained by directed mutagenesis fall within the scope of the regional genetically modified organism legislation — extending the regulatory perimeter to techniques the detection framework was never designed for.
- January 2022: Mandatory compliance began with the US National Bioengineered Food Disclosure Standard — confirming a disclosure-based approach that excludes highly refined ingredients with no detectable modified genetic material.
- July 2023: The European Commission published a legislative proposal on plants obtained by certain new genomic techniques — opening a debate on whether some edited plants should sit outside the existing detection and labelling regime.
- February 2024: The European Parliament adopted its first reading position on that proposal, with negotiations continuing and no agreed final text — leaving the sector’s central regulatory question open.
Companies Covered in the Report
- Eurofins Scientific SE
- SGS SA
- Bureau Veritas SA
- Intertek Group plc
- Mérieux NutriSciences Corporation
- ALS Limited
- FoodChain ID Group, Inc.
- Neogen Corporation
- Romer Labs Division Holding GmbH
- EnviroLogix Inc.
- Thermo Fisher Scientific Inc.
- Bio-Rad Laboratories, Inc.
- QIAGEN N.V.
- LGC Limited
GMO Testing Market Report Scope
This report covers analytical testing that detects, identifies and quantifies genetically modified material in seed, grain, food, feed and processed products. It counts laboratory testing services together with kits, reagents, certified reference materials and proficiency schemes, and excludes sales of general-purpose laboratory instruments. Coverage spans contract, in-house, seed company and government laboratories. The base year is 2025, and the forecast period runs from 2026 to 2033, with all values in US$ Billion.
Offering
- Testing Services
- Kits and Reagents
- Certified Reference Materials and Proficiency Testing
Technology
- Real-Time and Digital Polymerase Chain Reaction
- End-Point Polymerase Chain Reaction and Multiplex Screening
- Immunoassay and Lateral Flow Strip Tests
- Next-Generation Sequencing
Sample Type
- Seed
- Grain and Raw Commodities
- Processed Food
- Animal Feed
End User
- Contract and Commercial Testing Laboratories
- In-House Food and Feed Manufacturer Laboratories
- Seed Company Laboratories
- Government and Border Control Laboratories
Regions
- North America
- Europe
- Asia Pacific
- Latin America
- Middle East & Africa
Key Questions Answered in the Report
How big is the GMO testing market in 2026?
The GMO testing market is valued at US$ 2.2 billion in 2026, covering laboratory services, kits, reagents, reference materials and proficiency schemes.
What is the forecast size and growth rate for GMO testing?
The market is projected to reach US$ 3.6 billion by 2033, growing at a 7.3% CAGR and adding US$ 1.4 billion over the period.
Which offering leads the GMO testing market?
Testing services lead with 67.9% of 2026 revenue, because accreditation, validated methods and proficiency records are needed for results buyers accept.
Which technology and region are growing fastest in this market?
Next-generation sequencing grows fastest at 12.4%, while Asia Pacific is the fastest-growing region at a 9.1% CAGR through 2033.
How concentrated is the GMO testing market?
Concentration is medium, with several global testing networks holding most accredited service volume alongside many national and specialist laboratories.
1. Executive Summary
1.1. Global GMO Testing Market Snapshot
1.2. Future Projections
1.3. Key Report Takeaways
1.4. Regional Snapshot
2. Market Overview
2.1. Market Definition and Report Scope
2.2. Historical Trends 2020–2025
2.3. Market Dynamics
2.3.1. Drivers
2.3.1.1. Asynchronous Approvals Force Repeated Screening of Every Traded Grain Consignment
2.3.1.2. Private Non-Genetically Modified and Organic Verification Schemes Add Testing No Law Requires
2.3.2. Restraints
2.3.2.1. Per-Sample Price Competition Compresses Laboratory Margins Across the Testing Sector
2.3.2.2. Degraded DNA in Processed Foods and Rising Method Maintenance Costs Limit Testing Reliability
2.3.3. Market Opportunities
2.3.3.1. Unresolved New Genomic Techniques Rules Create Demand for Documentation and Advanced Analysis
2.3.3.2. Next-Generation Sequencing Opens an Identification Market That Targeted Assays Cannot Serve
3. Global GMO Testing Market Outlook, 2020–2033
3.1. Global GMO Testing Market Outlook, by Offering, Value (US$ Billion), 2020–2033
3.1.1. Testing Services
3.1.2. Kits and Reagents
3.1.3. Certified Reference Materials and Proficiency Testing
3.2. Global GMO Testing Market Outlook, by Technology, Value (US$ Billion), 2020–2033
3.2.1. Real-Time and Digital Polymerase Chain Reaction
3.2.2. End-Point Polymerase Chain Reaction and Multiplex Screening
3.2.3. Immunoassay and Lateral Flow Strip Tests
3.2.4. Next-Generation Sequencing
3.3. Global GMO Testing Market Outlook, by Sample Type, Value (US$ Billion), 2020–2033
3.3.1. Seed
3.3.2. Grain and Raw Commodities
3.3.3. Processed Food
3.3.4. Animal Feed
3.4. Global GMO Testing Market Outlook, by End User, Value (US$ Billion), 2020–2033
3.4.1. Contract and Commercial Testing Laboratories
3.4.2. In-House Food and Feed Manufacturer Laboratories
3.4.3. Seed Company Laboratories
3.4.4. Government and Border Control Laboratories
3.5. Global GMO Testing Market Outlook, by Region, Value (US$ Billion), 2020–2033
3.5.1. North America
3.5.2. Europe
3.5.3. Asia Pacific
3.5.4. Latin America
3.5.5. Middle East & Africa
4. North America GMO Testing Market Outlook, 2020–2033
4.1. North America GMO Testing Market Outlook, by Offering, Value (US$ Billion), 2020–2033
4.1.1. Testing Services
4.1.2. Kits and Reagents
4.1.3. Certified Reference Materials and Proficiency Testing
4.2. North America GMO Testing Market Outlook, by Technology, Value (US$ Billion), 2020–2033
4.2.1. Real-Time and Digital Polymerase Chain Reaction
4.2.2. End-Point Polymerase Chain Reaction and Multiplex Screening
4.2.3. Immunoassay and Lateral Flow Strip Tests
4.2.4. Next-Generation Sequencing
4.3. North America GMO Testing Market Outlook, by Sample Type, Value (US$ Billion), 2020–2033
4.3.1. Seed
4.3.2. Grain and Raw Commodities
4.3.3. Processed Food
4.3.4. Animal Feed
4.4. North America GMO Testing Market Outlook, by End User, Value (US$ Billion), 2020–2033
4.4.1. Contract and Commercial Testing Laboratories
4.4.2. In-House Food and Feed Manufacturer Laboratories
4.4.3. Seed Company Laboratories
4.4.4. Government and Border Control Laboratories
4.5. North America GMO Testing Market Outlook, by Country, Value (US$ Billion), 2020–2033
4.5.1. United States GMO Testing Market Outlook, by Offering, 2020–2033
4.5.2. United States GMO Testing Market Outlook, by Technology, 2020–2033
4.5.3. United States GMO Testing Market Outlook, by Sample Type, 2020–2033
4.5.4. United States GMO Testing Market Outlook, by End User, 2020–2033
4.5.5. Canada GMO Testing Market Outlook, by Offering, 2020–2033
4.5.6. Canada GMO Testing Market Outlook, by Technology, 2020–2033
4.5.7. Canada GMO Testing Market Outlook, by Sample Type, 2020–2033
4.5.8. Canada GMO Testing Market Outlook, by End User, 2020–2033
5. Europe GMO Testing Market Outlook, 2020–2033
5.1. Europe GMO Testing Market Outlook, by Offering, Value (US$ Billion), 2020–2033
5.1.1. Testing Services
5.1.2. Kits and Reagents
5.1.3. Certified Reference Materials and Proficiency Testing
5.2. Europe GMO Testing Market Outlook, by Technology, Value (US$ Billion), 2020–2033
5.2.1. Real-Time and Digital Polymerase Chain Reaction
5.2.2. End-Point Polymerase Chain Reaction and Multiplex Screening
5.2.3. Immunoassay and Lateral Flow Strip Tests
5.2.4. Next-Generation Sequencing
5.3. Europe GMO Testing Market Outlook, by Sample Type, Value (US$ Billion), 2020–2033
5.3.1. Seed
5.3.2. Grain and Raw Commodities
5.3.3. Processed Food
5.3.4. Animal Feed
5.4. Europe GMO Testing Market Outlook, by End User, Value (US$ Billion), 2020–2033
5.4.1. Contract and Commercial Testing Laboratories
5.4.2. In-House Food and Feed Manufacturer Laboratories
5.4.3. Seed Company Laboratories
5.4.4. Government and Border Control Laboratories
5.5. Europe GMO Testing Market Outlook, by Country, Value (US$ Billion), 2020–2033
5.5.1. Germany GMO Testing Market Outlook, by Offering, 2020–2033
5.5.2. Germany GMO Testing Market Outlook, by Technology, 2020–2033
5.5.3. Germany GMO Testing Market Outlook, by Sample Type, 2020–2033
5.5.4. Germany GMO Testing Market Outlook, by End User, 2020–2033
5.5.5. France GMO Testing Market Outlook, by Offering, 2020–2033
5.5.6. France GMO Testing Market Outlook, by Technology, 2020–2033
5.5.7. France GMO Testing Market Outlook, by Sample Type, 2020–2033
5.5.8. France GMO Testing Market Outlook, by End User, 2020–2033
5.5.9. Netherlands GMO Testing Market Outlook, by Offering, 2020–2033
5.5.10. Netherlands GMO Testing Market Outlook, by Technology, 2020–2033
5.5.11. Netherlands GMO Testing Market Outlook, by Sample Type, 2020–2033
5.5.12. Netherlands GMO Testing Market Outlook, by End User, 2020–2033
5.5.13. Italy GMO Testing Market Outlook, by Offering, 2020–2033
5.5.14. Italy GMO Testing Market Outlook, by Technology, 2020–2033
5.5.15. Italy GMO Testing Market Outlook, by Sample Type, 2020–2033
5.5.16. Italy GMO Testing Market Outlook, by End User, 2020–2033
5.5.17. Spain GMO Testing Market Outlook, by Offering, 2020–2033
5.5.18. Spain GMO Testing Market Outlook, by Technology, 2020–2033
5.5.19. Spain GMO Testing Market Outlook, by Sample Type, 2020–2033
5.5.20. Spain GMO Testing Market Outlook, by End User, 2020–2033
6. Asia Pacific GMO Testing Market Outlook, 2020–2033
6.1. Asia Pacific GMO Testing Market Outlook, by Offering, Value (US$ Billion), 2020–2033
6.1.1. Testing Services
6.1.2. Kits and Reagents
6.1.3. Certified Reference Materials and Proficiency Testing
6.2. Asia Pacific GMO Testing Market Outlook, by Technology, Value (US$ Billion), 2020–2033
6.2.1. Real-Time and Digital Polymerase Chain Reaction
6.2.2. End-Point Polymerase Chain Reaction and Multiplex Screening
6.2.3. Immunoassay and Lateral Flow Strip Tests
6.2.4. Next-Generation Sequencing
6.3. Asia Pacific GMO Testing Market Outlook, by Sample Type, Value (US$ Billion), 2020–2033
6.3.1. Seed
6.3.2. Grain and Raw Commodities
6.3.3. Processed Food
6.3.4. Animal Feed
6.4. Asia Pacific GMO Testing Market Outlook, by End User, Value (US$ Billion), 2020–2033
6.4.1. Contract and Commercial Testing Laboratories
6.4.2. In-House Food and Feed Manufacturer Laboratories
6.4.3. Seed Company Laboratories
6.4.4. Government and Border Control Laboratories
6.5. Asia Pacific GMO Testing Market Outlook, by Country, Value (US$ Billion), 2020–2033
6.5.1. China GMO Testing Market Outlook, by Offering, 2020–2033
6.5.2. China GMO Testing Market Outlook, by Technology, 2020–2033
6.5.3. China GMO Testing Market Outlook, by Sample Type, 2020–2033
6.5.4. China GMO Testing Market Outlook, by End User, 2020–2033
6.5.5. Japan GMO Testing Market Outlook, by Offering, 2020–2033
6.5.6. Japan GMO Testing Market Outlook, by Technology, 2020–2033
6.5.7. Japan GMO Testing Market Outlook, by Sample Type, 2020–2033
6.5.8. Japan GMO Testing Market Outlook, by End User, 2020–2033
6.5.9. South Korea GMO Testing Market Outlook, by Offering, 2020–2033
6.5.10. South Korea GMO Testing Market Outlook, by Technology, 2020–2033
6.5.11. South Korea GMO Testing Market Outlook, by Sample Type, 2020–2033
6.5.12. South Korea GMO Testing Market Outlook, by End User, 2020–2033
6.5.13. Taiwan GMO Testing Market Outlook, by Offering, 2020–2033
6.5.14. Taiwan GMO Testing Market Outlook, by Technology, 2020–2033
6.5.15. Taiwan GMO Testing Market Outlook, by Sample Type, 2020–2033
6.5.16. Taiwan GMO Testing Market Outlook, by End User, 2020–2033
6.5.17. India GMO Testing Market Outlook, by Offering, 2020–2033
6.5.18. India GMO Testing Market Outlook, by Technology, 2020–2033
6.5.19. India GMO Testing Market Outlook, by Sample Type, 2020–2033
6.5.20. India GMO Testing Market Outlook, by End User, 2020–2033
6.5.21. Australia GMO Testing Market Outlook, by Offering, 2020–2033
6.5.22. Australia GMO Testing Market Outlook, by Technology, 2020–2033
6.5.23. Australia GMO Testing Market Outlook, by Sample Type, 2020–2033
6.5.24. Australia GMO Testing Market Outlook, by End User, 2020–2033
6.5.25. New Zealand GMO Testing Market Outlook, by Offering, 2020–2033
6.5.26. New Zealand GMO Testing Market Outlook, by Technology, 2020–2033
6.5.27. New Zealand GMO Testing Market Outlook, by Sample Type, 2020–2033
6.5.28. New Zealand GMO Testing Market Outlook, by End User, 2020–2033
7. Latin America GMO Testing Market Outlook, 2020–2033
7.1. Latin America GMO Testing Market Outlook, by Offering, Value (US$ Billion), 2020–2033
7.1.1. Testing Services
7.1.2. Kits and Reagents
7.1.3. Certified Reference Materials and Proficiency Testing
7.2. Latin America GMO Testing Market Outlook, by Technology, Value (US$ Billion), 2020–2033
7.2.1. Real-Time and Digital Polymerase Chain Reaction
7.2.2. End-Point Polymerase Chain Reaction and Multiplex Screening
7.2.3. Immunoassay and Lateral Flow Strip Tests
7.2.4. Next-Generation Sequencing
7.3. Latin America GMO Testing Market Outlook, by Sample Type, Value (US$ Billion), 2020–2033
7.3.1. Seed
7.3.2. Grain and Raw Commodities
7.3.3. Processed Food
7.3.4. Animal Feed
7.4. Latin America GMO Testing Market Outlook, by End User, Value (US$ Billion), 2020–2033
7.4.1. Contract and Commercial Testing Laboratories
7.4.2. In-House Food and Feed Manufacturer Laboratories
7.4.3. Seed Company Laboratories
7.4.4. Government and Border Control Laboratories
7.5. Latin America GMO Testing Market Outlook, by Country, Value (US$ Billion), 2020–2033
7.5.1. Brazil GMO Testing Market Outlook, by Offering, 2020–2033
7.5.2. Brazil GMO Testing Market Outlook, by Technology, 2020–2033
7.5.3. Brazil GMO Testing Market Outlook, by Sample Type, 2020–2033
7.5.4. Brazil GMO Testing Market Outlook, by End User, 2020–2033
7.5.5. Argentina GMO Testing Market Outlook, by Offering, 2020–2033
7.5.6. Argentina GMO Testing Market Outlook, by Technology, 2020–2033
7.5.7. Argentina GMO Testing Market Outlook, by Sample Type, 2020–2033
7.5.8. Argentina GMO Testing Market Outlook, by End User, 2020–2033
7.5.9. Paraguay GMO Testing Market Outlook, by Offering, 2020–2033
7.5.10. Paraguay GMO Testing Market Outlook, by Technology, 2020–2033
7.5.11. Paraguay GMO Testing Market Outlook, by Sample Type, 2020–2033
7.5.12. Paraguay GMO Testing Market Outlook, by End User, 2020–2033
7.5.13. Uruguay GMO Testing Market Outlook, by Offering, 2020–2033
7.5.14. Uruguay GMO Testing Market Outlook, by Technology, 2020–2033
7.5.15. Uruguay GMO Testing Market Outlook, by Sample Type, 2020–2033
7.5.16. Uruguay GMO Testing Market Outlook, by End User, 2020–2033
8. Middle East & Africa GMO Testing Market Outlook, 2020–2033
8.1. Middle East & Africa GMO Testing Market Outlook, by Offering, Value (US$ Billion), 2020–2033
8.1.1. Testing Services
8.1.2. Kits and Reagents
8.1.3. Certified Reference Materials and Proficiency Testing
8.2. Middle East & Africa GMO Testing Market Outlook, by Technology, Value (US$ Billion), 2020–2033
8.2.1. Real-Time and Digital Polymerase Chain Reaction
8.2.2. End-Point Polymerase Chain Reaction and Multiplex Screening
8.2.3. Immunoassay and Lateral Flow Strip Tests
8.2.4. Next-Generation Sequencing
8.3. Middle East & Africa GMO Testing Market Outlook, by Sample Type, Value (US$ Billion), 2020–2033
8.3.1. Seed
8.3.2. Grain and Raw Commodities
8.3.3. Processed Food
8.3.4. Animal Feed
8.4. Middle East & Africa GMO Testing Market Outlook, by End User, Value (US$ Billion), 2020–2033
8.4.1. Contract and Commercial Testing Laboratories
8.4.2. In-House Food and Feed Manufacturer Laboratories
8.4.3. Seed Company Laboratories
8.4.4. Government and Border Control Laboratories
8.5. Middle East & Africa GMO Testing Market Outlook, by Country, Value (US$ Billion), 2020–2033
8.5.1. Saudi Arabia GMO Testing Market Outlook, by Offering, 2020–2033
8.5.2. Saudi Arabia GMO Testing Market Outlook, by Technology, 2020–2033
8.5.3. Saudi Arabia GMO Testing Market Outlook, by Sample Type, 2020–2033
8.5.4. Saudi Arabia GMO Testing Market Outlook, by End User, 2020–2033
8.5.5. United Arab Emirates GMO Testing Market Outlook, by Offering, 2020–2033
8.5.6. United Arab Emirates GMO Testing Market Outlook, by Technology, 2020–2033
8.5.7. United Arab Emirates GMO Testing Market Outlook, by Sample Type, 2020–2033
8.5.8. United Arab Emirates GMO Testing Market Outlook, by End User, 2020–2033
8.5.9. Egypt GMO Testing Market Outlook, by Offering, 2020–2033
8.5.10. Egypt GMO Testing Market Outlook, by Technology, 2020–2033
8.5.11. Egypt GMO Testing Market Outlook, by Sample Type, 2020–2033
8.5.12. Egypt GMO Testing Market Outlook, by End User, 2020–2033
8.5.13. Turkey GMO Testing Market Outlook, by Offering, 2020–2033
8.5.14. Turkey GMO Testing Market Outlook, by Technology, 2020–2033
8.5.15. Turkey GMO Testing Market Outlook, by Sample Type, 2020–2033
8.5.16. Turkey GMO Testing Market Outlook, by End User, 2020–2033
8.5.17. South Africa GMO Testing Market Outlook, by Offering, 2020–2033
8.5.18. South Africa GMO Testing Market Outlook, by Technology, 2020–2033
8.5.19. South Africa GMO Testing Market Outlook, by Sample Type, 2020–2033
8.5.20. South Africa GMO Testing Market Outlook, by End User, 2020–2033
9. Competitive Landscape
9.1. Market Concentration and Industry Leaders
9.2. Competitive Differentiation
9.3. Strategic Moves and Market Direction
9.4. Recent Industry Developments
9.5. Company Profiles
9.5.1. Eurofins Scientific SE
9.5.2. SGS SA
9.5.3. Bureau Veritas SA
9.5.4. Intertek Group plc
9.5.5. Mérieux NutriSciences Corporation
9.5.6. ALS Limited
9.5.7. FoodChain ID Group, Inc.
9.5.8. Neogen Corporation
9.5.9. Romer Labs Division Holding GmbH
9.5.10. EnviroLogix Inc.
9.5.11. Thermo Fisher Scientific Inc.
9.5.12. Bio-Rad Laboratories, Inc.
9.5.13. QIAGEN N.V.
9.5.14. LGC Limited
10. Appendix
10.1. Research Methodology
10.2. Report Assumptions
10.3. Acronyms and Abbreviations
| Offering | Testing Services, Kits and Reagents, Certified Reference Materials and Proficiency Testing |
| Technology | Real-Time and Digital Polymerase Chain Reaction, End-Point Polymerase Chain Reaction and Multiplex Screening, Immunoassay and Lateral Flow Strip Tests, Next-Generation Sequencing |
| Sample Type | Seed, Grain and Raw Commodities, Processed Food, Animal Feed |
| End User | Contract and Commercial Testing Laboratories, In-House Food and Feed Manufacturer Laboratories, Seed Company Laboratories, Government and Border Control Laboratories |
| Regions | North America, Europe, Asia Pacific, Latin America, Middle East & Africa |
Our Research Methodology
Considering the volatility of business today, traditional approaches to strategizing a game plan can be unfruitful if not detrimental. True ambiguity is no way to determine a forecast. A myriad of predetermined factors must be accounted for such as the degree of risk involved, the magnitude of circumstances, as well as conditions or consequences that are not known or unpredictable. To circumvent binary views that cast uncertainty, the application of market research intelligence to strategically posture, move, and enable actionable outcomes is necessary.
View Methodology
Quality Assured
Rigorous Validation Process

Confidentiality Assured
End-to-end Data Security

Custom Research Services
Tailored To Your Objectives
FAQs
The GMO testing market is valued at US$ 2.2 billion in 2026, covering laboratory services, kits, reagents, reference materials and proficiency schemes.
The market is projected to reach US$ 3.6 billion by 2033, growing at a 7.3% CAGR and adding US$ 1.4 billion over the period.
Testing services lead with 67.9% of 2026 revenue, because accreditation, validated methods and proficiency records are needed for results buyers accept.
Next-generation sequencing grows fastest at 12.4%, while Asia Pacific is the fastest-growing region at a 9.1% CAGR through 2033.
Concentration is medium, with several global testing networks holding most accredited service volume alongside many national and specialist laboratories.
Related Reports
Green Cardamom Market Size, Share, Insights, Competitive Landscape, and Forecast 2026 to 2033
Green cardamom market to grow from US$1.6 Bn in 2026 to US$2.3 Bn by 2033 at 5.3% CAGR. Explore forms, grades, applications and regional growth trends.
Glutinous Rice Flour Market Size, Share, Insights, Competitive Landscape, and Forecast 2026 to 2033
Glutinous rice flour market to grow from US$2.4 Bn in 2026 to US$3.5 Bn by 2033 at 5.5% CAGR. Explore products, milling, applications and regions.
Oat Milk Market Size, Share, Insights, Competitive Landscape, and Forecast 2026 to 2033
Oat milk market to reach US$ 13.72 billion by 2033 at a 16.8% CAGR. Explore product types, organic demand, distribution channels and regional trends.
Low Glycemic Index Rice Market Size, Share, Insights, Competitive Landscape, and Forecast 2026 to 2033
Low glycemic index rice market to reach US$ 18.01 billion by 2033 at a 7.5% CAGR. Explore rice types, applications, channels and regional trends.
Yeast Ingredient Market Size, Share, Insights, Competitive Landscape, and Forecast 2026 to 2033
Explore the yeast ingredient market, reaching US$ 16.5 billion by 2033 at 6.2% CAGR, with product, application and regional insights.
Vegan Yoghurt Market Size, Share, Insights, Competitive Landscape, and Forecast 2026 to 2033
Explore the vegan yoghurt market, reaching US$ 6.0 billion by 2033 at 6.3% CAGR, with base types, formats, distribution and regional insights.