



Group Health Insurance Market
Group Health Insurance Market Size, Share, Insights, Competitive Landscape, and Forecast 2026 to 2033
Group Health Insurance Market Size and Trend Analysis
What Is Driving Group Health Insurance Market Growth?
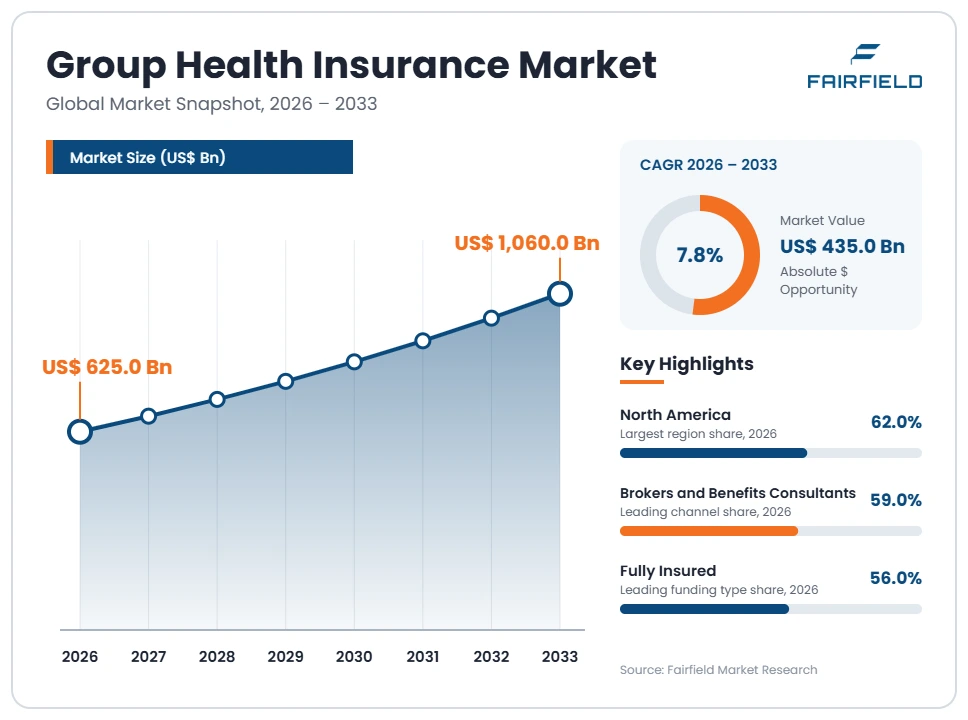
The global group health insurance market size is expected to be valued at US$ 625.0 billion in 2026 and projected to reach US$ 1060.0 billion by 2033, growing at a CAGR of 7.8% between 2026 and 2033.
All figures measure gross written premium plus administrative services only fees and stop-loss premium; the claims spend of self-funded employer plans sits outside this basis. Between 2020 and 2025 the market grew at a 7.1% CAGR, as utilisation normalised after the pandemic and hospital prices reset under renewed contracts. Growth is now carried by three factors. Medical cost trend remains the dominant force, with hospital price increases and specialty pharmacy spend feeding directly into renewal rates. Employer-sponsored health insurance remains central to recruitment in tight labour markets. Finally, mandatory employer cover is spreading in several Gulf and Asian jurisdictions. Premium growth, not enrolment growth, explains most of the forecast.
Key Report Takeaways
- By Plan Funding Type: Fully Insured arrangements held 56% share in 2026, while Level-Funded plans are projected to expand at an 11.2% CAGR through 2033, as mid-size employers seek claims-experience refunds without full self-insurance risk.
- By Plan Design: Preferred Provider Organization plans held 43% share in 2026, while High-Deductible Health Plans with Savings Accounts are projected to expand at a 9.6% CAGR through 2033, supported by tax-advantaged account contributions.
- By Enterprise Size: Large Enterprises held 57% share in 2026, while Mid-Size Employers are projected to expand at a 9.1% CAGR through 2033, because packaged funding products have moved downmarket into the 100-to-999 employee band.
- By Distribution Channel: Brokers and Benefits Consultants held 59% share in 2026, while Digital Benefits Platforms and Exchanges are projected to expand at a 12.1% CAGR through 2033, driven by integrated enrolment and payroll administration.
- By Geography: North America held 62% share in 2026, while Asia Pacific is projected to expand at a 10.4% CAGR through 2033, led by mandatory and voluntary employer medical schemes.
Global Group Health Insurance Market Trends and Insights
Drivers Impact Analysis
Two forces account for most premium growth in employer medical cover through 2033.
| Driver | Impact on CAGR Forecast | Geographic Relevance | Impact Timeline |
| Medical cost trend from hospital prices and specialty pharmacy | High | Global, strongest in North America | Short term (≤2 years) |
| Statutory employer coverage obligations and benefit mandates | Medium | North America, Middle East & Africa, Asia Pacific | Long term (≥4 years) |
Medical Cost Trend and Specialty Drug Spend Lift Group Health Insurance Premiums
Medical cost trend is the central mechanism behind premium growth in this market. Renewal rates are built from projected claims, so every increase in unit prices or utilisation flows into premium within one or two cycles. Hospital and facility prices contribute the largest share of that trend, followed by pharmacy. Because premium is the measured revenue base, cost inflation translates almost directly into reported market expansion, even when the number of covered lives is flat.
The mechanism has a clear recent cause. Specialty pharmacy, and particularly GLP-1 medicines prescribed for diabetes and obesity, has become one of the fastest-rising components of plan spend, alongside high-cost cell and gene therapies. Hospital systems have also negotiated higher commercial rates after a period of labour and supply cost pressure. Insurers price these inputs into renewals, and employers absorb or redistribute the increase.
Statutory Coverage Obligations Keep Employer Medical Plans Broadly Entrenched
Regulation sustains the enrolment base that underpins this market. In the United States, the employer shared responsibility provisions of the Affordable Care Act require applicable large employers to offer minimum essential coverage that meets affordability and minimum value tests, or face an assessment. That obligation keeps participation high among larger firms and makes employer-sponsored health insurance a structural feature rather than a discretionary benefit.
The same pattern is emerging elsewhere through different instruments. Several Gulf jurisdictions require employers to provide medical cover for expatriate and domestic staff as a condition of residency or employment processing, which converts a voluntary benefit into a licensing requirement. In parts of Asia Pacific, statutory schemes cover a defined baseline while employers purchase supplementary group plans for access to private hospitals, creating a stable, regulated layer of demand.
Restraints Impact Analysis
Two constraints limit how much of medical cost trend converts into insured premium.
| Restraint | Impact on CAGR Forecast | Geographic Relevance | Impact Timeline |
| Employee affordability limits on cost sharing and contributions | High | North America, Europe | Short term (≤2 years) |
| Employer migration from fully insured to self-funded arrangements | High | North America | Medium term (2–4 years) |
Affordability Limits on Employee Contributions Cap Insured Premium Growth
Affordability rules and workforce tolerance together place a ceiling on premium increases. Under the Affordable Care Act, an employer’s offer of coverage must keep the employee’s required contribution for self-only cover below a defined percentage of household income, or the plan fails the affordability test. Employers therefore cannot pass through the full medical cost trend, and they respond by changing plan design, narrowing networks or restricting coverage of specific high-cost drug categories.
The underlying cost source is the gap between claims inflation and wage growth. When claims rise faster than payroll, the employer contribution absorbs the difference, which compresses benefit budgets against other compensation spend. Employers manage this through higher deductibles, tiered networks, site-of-care steering and prior authorisation for specialty medicines. Each of those actions dampens the premium that insurers can ultimately charge.
Migration to Self-Funded Arrangements Shifts Revenue Out of Insured Premium
Self-funding removes claims risk, and the associated premium, from insurer books. When an employer moves to a self-insured arrangement governed by the Employee Retirement Income Security Act, the carrier’s revenue falls from full premium to an administrative services only fee plus stop-loss cover. On this report’s premium-based measurement, that transition reduces recorded market value even though the underlying benefit spend is unchanged or higher.
The causes are financial and regulatory. Self-funded plans avoid state premium taxes and most state benefit mandates, retain favourable claims experience instead of surrendering it to the insurer, and gain direct access to detailed claims data for cost management. Stop-loss contracts cap catastrophic exposure at a defined attachment point, which has made the model viable far below the employer headcount at which it was once considered practical.
Market Opportunities
Level-Funded Products Open the Small and Mid-Size Employer Revenue Pool
Level-funded plans are the clearest untapped pool in this market, projected to grow at an 11.2% CAGR through 2033. They combine a fixed monthly payment, a claims account, integrated stop-loss cover and a potential surplus refund, which gives smaller employers the economics of self-funding without the cash-flow volatility. For insurers, the product converts fully insured accounts that were drifting toward self-funding into a retained, fee-and-premium hybrid relationship.
Carriers with strong stop-loss underwriting and scalable administration are best placed to capture it. Demand comes from employers in the 50-to-500 employee range, which historically lacked credible claims data and therefore could not price a self-insured programme. Broader availability of claims analytics, aided by the price transparency data employers can now obtain, has made experience-rating practical for these groups for the first time.
High-Cost Claim Management and Stop-Loss Cover Expand as a Distinct Revenue Pool
Stop-loss insurance and specialised high-cost claim management form a fast-expanding revenue pool alongside traditional group medical. As more employers self-fund, the insured risk migrates from first-dollar coverage to catastrophic protection, and the severity of individual claims has risen sharply with cell and gene therapies, complex oncology and extended neonatal care. Carriers that underwrite this tail capture premium that grows faster than the underlying medical trend.
Reinsurers, specialist managing general underwriters and the large carriers’ dedicated stop-loss units are all positioned to take it. Demand is created by self-funded employers of every size and by level-funded programmes that embed stop-loss cover by design. Price transparency requirements under the Consolidated Appropriations Act, 2021 give underwriters better visibility into negotiated facility rates, which improves pricing accuracy and reduces the margin loading applied to uncertain exposures.
Segment Analysis
- By Plan Funding Type: Fully Insured Holds the Base While Level-Funded Plans Scale
Fully Insured arrangements accounted for 56% of measured premium in 2026, reflecting their dominance among smaller employers and in markets outside the United States where self-funding is uncommon or legally impractical. The model remains standard wherever an employer wants predictable monthly cost, no claims volatility and no fiduciary responsibility for plan administration.
Level-Funded plans form the fastest-growing segment at an 11.2% CAGR through 2033. They appeal to employers who want claims-experience upside but cannot tolerate open-ended liability. Self-funded arrangements, measured here as administrative services only fees plus stop-loss premium, hold the remaining share and dominate large-employer coverage. The business implication is a steady erosion of first-dollar premium in mature markets, offset by growth in fee and stop-loss revenue, which carries different margin characteristics and far lower capital requirements.
- By Plan Design: Preferred Provider Plans Lead as High-Deductible Designs Advance
Preferred Provider Organization plans held 43% share in 2026, the most common design in employer-sponsored health insurance. Employees value broad provider choice and out-of-network access, and employers value the familiarity that reduces disruption at renewal. Large multi-site employers in particular need a national network, which favours this design over tighter alternatives.
High-Deductible Health Plans paired with savings accounts are the fastest-growing design at a 9.6% CAGR through 2033. Growth comes from the tax treatment of account contributions and from employers using the design to moderate premium while preserving catastrophic protection. Health Maintenance Organization plans retain a substantial share in regions with strong integrated delivery systems, while Exclusive Provider and Point-of-Service designs occupy narrower niches. The implication is continued pressure on insurers to support multiple funding and network configurations within a single employer account.
- By Enterprise Size: Large Employers Dominate While Mid-Size Groups Grow Fastest
Large Enterprises generated 57% of premium and fee revenue in 2026. Firms with more than one thousand employees cover large populations, offer multiple plan options, and usually carry dental, vision and ancillary lines alongside medical. Their scale supports dedicated account teams and bespoke network arrangements, which is why carriers compete hardest for this tier.
Mid-Size Employers are the fastest-growing group at a 9.1% CAGR through 2033. The shift reflects product availability rather than employment growth: level-funded and packaged stop-loss products designed for the 100-to-999 employee band have made sophisticated funding accessible to firms that previously had only fully insured options. Small Employers remain the hardest tier to serve profitably because of high acquisition costs and volatile claims experience. For carriers, the mid-market is where competitive displacement is currently most active.
- By Distribution Channel: Broker Relationships Lead While Digital Platforms Accelerate
Brokers and Benefits Consultants controlled 59% of distribution in 2026. Employers rely on intermediaries to run renewal marketing, compare funding structures and manage compliance obligations, and that advisory role is reinforced by the broker and consultant compensation disclosure requirements of the Consolidated Appropriations Act, 2021, which have made fee arrangements explicit without displacing the channel.
Digital Benefits Platforms and Exchanges are the fastest-growing channel at a 12.1% CAGR through 2033. Benefits administration software that integrates enrolment, payroll deduction and eligibility feeds has become the practical point of sale for smaller employers. Direct Sales remain significant for very large accounts, while Bancassurance and affinity arrangements matter mainly outside the United States. The implication is that carriers increasingly compete on how cleanly their products integrate with third-party administration technology.
Geography Analysis
- Which Region Is Leading the Group Health Insurance Market?
North America leads the group health insurance market with 62% share in 2026, a concentration unmatched in any other insurance line. The United States accounts for almost all of it, because employer-sponsored cover is the primary route to private medical insurance for working-age residents, and per-capita health spending is the highest in the world. The Affordable Care Act employer shared responsibility provisions sustain participation among larger firms, while the Employee Retirement Income Security Act governs self-funded plans and gives multi-state employers a single federal framework. Canada contributes a smaller supplementary market focused on drugs, dental and paramedical services outside provincial plans. Regional growth of 7.3% annually is driven almost entirely by medical cost trend. The defining change is price transparency data entering renewal negotiations for the first time.
- Europe Supplements Statutory Systems with Employer-Purchased Medical Cover
Europe holds 16% share in 2026 and operates on a fundamentally different basis. Statutory or social insurance systems provide baseline cover in Germany, France, Spain and Italy, so employer group plans function as supplementary products that buy faster access, private rooms and wider provider choice. The United Kingdom has the largest corporate medical market, where long public waiting lists have pushed employers to add private cover as a retention measure. The Netherlands and Switzerland follow mandatory private models with employer top-ups. Growth of 7.0% annually is steady rather than rapid, constrained by the breadth of public provision and by tax treatment that varies sharply by country. The clearest regional change is employer demand for mental health and musculoskeletal pathways, which now drive much of the claims experience.
- Which Region Is Growing Fastest in the Group Health Insurance Market?
Asia Pacific is growing fastest in the group health insurance market, at a 10.4% CAGR between 2026 and 2033, from 16% share in 2026. China, India, Japan, Australia and Singapore generate most of the volume. The growth mechanism is enrolment expansion rather than price inflation alone: formal employment is rising, multinational employers are standardising benefits across subsidiaries, and domestic firms are adding medical cover to compete for skilled staff. India’s corporate group medical market has expanded particularly quickly, helped by regulatory encouragement of wider health coverage and by employer demand for family floater benefits. Private hospital capacity is expanding alongside it. Barriers include limited provider network depth outside major cities and thin claims data for underwriting. The notable shift is rapid adoption of cashless digital claims settlement.
- Latin America Uses Employer Medical Plans to Secure Private Hospital Access
Latin America accounts for 4% of global premium in 2026 and is growing at an 8.2% CAGR. Brazil dominates the region, where corporate health plans cover a large share of the formally employed population and function as a core compensation component rather than a fringe benefit. Mexico, Chile, Colombia and Argentina follow, with employer cover typically layered over public systems to secure private hospital access and shorter waiting times. The main barriers are medical inflation that regularly outpaces general price growth, currency volatility affecting imported medical supplies and devices, and a large informal workforce that sits outside employer schemes altogether. The notable regional development is the growth of regulated coordinated-care and primary-care-gatekeeper products, which employers are adopting to contain rapidly escalating claims costs.
- Middle East & Africa Expands Mandatory Employer Medical Cover Across the Gulf
Middle East & Africa holds 2% share in 2026 but is expanding at an 8.6% CAGR, the second-fastest rate in this study. Growth is concentrated in the Gulf, where several jurisdictions require employers to provide medical cover for employees as a condition of visa issuance or employment registration, converting the benefit into a compliance obligation. The United Arab Emirates and Saudi Arabia account for most regional premium, supported by large expatriate workforces and rapid private hospital construction. South Africa has a distinct medical scheme structure with substantial employer participation. Barriers include thin insurance penetration across much of the continent, limited provider networks outside capital cities, and claims leakage that raises loss ratios. The key change is the extension of mandatory cover to smaller employers and domestic workers.
Competitive Landscape
The group health insurance market is highly concentrated in its largest territory and fragmented elsewhere. In the United States a small number of national carriers underwrite or administer most covered lives, supported by scale advantages in provider contracting that smaller insurers cannot replicate. Outside that market the picture changes: European and Asia Pacific group medical business is spread across domestic insurers, multinational composites and local health specialists, with no single firm holding a commanding global position. Consolidation has been most visible in the integration of insurers with pharmacy benefit management, care delivery and analytics capability, which has widened the gap between vertically integrated carriers and pure underwriters.
Competition turns on the cost of care rather than the price of the policy. The decisive factors are the depth of negotiated provider discounts, the effectiveness of pharmacy and specialty drug management, network adequacy across an employer’s locations, administrative accuracy, and the quality of reporting supplied to benefits teams. Stop-loss underwriting skill has become a differentiator as self-funding spreads. New competition comes from health technology firms offering navigation, virtual primary care and direct-contracting arrangements that sit alongside the carrier rather than replacing it, and from benefits administration platforms that increasingly control the employer relationship.
Strategic activity across the sector has concentrated on building integrated care and pharmacy capability, expanding level-funded and stop-loss product lines for the mid-market, and investing in claims automation and price transparency analytics to meet disclosure obligations.
Strategic direction is converging on cost containment as the core promise to employers. Carriers are extending into care delivery and medication management, restructuring networks around high-value providers, and positioning data capability as the basis on which renewals are won.
Recent Industry Developments
- January 2022: The No Surprises Act took effect in the United States, limiting balance billing for emergency and certain out-of-network services and establishing a federal independent dispute resolution process – shifting a category of cost away from covered members and into payer-provider arbitration.
- December 2023: The first annual gag clause prohibition compliance attestation became due under the Consolidated Appropriations Act, 2021, requiring plans and issuers to confirm that contracts do not restrict access to cost and quality data – giving employers contractual rights to claims and price information.
- January 2024: The internet-based price comparison tool required by the Transparency in Coverage rule expanded to all covered items and services – extending machine-readable rate disclosure into member-facing cost estimation.
- September 2024: The United States Department of Labor, Department of Health and Human Services and Department of the Treasury issued final rules under the Mental Health Parity and Addiction Equity Act, tightening comparative analysis requirements for non-quantitative treatment limitations – raising compliance obligations for behavioural health network design.
Companies Covered in the Report
- UnitedHealth Group
- Elevance Health
- The Cigna Group
- CVS Health
- Kaiser Permanente
- Humana Inc.
- Centene Corporation
- Allianz SE
- AXA SA
- Bupa
- Ping An Insurance
- Discovery Limited
Group Health Insurance Market Report Scope
| Metric | Value |
| Study Period | 2020–2033 |
| Market Size 2026 | US$ 625.0 Billion |
| Market Size 2033 | US$ 1060.0 Billion |
| CAGR 2026–2033 | 7.8% |
| Absolute Dollar Opportunity | US$ 435.0 Billion |
| Largest Market | North America (62% share in 2026) |
| Fastest-Growing Market | Asia Pacific (10.4% CAGR) |
| Market Concentration | High |
| Major Players | UnitedHealth Group, Elevance Health, The Cigna Group, CVS Health, Kaiser Permanente |
Group Health Insurance Market Segmentation
Plan Funding Type
- Fully Insured
- Self-Funded
- Level-Funded
Plan Design
- Preferred Provider Organization
- Health Maintenance Organization
- High-Deductible Health Plan with Savings Account
- Exclusive Provider and Point-of-Service Plans
Enterprise Size
- Large Enterprises
- Mid-Size Employers
- Small Employers
Distribution Channel
- Brokers and Benefits Consultants
- Direct Sales
- Digital Benefits Platforms and Exchanges
- Bancassurance and Affinity
Regions
- North America
- Europe
- Asia Pacific
- Latin America
- Middle East & Africa
- Executive Summary
- Global Group Health Insurance Market Snapshot
- Future Projections
- Key Report Takeaways
- Regional Snapshot
- Market Overview
- Market Definition and Report Scope
- Historical Trends 2020–2025
- Market Dynamics
- Drivers
- Medical Cost Trend and Specialty Drug Spend Lift Group Health Insurance Premiums
- Statutory Coverage Obligations Keep Employer Medical Plans Broadly Entrenched
- Restraints
- Affordability Limits on Employee Contributions Cap Insured Premium Growth
- Migration to Self-Funded Arrangements Shifts Revenue Out of Insured Premium
- Market Opportunities
- Level-Funded Products Open the Small and Mid-Size Employer Revenue Pool
- High-Cost Claim Management and Stop-Loss Cover Expand as a Distinct Revenue Pool
- Drivers
- Global Group Health Insurance Market Outlook, 2020–2033
- Global Group Health Insurance Market Outlook, by Plan Funding Type, Value (US$ Billion), 2020–2033
- Fully Insured
- Self-Funded
- Level-Funded
- Global Group Health Insurance Market Outlook, by Plan Design, Value (US$ Billion), 2020–2033
- Preferred Provider Organization
- Health Maintenance Organization
- High-Deductible Health Plan with Savings Account
- Exclusive Provider and Point-of-Service Plans
- Global Group Health Insurance Market Outlook, by Enterprise Size, Value (US$ Billion), 2020–2033
- Large Enterprises
- Mid-Size Employers
- Small Employers
- Global Group Health Insurance Market Outlook, by Distribution Channel, Value (US$ Billion), 2020–2033
- Brokers and Benefits Consultants
- Direct Sales
- Digital Benefits Platforms and Exchanges
- Bancassurance and Affinity
- Global Group Health Insurance Market Outlook, by Region, Value (US$ Billion), 2020–2033
- North America
- Europe
- Asia Pacific
- Latin America
- Middle East & Africa
- Global Group Health Insurance Market Outlook, by Plan Funding Type, Value (US$ Billion), 2020–2033
- North America Group Health Insurance Market Outlook, 2020–2033
- North America Group Health Insurance Market Outlook, by Plan Funding Type, Value (US$ Billion), 2020–2033
- Fully Insured
- Self-Funded
- Level-Funded
- North America Group Health Insurance Market Outlook, by Plan Design, Value (US$ Billion), 2020–2033
- Preferred Provider Organization
- Health Maintenance Organization
- High-Deductible Health Plan with Savings Account
- Exclusive Provider and Point-of-Service Plans
- North America Group Health Insurance Market Outlook, by Enterprise Size, Value (US$ Billion), 2020–2033
- Large Enterprises
- Mid-Size Employers
- Small Employers
- North America Group Health Insurance Market Outlook, by Distribution Channel, Value (US$ Billion), 2020–2033
- Brokers and Benefits Consultants
- Direct Sales
- Digital Benefits Platforms and Exchanges
- Bancassurance and Affinity
- North America Group Health Insurance Market Outlook, by Country, Value (US$ Billion), 2020–2033
- United States Group Health Insurance Market Outlook, by Plan Funding Type, 2020–2033
- United States Group Health Insurance Market Outlook, by Plan Design, 2020–2033
- United States Group Health Insurance Market Outlook, by Enterprise Size, 2020–2033
- United States Group Health Insurance Market Outlook, by Distribution Channel, 2020–2033
- Canada Group Health Insurance Market Outlook, by Plan Funding Type, 2020–2033
- Canada Group Health Insurance Market Outlook, by Plan Design, 2020–2033
- Canada Group Health Insurance Market Outlook, by Enterprise Size, 2020–2033
- Canada Group Health Insurance Market Outlook, by Distribution Channel, 2020–2033
- North America Group Health Insurance Market Outlook, by Plan Funding Type, Value (US$ Billion), 2020–2033
- Europe Group Health Insurance Market Outlook, 2020–2033
- Europe Group Health Insurance Market Outlook, by Plan Funding Type, Value (US$ Billion), 2020–2033
- Fully Insured
- Self-Funded
- Level-Funded
- Europe Group Health Insurance Market Outlook, by Plan Design, Value (US$ Billion), 2020–2033
- Preferred Provider Organization
- Health Maintenance Organization
- High-Deductible Health Plan with Savings Account
- Exclusive Provider and Point-of-Service Plans
- Europe Group Health Insurance Market Outlook, by Enterprise Size, Value (US$ Billion), 2020–2033
- Large Enterprises
- Mid-Size Employers
- Small Employers
- Europe Group Health Insurance Market Outlook, by Distribution Channel, Value (US$ Billion), 2020–2033
- Brokers and Benefits Consultants
- Direct Sales
- Digital Benefits Platforms and Exchanges
- Bancassurance and Affinity
- Europe Group Health Insurance Market Outlook, by Country, Value (US$ Billion), 2020–2033
- Germany Group Health Insurance Market Outlook, by Plan Funding Type, 2020–2033
- Germany Group Health Insurance Market Outlook, by Plan Design, 2020–2033
- Germany Group Health Insurance Market Outlook, by Enterprise Size, 2020–2033
- Germany Group Health Insurance Market Outlook, by Distribution Channel, 2020–2033
- France Group Health Insurance Market Outlook, by Plan Funding Type, 2020–2033
- France Group Health Insurance Market Outlook, by Plan Design, 2020–2033
- France Group Health Insurance Market Outlook, by Enterprise Size, 2020–2033
- France Group Health Insurance Market Outlook, by Distribution Channel, 2020–2033
- Spain Group Health Insurance Market Outlook, by Plan Funding Type, 2020–2033
- Spain Group Health Insurance Market Outlook, by Plan Design, 2020–2033
- Spain Group Health Insurance Market Outlook, by Enterprise Size, 2020–2033
- Spain Group Health Insurance Market Outlook, by Distribution Channel, 2020–2033
- Italy Group Health Insurance Market Outlook, by Plan Funding Type, 2020–2033
- Italy Group Health Insurance Market Outlook, by Plan Design, 2020–2033
- Italy Group Health Insurance Market Outlook, by Enterprise Size, 2020–2033
- Italy Group Health Insurance Market Outlook, by Distribution Channel, 2020–2033
- United Kingdom Group Health Insurance Market Outlook, by Plan Funding Type, 2020–2033
- United Kingdom Group Health Insurance Market Outlook, by Plan Design, 2020–2033
- United Kingdom Group Health Insurance Market Outlook, by Enterprise Size, 2020–2033
- United Kingdom Group Health Insurance Market Outlook, by Distribution Channel, 2020–2033
- Netherlands Group Health Insurance Market Outlook, by Plan Funding Type, 2020–2033
- Netherlands Group Health Insurance Market Outlook, by Plan Design, 2020–2033
- Netherlands Group Health Insurance Market Outlook, by Enterprise Size, 2020–2033
- Netherlands Group Health Insurance Market Outlook, by Distribution Channel, 2020–2033
- Switzerland Group Health Insurance Market Outlook, by Plan Funding Type, 2020–2033
- Switzerland Group Health Insurance Market Outlook, by Plan Design, 2020–2033
- Switzerland Group Health Insurance Market Outlook, by Enterprise Size, 2020–2033
- Switzerland Group Health Insurance Market Outlook, by Distribution Channel, 2020–2033
- Europe Group Health Insurance Market Outlook, by Plan Funding Type, Value (US$ Billion), 2020–2033
- Asia Pacific Group Health Insurance Market Outlook, 2020–2033
- Asia Pacific Group Health Insurance Market Outlook, by Plan Funding Type, Value (US$ Billion), 2020–2033
- Fully Insured
- Self-Funded
- Level-Funded
- Asia Pacific Group Health Insurance Market Outlook, by Plan Design, Value (US$ Billion), 2020–2033
- Preferred Provider Organization
- Health Maintenance Organization
- High-Deductible Health Plan with Savings Account
- Exclusive Provider and Point-of-Service Plans
- Asia Pacific Group Health Insurance Market Outlook, by Enterprise Size, Value (US$ Billion), 2020–2033
- Large Enterprises
- Mid-Size Employers
- Small Employers
- Asia Pacific Group Health Insurance Market Outlook, by Distribution Channel, Value (US$ Billion), 2020–2033
- Brokers and Benefits Consultants
- Direct Sales
- Digital Benefits Platforms and Exchanges
- Bancassurance and Affinity
- Asia Pacific Group Health Insurance Market Outlook, by Country, Value (US$ Billion), 2020–2033
- China Group Health Insurance Market Outlook, by Plan Funding Type, 2020–2033
- China Group Health Insurance Market Outlook, by Plan Design, 2020–2033
- China Group Health Insurance Market Outlook, by Enterprise Size, 2020–2033
- China Group Health Insurance Market Outlook, by Distribution Channel, 2020–2033
- India Group Health Insurance Market Outlook, by Plan Funding Type, 2020–2033
- India Group Health Insurance Market Outlook, by Plan Design, 2020–2033
- India Group Health Insurance Market Outlook, by Enterprise Size, 2020–2033
- India Group Health Insurance Market Outlook, by Distribution Channel, 2020–2033
- Japan Group Health Insurance Market Outlook, by Plan Funding Type, 2020–2033
- Japan Group Health Insurance Market Outlook, by Plan Design, 2020–2033
- Japan Group Health Insurance Market Outlook, by Enterprise Size, 2020–2033
- Japan Group Health Insurance Market Outlook, by Distribution Channel, 2020–2033
- Australia Group Health Insurance Market Outlook, by Plan Funding Type, 2020–2033
- Australia Group Health Insurance Market Outlook, by Plan Design, 2020–2033
- Australia Group Health Insurance Market Outlook, by Enterprise Size, 2020–2033
- Australia Group Health Insurance Market Outlook, by Distribution Channel, 2020–2033
- Singapore Group Health Insurance Market Outlook, by Plan Funding Type, 2020–2033
- Singapore Group Health Insurance Market Outlook, by Plan Design, 2020–2033
- Singapore Group Health Insurance Market Outlook, by Enterprise Size, 2020–2033
- Singapore Group Health Insurance Market Outlook, by Distribution Channel, 2020–2033
- Asia Pacific Group Health Insurance Market Outlook, by Plan Funding Type, Value (US$ Billion), 2020–2033
- Latin America Group Health Insurance Market Outlook, 2020–2033
- Latin America Group Health Insurance Market Outlook, by Plan Funding Type, Value (US$ Billion), 2020–2033
- Fully Insured
- Self-Funded
- Level-Funded
- Latin America Group Health Insurance Market Outlook, by Plan Design, Value (US$ Billion), 2020–2033
- Preferred Provider Organization
- Health Maintenance Organization
- High-Deductible Health Plan with Savings Account
- Exclusive Provider and Point-of-Service Plans
- Latin America Group Health Insurance Market Outlook, by Enterprise Size, Value (US$ Billion), 2020–2033
- Large Enterprises
- Mid-Size Employers
- Small Employers
- Latin America Group Health Insurance Market Outlook, by Distribution Channel, Value (US$ Billion), 2020–2033
- Brokers and Benefits Consultants
- Direct Sales
- Digital Benefits Platforms and Exchanges
- Bancassurance and Affinity
- Latin America Group Health Insurance Market Outlook, by Country, Value (US$ Billion), 2020–2033
- Brazil Group Health Insurance Market Outlook, by Plan Funding Type, 2020–2033
- Brazil Group Health Insurance Market Outlook, by Plan Design, 2020–2033
- Brazil Group Health Insurance Market Outlook, by Enterprise Size, 2020–2033
- Brazil Group Health Insurance Market Outlook, by Distribution Channel, 2020–2033
- Mexico Group Health Insurance Market Outlook, by Plan Funding Type, 2020–2033
- Mexico Group Health Insurance Market Outlook, by Plan Design, 2020–2033
- Mexico Group Health Insurance Market Outlook, by Enterprise Size, 2020–2033
- Mexico Group Health Insurance Market Outlook, by Distribution Channel, 2020–2033
- Chile Group Health Insurance Market Outlook, by Plan Funding Type, 2020–2033
- Chile Group Health Insurance Market Outlook, by Plan Design, 2020–2033
- Chile Group Health Insurance Market Outlook, by Enterprise Size, 2020–2033
- Chile Group Health Insurance Market Outlook, by Distribution Channel, 2020–2033
- Colombia Group Health Insurance Market Outlook, by Plan Funding Type, 2020–2033
- Colombia Group Health Insurance Market Outlook, by Plan Design, 2020–2033
- Colombia Group Health Insurance Market Outlook, by Enterprise Size, 2020–2033
- Colombia Group Health Insurance Market Outlook, by Distribution Channel, 2020–2033
- Argentina Group Health Insurance Market Outlook, by Plan Funding Type, 2020–2033
- Argentina Group Health Insurance Market Outlook, by Plan Design, 2020–2033
- Argentina Group Health Insurance Market Outlook, by Enterprise Size, 2020–2033
- Argentina Group Health Insurance Market Outlook, by Distribution Channel, 2020–2033
- Latin America Group Health Insurance Market Outlook, by Plan Funding Type, Value (US$ Billion), 2020–2033
- Middle East & Africa Group Health Insurance Market Outlook, 2020–2033
- Middle East & Africa Group Health Insurance Market Outlook, by Plan Funding Type, Value (US$ Billion), 2020–2033
- Fully Insured
- Self-Funded
- Level-Funded
- Middle East & Africa Group Health Insurance Market Outlook, by Plan Design, Value (US$ Billion), 2020–2033
- Preferred Provider Organization
- Health Maintenance Organization
- High-Deductible Health Plan with Savings Account
- Exclusive Provider and Point-of-Service Plans
- Middle East & Africa Group Health Insurance Market Outlook, by Enterprise Size, Value (US$ Billion), 2020–2033
- Large Enterprises
- Mid-Size Employers
- Small Employers
- Middle East & Africa Group Health Insurance Market Outlook, by Distribution Channel, Value (US$ Billion), 2020–2033
- Brokers and Benefits Consultants
- Direct Sales
- Digital Benefits Platforms and Exchanges
- Bancassurance and Affinity
- Middle East & Africa Group Health Insurance Market Outlook, by Country, Value (US$ Billion), 2020–2033
- United Arab Emirates Group Health Insurance Market Outlook, by Plan Funding Type, 2020–2033
- United Arab Emirates Group Health Insurance Market Outlook, by Plan Design, 2020–2033
- United Arab Emirates Group Health Insurance Market Outlook, by Enterprise Size, 2020–2033
- United Arab Emirates Group Health Insurance Market Outlook, by Distribution Channel, 2020–2033
- Saudi Arabia Group Health Insurance Market Outlook, by Plan Funding Type, 2020–2033
- Saudi Arabia Group Health Insurance Market Outlook, by Plan Design, 2020–2033
- Saudi Arabia Group Health Insurance Market Outlook, by Enterprise Size, 2020–2033
- Saudi Arabia Group Health Insurance Market Outlook, by Distribution Channel, 2020–2033
- South Africa Group Health Insurance Market Outlook, by Plan Funding Type, 2020–2033
- South Africa Group Health Insurance Market Outlook, by Plan Design, 2020–2033
- South Africa Group Health Insurance Market Outlook, by Enterprise Size, 2020–2033
- South Africa Group Health Insurance Market Outlook, by Distribution Channel, 2020–2033
- Middle East & Africa Group Health Insurance Market Outlook, by Plan Funding Type, Value (US$ Billion), 2020–2033
- Competitive Landscape
- Market Concentration and Industry Leaders
- Competitive Differentiation
- Strategic Moves and Market Direction
- Recent Industry Developments
- Company Profiles
- UnitedHealth Group
- Elevance Health
- The Cigna Group
- CVS Health
- Kaiser Permanente
- Humana Inc.
- Centene Corporation
- Allianz SE
- AXA SA
- Bupa
- Ping An Insurance
- Discovery Limited
- Appendix
- Research Methodology
- Report Assumptions
- Acronyms and Abbreviations
Plan Funding Type
- Fully Insured
- Self-Funded
- Level-Funded
Plan Design
- Preferred Provider Organization
- Health Maintenance Organization
- High-Deductible Health Plan with Savings Account
- Exclusive Provider and Point-of-Service Plans
Enterprise Size
- Large Enterprises
- Mid-Size Employers
- Small Employers
Distribution Channel
- Brokers and Benefits Consultants
- Direct Sales
- Digital Benefits Platforms and Exchanges
- Bancassurance and Affinity
Regions
- North America
- Europe
- Asia Pacific
- Latin America
- Middle East & Africa
Our Research Methodology
Considering the volatility of business today, traditional approaches to strategizing a game plan can be unfruitful if not detrimental. True ambiguity is no way to determine a forecast. A myriad of predetermined factors must be accounted for such as the degree of risk involved, the magnitude of circumstances, as well as conditions or consequences that are not known or unpredictable. To circumvent binary views that cast uncertainty, the application of market research intelligence to strategically posture, move, and enable actionable outcomes is necessary.
View Methodology
Quality Assured
Rigorous Validation Process

Confidentiality Assured
End-to-end Data Security

Custom Research Services
Tailored To Your Objectives
FAQs
The global group health insurance market is valued at US$ 625.0 billion in 2026, measured as gross written premium plus administrative fees and stop-loss cover.
The market is projected to reach US$ 1060.0 billion by 2033, growing at a 7.8% CAGR and adding an absolute dollar opportunity of US$ 435.0 billion.
Fully Insured arrangements lead with 56% share in 2026, because smaller employers and most markets outside the United States prefer predictable monthly costs.
Digital Benefits Platforms and Exchanges expand fastest at a 12.1% CAGR, while Asia Pacific is the quickest-growing region at a 10.4% CAGR.
Concentration is high in North America, where a few national carriers administer most covered lives, and considerably more fragmented across every other region.
Related Reports
Group Life Insurance Market Size, Share, Insights, Competitive Landscape, and Forecast 2026 to 2033
The global group life insurance market is valued at US$120.0 billion in 2026, reaching US$165.0 billion by 2033, growing at a 4.7% CAGR
5G in Healthcare Market Size, Share, Insights, Competitive Landscape, and Forecast 2026 to 2033
The global 5G in healthcare market is valued at US$3.6 billion in 2026, reaching US$19.5 billion by 2033, growing at a 27.3% CAGR
Wearable Skin Adhesives Market Size, Share, Insights, Competitive Landscape, and Forecast 2026 to 2033
The global wearable skin adhesives market is valued at US$1.2 billion in 2026, reaching US$2.1 billion by 2033, growing at an 8.3% CAGR
Healthcare Reimbursement Market Size, Share, Insights, Competitive Landscape, and Forecast 2026 to 2033
The global healthcare reimbursement market is valued at US$65.0 billion in 2026, reaching US$135.0 billion by 2033, growing at an 11.0% CAGR
3D Bioprinted Human Tissue Market Size, Share, Insights, Competitive Landscape, and Forecast 2026 to 2033
The global 3D bioprinted human tissue market is valued at US$2.92 billion in 2026, reaching US$10.37 billion by 2033, growing at a 19.8% CAGR
Diagnostic Imaging Services Market Size, Share, Insights, Competitive Landscape, and Forecast 2026 to 2033
The diagnostic imaging services market is valued at US$600.05 billion in 2026 and is projected to reach US$908.23 billion by 2033, growing at a 6.1% CAGR.