Natural Vanillin Market Growth and Industry Forecast
The Natural Vanillin Market is valued at USD 640.1 Mn in 2026 and is projected to reach USD 1065.9 Mn, growing at a CAGR of 8% by 2033
Natural Vanillin Market Summary: Key Insights & Trends
- Food & Beverages dominate the natural vanillin market with nearly 70% share in 2025, driven by widespread use in bakery, confectionery, and dairy formulations.
- Cosmetics & Personal Care is the fastest-growing application segment, projected to capture around 18% share by 2033 as demand for vegan and sustainable fragrances rises.
- Ferulic Acid Synthesis leads the market by source with over 55% share in 2025, supported by its high yield and sustainable extraction efficiency.
- Vanilla Bean Extract is the fastest-growing source segment, gaining traction for its authenticity and ethical sourcing appeal in premium applications.
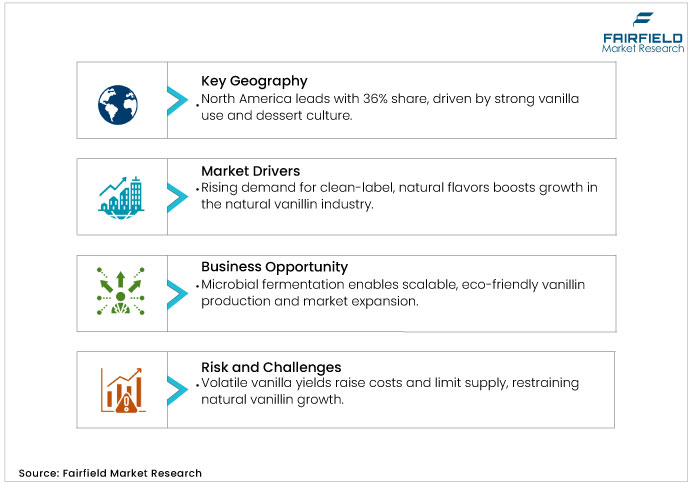
- Clean-label and natural ingredient preference remains the key growth driver, as global brands reformulate with natural vanillin to meet transparency and wellness demands.
- Biotechnological innovations in fermentation and enzymatic synthesis create new opportunities, ensuring sustainable, scalable production of natural vanillin.
- North America holds over 30% market share in 2025, supported by strong vanilla culture, clean-label trends, and premium food demand.
- Asia Pacific emerges as the fastest-growing region, fuelled by expanding processed food markets, café culture, and increasing preference for bio-based flavor ingredients.
Key Growth Drivers
- Growing Consumer Preference for Clean-Label and Natural Flavoring Ingredients
Consumers increasingly seek transparent, natural additives, propelling the natural vanillin industry forward. Food manufacturers replace synthetic alternatives with vanillin derived from natural sources to meet ‘clean label’ expectations, where labels highlight minimal processing and origin clarity. This shift aligns with broader wellness trends, as natural vanillin enhances flavor without artificial connotations. Industry data indicates that clean-label product launches incorporating natural flavors grew by over 15% annually in recent years, directly boosting vanillin adoption. Theoretical frameworks such as consumer behavior models emphasize how perceived health benefits drive premium pricing tolerance, justifying investments in sustainable sourcing. As regulatory bodies promote additive transparency, companies leverage natural vanillin to differentiate, fostering long-term loyalty in a competitive landscape. This driver not only sustains volume growth but also elevates margins through value-added positioning.
- Widening Use of Natural Vanillin Across Global Food and Beverage Industry
The food and beverages sector anchors the natural vanillin market, with bakery, confectionery, and dairy products relying on vanillin for its versatile sweet and aromatic profile. Manufacturers integrate it to replicate vanilla's richness cost-effectively, especially as vanilla bean prices fluctuate due to climatic vulnerabilities. Theoretical supply chain analyses reveal how vanillin stabilizes formulation costs, enabling scalable production for global brands. Statistics show this segment commands nearly 70% market share in 2025, driven by rising snacking and premium indulgence trends. Beyond mere substitution, vanillin supports innovation in low-sugar formulations, where it masks bitterness and enhances mouthfeel. As urbanization accelerates ready-to-eat demand, producers scale operations to capture emerging middle-class appetites, solidifying the market's foundational role in everyday consumption.
Key Restraints
- Climate-Induced Supply Instability Challenges Sustainable Vanilla Sourcing and Pricing
Fluctuations in vanilla pod yields due to erratic weather patterns constrain the natural vanillin market, exacerbating raw material shortages. Theoretical models in agronomy highlight how cyclones in key regions such as Madagascar disrupt pollination cycles, leading to biennial gluts and famines. This volatility inflates input costs by up to 30%, pressuring margins for downstream processors. While diversification into synthetic routes offers buffers, purity standards limit scalability, underscoring the need for resilient hedging strategies.
- High Extraction Costs Limit Competitiveness Against Synthetic Vanillin Alternatives
High labor and extraction expenses for natural processes hinder affordability in the natural vanillin industry, particularly for eugenol-based methods. Economic theory posits that scale economies favor petrochemical alternatives, which command 80% market dominance at one-tenth the price. This disparity deters mass-market penetration, confining growth to niche segments and amplifying competitive pressures on cost structures.
Natural Vanillin Market Trends and Opportunities
- Biotechnological Advancements Revolutionize Sustainable and Scalable Natural Vanillin Production
Advancements in microbial fermentation open avenues for scalable production in the natural vanillin market, bypassing traditional extraction limitations. By engineering yeast strains to convert glucose into vanillin, manufacturers achieve cost efficiencies without sacrificing ‘natural’ labeling. This opportunity aligns with circular economy principles, repurposing agricultural waste such as rice bran for ferulic acid derivation. Theoretical projections indicate that such innovations could lower entry barriers, enabling broader adoption in high-volume applications such as beverages. Moreover, partnerships with biotech firms accelerate commercialization, enhancing the market's competitiveness against synthetic incumbents. Stakeholders can capitalize by investing in pilot facilities, yielding long-term supply stability and market share gains through patented processes.
- Rising Wellness and Nutraceutical Trends Unlock New Avenues for Natural Vanillin
The market stands to benefit from surging demand in functional foods and nutraceuticals, where vanillin enhances palatability in fortified products. As consumers seek mood-boosting and anti-inflammatory additives, its eugenol-derived variants fit seamlessly into adaptogenic beverages and supplements. This opportunity leverages health halo effects, with formulations targeting stress relief in urban demographics. Industry analysts suggest untapped potential in Asia-Pacific's herbal fusion trends, were natural vanillin bridges traditional remedies and modern delivery.
Segment-wise Trends & Analysis
- Food & Beverages Dominate Natural Vanillin Applications Amid Clean-Label and Wellness Trends
The Food & Beverages segment leads by commanding approximately 70% share in 2025, valued at USD 385 million. This dominance arises from vanillin's integral role in flavor masking and enhancement, particularly in bakery and confectionery sub-segments where it stabilizes aromas during processing. Competitive positioning favors integrated suppliers who offer customized blends, outpacing fragmented players through scale efficiencies.
Growth in this segment accelerates at a robust CAGR through 2033, propelled by clean-label demands and sugar-reduction initiatives in beverages and dairy. Underlying drivers include regulatory incentives for natural additives, enabling 15-20% formulation upgrades in major brands. Cosmetics & Personal Care emerges as the fast-growing segment, with 18% projected share by 2033, as vanillin integrates into sustainable fragrances. Its trajectory benefits from vegan trends, where it replaces animal-derived scents, enhancing market positioning for agile innovators.
- Ferulic Acid Synthesis Leads as Efficient and Sustainable Source of Natural Vanillin
Ferulic Acid Synthesis holds over 55% market share in the Natural Vanillin Market for 2025, equating to USD 302.5 million, due to its efficient yield from rice bran byproducts. This leadership stems from cost advantages in large-scale extraction, allowing dominant producers to undercut competitors while maintaining purity standards above 99%.
The segment's growth sustains at 9.8% CAGR to 2032, driven by advancements in enzymatic hydrolysis that boost output by 25%. Vanilla Bean Extract emerges as a fast-growing source, gaining traction at a sustainable CAGR amid authenticity premiums in luxury goods.
Regional Trends & Analysis
North America Leads with Strong Vanilla Culture and Clean-Label Preferences
North America’s market is underpinned by robust vanilla extract usage and a strong home-baking and premium dessert culture. Vanilla extract held over 36% of global revenue in recent years, reflecting the region’s appetite for natural flavors and premiumization in F&B categories. Ongoing distributor alignments and portfolio expansions by major suppliers enhance market access and service levels for natural flavor systems in the U.S. and Canada.
U.S. Natural Vanillin Market – 2025 Snapshot & Outlook
Demand is driven by premium and artisanal food trends, sustained interest in home baking, and the incorporation of natural vanilla notes in craft beverages. Clean-label preferences elevate the use of natural and bio-based vanillin in reformulations. Distributor exclusivity arrangements announced by leading suppliers in 2025 broaden reach for natural and bio-based vanillin portfolios, improving service reliability and SKU breadth for U.S. customers. Consumer baking and specialty dessert trends—reinforced by social media and retail premiumization—continue to reinforce natural flavor demand, with U.S. vanilla extract values projected to expand in the decade.
Asia Pacific Emerges as Fastest-Growing Hub for Natural Vanillin Adoption
Asia Pacific is the fastest-growing region as processed foods, bakery, confectionery, and café culture scale in China, India, Japan, and South Korea. The region’s preference for natural and bio-based ingredients is accelerating, supported by regulatory push for clean labels in several markets, and the spread of premium ice cream and dairy-alternative categories. Manufacturing advantages and rising disposable incomes further catalyze market growth.
China Natural Vanillin Market – 2025 Snapshot & Outlook
Growth is supported by expanding bakery chains, RTD beverages, and domestic flavor capacity. Fermentation and ferulic-acid-based routes are actively scaled to meet sustainability and cost goals in local supply chains. As café culture and premium desserts proliferate in Tier 1–2 cities, formulators increasingly adopt natural vanillin to meet consumer preferences for recognizable ingredients in premium formats.
India Natural Vanillin Market – 2025 Snapshot & Outlook
India’s growth is propelled by urbanization, expanding modern retail, and processed foods penetration. Rising demand for clean-label and natural flavors in dairy, confectionery, and bakery creates opportunities for Natural Vanillin—especially in value-engineered formulations enabled by ferulic-acid synthesis. The region’s manufacturing cost advantages and growing middle class support long-term demand for natural flavor systems.
Europe Advances Natural Vanillin Demand through Sustainability and Premiumization Focus
Europe’s Natural Vanillin Market benefits from high regulatory emphasis on natural claims, strong premium food culture, and leading cosmetics and personal care industries. Clean-label preferences and sustainability criteria drive adoption of bio-based Natural Vanillin across F&B and beauty categories. Germany, France, and the U.K. lead demand, with sustainability and origin narratives resonating strongly with consumers.
Germany Natural Vanillin Market – 2025 Snapshot & Outlook
Germany’s health-conscious consumers favor clean-label, sustainably produced flavors; enzymatic and bio-based methods align with environmental priorities. Demand in bakery, confectionery, and premium dairy formats supports steady growth, while beauty and personal care adopt natural fragrances and functional actives such as vanillin.
U.K Natural Vanillin Market – 2025 Snapshot & Outlook
Premium desserts, artisanal confectionery, and perfumery support Natural Vanillin. The U.K.’s shift toward plant-based foods and specialty beverages drives demand for natural flavoring, while France’s fragrance sector sustains vanillin demand across perfumery and luxury cosmetics. European vanilla extract markets remain robust, anchored in premiumization and origin claims.
Competitive Landscape Analysis
The players in the natural vanillin market are focusing on biotechnological innovations to secure sustainable supply chains. This strategy addresses raw material scarcities, as evidenced by a 15% R&D investment surge in 2024 among top firms. Such moves enable premium pricing, with innovators capturing 25% more market share in clean-label segments. Moreover, collaborations with agrotech startups accelerate fermentation efficiencies, reducing lead times by 30%. These efforts collectively fortify positions against synthetic rivals.
Regulatory evolutions, such as EU's bio-sourcing mandates, will elevate compliance costs by 12%, while M&A activity—such as potential consolidations in Asia—expands capacity amid 9.5% demand growth. Early movers will benefit from established ESG credentials, while latecomers may face premium sourcing premiums.
Key Companies
- Givaudan
- Firmenich SA
- Symrise
- Kerry Group
- Sensient Tech Corp
- MANE
- PROVA
- SOLVAY
- Aurochemicals
- Advanced BioTech
Recent Developments:
- In July 2025, Aurochemicals achieved a 99% Safe Quality Food (SQF) rating in 2024, continuing its long record of excellence in food safety and quality. This accomplishment reflects the company’s unwavering commitment to producing premium, safe, and high-quality natural aroma ingredients for the global flavor and fragrance sector.
- In June 2025, Givaudan has earned Rainforest Alliance certification for select vanilla extracts marketed in Europe, reinforcing its sustainability and community support initiatives in Madagascar through its Sourcing4Good program. The certification ensures traceable, eco-friendly vanilla sourcing while empowering farmers and promoting responsible consumer choices.
- In June 2025, MANE, a global leader in fragrance innovation, continues to set benchmarks in creativity, sustainability, and technology. With cutting-edge scent solutions and forward-thinking initiatives, the company shapes the future of fragrance, reinforcing its position as a trusted partner for brands worldwide.
Global Natural Vanillin Market Segmentation-
By Source
- Vanilla Bean Extract
- Eugenol Synthesis
- Ferulic Acid Synthesis
- Others
By Application
- Food & Beverages
- Bakery & Confectionary
- Beverages
- Dairy
- Others
- Pharmaceuticals
- Cosmetics & Personal Care
By Region
- North America
- Europe
- Asia Pacific
- Latin America
- Middle East & Africa
- Executive Summary
- Global Natural Vanillin Market Snapshot
- Future Projections
- Key Market Trends
- Regional Snapshot, by Value, 2026
- Analyst Recommendations
- Market Overview
- Market Definitions and Segmentations
- Market Dynamics
- Drivers
- Restraints
- Market Opportunities
- Value Chain Analysis
- COVID-19 Impact Analysis
- Porter's Five Forces Analysis
- Impact of Russia-Ukraine Conflict
- PESTLE Analysis
- Regulatory Analysis
- Price Trend Analysis
- Current Prices and Future Projections, 2025-2033
- Price Impact Factors
- Global Natural Vanillin Market Outlook, 2020 - 2033
- Global Natural Vanillin Market Outlook, by Source, Value (US$ Mn), 2020-2033
- Vanilla Bean Extract
- Eugenol Synthesis
- Eugenol Synthesis
- Others
- Global Natural Vanillin Market Outlook, by Application, Value (US$ Mn), 2020-2033
- Food & Beverages
- Bakery & Confectionary
- Beverages
- Dairy
- Others
- Pharmaceuticals
- Cosmetics & Personal Care
- Food & Beverages
- Global Natural Vanillin Market Outlook, by Region, Value (US$ Mn), 2020-2033
- North America
- Europe
- Asia Pacific
- Latin America
- Middle East & Africa
- Global Natural Vanillin Market Outlook, by Source, Value (US$ Mn), 2020-2033
- North America Natural Vanillin Market Outlook, 2020 - 2033
- North America Natural Vanillin Market Outlook, by Source, Value (US$ Mn), 2020-2033
- Vanilla Bean Extract
- Eugenol Synthesis
- Eugenol Synthesis
- Others
- North America Natural Vanillin Market Outlook, by Application, Value (US$ Mn), 2020-2033
- Food & Beverages
- Bakery & Confectionary
- Beverages
- Dairy
- Others
- Pharmaceuticals
- Cosmetics & Personal Care
- Food & Beverages
- North America Natural Vanillin Market Outlook, by Country, Value (US$ Mn), 2020-2033
- U.S. Natural Vanillin Market Outlook, by Source, 2020-2033
- U.S. Natural Vanillin Market Outlook, by Application, 2020-2033
- Canada Natural Vanillin Market Outlook, by Source, 2020-2033
- Canada Natural Vanillin Market Outlook, by Application, 2020-2033
- BPS Analysis/Market Attractiveness Analysis
- North America Natural Vanillin Market Outlook, by Source, Value (US$ Mn), 2020-2033
- Europe Natural Vanillin Market Outlook, 2020 - 2033
- Europe Natural Vanillin Market Outlook, by Source, Value (US$ Mn), 2020-2033
- Vanilla Bean Extract
- Eugenol Synthesis
- Eugenol Synthesis
- Others
- Europe Natural Vanillin Market Outlook, by Application, Value (US$ Mn), 2020-2033
- Food & Beverages
- Bakery & Confectionary
- Beverages
- Dairy
- Others
- Pharmaceuticals
- Cosmetics & Personal Care
- Food & Beverages
- Europe Natural Vanillin Market Outlook, by Country, Value (US$ Mn), 2020-2033
- Germany Natural Vanillin Market Outlook, by Source, 2020-2033
- Germany Natural Vanillin Market Outlook, by Application, 2020-2033
- Italy Natural Vanillin Market Outlook, by Source, 2020-2033
- Italy Natural Vanillin Market Outlook, by Application, 2020-2033
- France Natural Vanillin Market Outlook, by Source, 2020-2033
- France Natural Vanillin Market Outlook, by Application, 2020-2033
- U.K. Natural Vanillin Market Outlook, by Source, 2020-2033
- U.K. Natural Vanillin Market Outlook, by Application, 2020-2033
- Spain Natural Vanillin Market Outlook, by Source, 2020-2033
- Spain Natural Vanillin Market Outlook, by Application, 2020-2033
- Russia Natural Vanillin Market Outlook, by Source, 2020-2033
- Russia Natural Vanillin Market Outlook, by Application, 2020-2033
- Rest of Europe Natural Vanillin Market Outlook, by Source, 2020-2033
- Rest of Europe Natural Vanillin Market Outlook, by Application, 2020-2033
- BPS Analysis/Market Attractiveness Analysis
- Europe Natural Vanillin Market Outlook, by Source, Value (US$ Mn), 2020-2033
- Asia Pacific Natural Vanillin Market Outlook, 2020 - 2033
- Asia Pacific Natural Vanillin Market Outlook, by Source, Value (US$ Mn), 2020-2033
- Vanilla Bean Extract
- Eugenol Synthesis
- Eugenol Synthesis
- Others
- Asia Pacific Natural Vanillin Market Outlook, by Application, Value (US$ Mn), 2020-2033
- Food & Beverages
- Bakery & Confectionary
- Beverages
- Dairy
- Others
- Pharmaceuticals
- Cosmetics & Personal Care
- Food & Beverages
- Asia Pacific Natural Vanillin Market Outlook, by Country, Value (US$ Mn), 2020-2033
- China Natural Vanillin Market Outlook, by Source, 2020-2033
- China Natural Vanillin Market Outlook, by Application, 2020-2033
- Japan Natural Vanillin Market Outlook, by Source, 2020-2033
- Japan Natural Vanillin Market Outlook, by Application, 2020-2033
- South Korea Natural Vanillin Market Outlook, by Source, 2020-2033
- South Korea Natural Vanillin Market Outlook, by Application, 2020-2033
- India Natural Vanillin Market Outlook, by Source, 2020-2033
- India Natural Vanillin Market Outlook, by Application, 2020-2033
- Southeast Asia Natural Vanillin Market Outlook, by Source, 2020-2033
- Southeast Asia Natural Vanillin Market Outlook, by Application, 2020-2033
- Rest of SAO Natural Vanillin Market Outlook, by Source, 2020-2033
- Rest of SAO Natural Vanillin Market Outlook, by Application, 2020-2033
- BPS Analysis/Market Attractiveness Analysis
- Asia Pacific Natural Vanillin Market Outlook, by Source, Value (US$ Mn), 2020-2033
- Latin America Natural Vanillin Market Outlook, 2020 - 2033
- Latin America Natural Vanillin Market Outlook, by Source, Value (US$ Mn), 2020-2033
- Vanilla Bean Extract
- Eugenol Synthesis
- Eugenol Synthesis
- Others
- Latin America Natural Vanillin Market Outlook, by Application, Value (US$ Mn), 2020-2033
- Food & Beverages
- Bakery & Confectionary
- Beverages
- Dairy
- Others
- Pharmaceuticals
- Cosmetics & Personal Care
- Food & Beverages
- Latin America Natural Vanillin Market Outlook, by Country, Value (US$ Mn), 2020-2033
- Brazil Natural Vanillin Market Outlook, by Source, 2020-2033
- Brazil Natural Vanillin Market Outlook, by Application, 2020-2033
- Mexico Natural Vanillin Market Outlook, by Source, 2020-2033
- Mexico Natural Vanillin Market Outlook, by Application, 2020-2033
- Argentina Natural Vanillin Market Outlook, by Source, 2020-2033
- Argentina Natural Vanillin Market Outlook, by Application, 2020-2033
- Rest of LATAM Natural Vanillin Market Outlook, by Source, 2020-2033
- Rest of LATAM Natural Vanillin Market Outlook, by Application, 2020-2033
- BPS Analysis/Market Attractiveness Analysis
- Latin America Natural Vanillin Market Outlook, by Source, Value (US$ Mn), 2020-2033
- Middle East & Africa Natural Vanillin Market Outlook, 2020 - 2033
- Middle East & Africa Natural Vanillin Market Outlook, by Source, Value (US$ Mn), 2020-2033
- Vanilla Bean Extract
- Eugenol Synthesis
- Eugenol Synthesis
- Others
- Middle East & Africa Natural Vanillin Market Outlook, by Application, Value (US$ Mn), 2020-2033
- Food & Beverages
- Bakery & Confectionary
- Beverages
- Dairy
- Others
- Pharmaceuticals
- Cosmetics & Personal Care
- Food & Beverages
- Middle East & Africa Natural Vanillin Market Outlook, by Country, Value (US$ Mn), 2020-2033
- GCC Natural Vanillin Market Outlook, by Source, 2020-2033
- GCC Natural Vanillin Market Outlook, by Application, 2020-2033
- South Africa Natural Vanillin Market Outlook, by Source, 2020-2033
- South Africa Natural Vanillin Market Outlook, by Application, 2020-2033
- Egypt Natural Vanillin Market Outlook, by Source, 2020-2033
- Egypt Natural Vanillin Market Outlook, by Application, 2020-2033
- Nigeria Natural Vanillin Market Outlook, by Source, 2020-2033
- Nigeria Natural Vanillin Market Outlook, by Application, 2020-2033
- Rest of Middle East Natural Vanillin Market Outlook, by Source, 2020-2033
- Rest of Middle East Natural Vanillin Market Outlook, by Application, 2020-2033
- BPS Analysis/Market Attractiveness Analysis
- Middle East & Africa Natural Vanillin Market Outlook, by Source, Value (US$ Mn), 2020-2033
- Competitive Landscape
- Company Vs Segment Heatmap
- Company Market Share Analysis, 2025
- Competitive Dashboard
- Company Profiles
- Givaudan
- Company Overview
- Product Portfolio
- Financial Overview
- Business Strategies and Developments
- Firmenich SA
- Symrise
- Kerry Group
- Sensient Tech Corp
- MANE
- PROVA
- SOLVAY
- Aurochemicals
- Advanced BioTech
- Givaudan
- Appendix
- Research Methodology
- Report Assumptions
- Acronyms and Abbreviations
|
BASE YEAR |
HISTORICAL DATA |
FORECAST PERIOD |
UNITS |
|||
|
2025 |
|
2019 - 2024 |
2026 - 2033 |
Value: US$ Million |
||
|
REPORT FEATURES |
DETAILS |
|
Application Coverage |
|
|
Sources Coverage |
|
|
Geographical Coverage |
|
|
Leading Companies |
|
|
Report Highlights |
Market Estimates and Forecast, Market Dynamics, Industry Trends, Competition Landscape, Product-, Application, Region, Country-wise Trends & Analysis, COVID-19 Impact Analysis, Key Trends |