



Non-Dispersive Infrared Market
Non-Dispersive Infrared Market Size, Share, Insights, Competitive Landscape, and Forecast 2026 to 2033
Non-Dispersive Infrared Market Size and Trend Analysis
How Fast Is the NDIR Gas Measurement Market Growing?
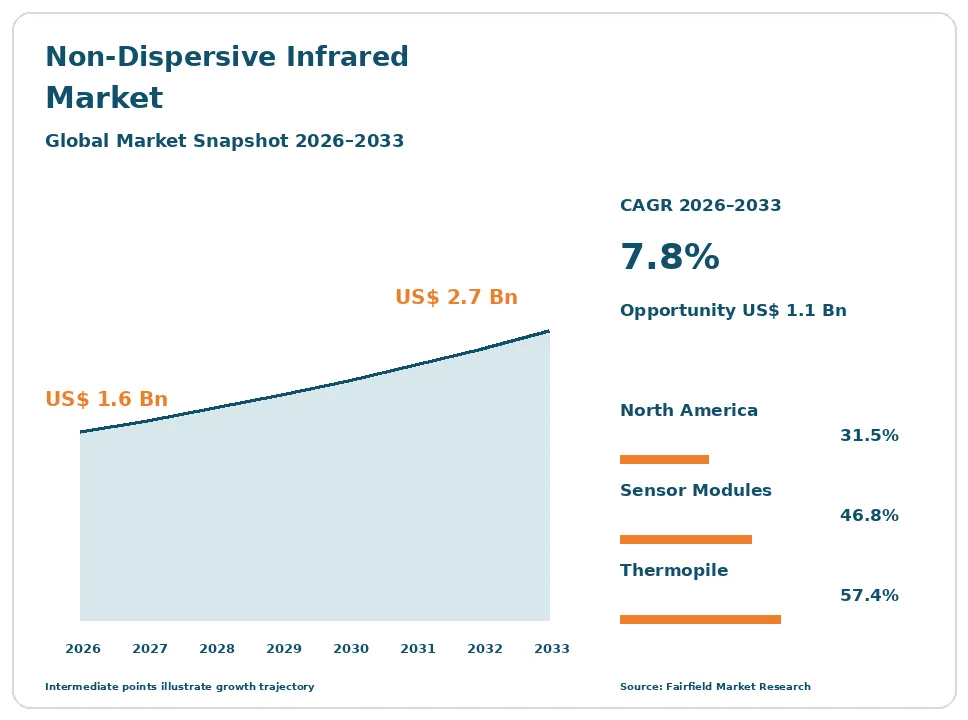
The global non-dispersive infrared market size is expected to be valued at US$ 1.6 billion in 2026 and projected to reach US$ 2.7 billion by 2033, growing at a CAGR of 7.8% between 2026 and 2033.
Between 2020 and 2025 the market advanced at roughly 6.2% a year, lifted by indoor air quality attention after the pandemic and by steady replacement of chemical carbon dioxide cells. Three forces carry growth to 2033. Ventilation provisions in national building regulations increasingly permit airflow to be modulated on measured carbon dioxide, which turns the sensor into required equipment rather than an option. Medical capnography and anaesthetic agent monitoring expand with surgical and critical care volumes. Emissions measurement, refrigerant leak detection and controlled-atmosphere storage each add smaller but faster pools. The direction is very high unit volume at falling module prices, with value protected by complete analysers, calibration services and certified performance rather than by the sensing element alone.
Key Report Takeaways
- By Offering: Sensor modules held 46.8% share in 2026, while OEM components are projected to expand at an 8.9% CAGR through 2033, driven by appliance and instrument makers buying infrared emitters, filters and detectors separately for in-house designs.
- By Gas Measured: Carbon dioxide held 58.2% share in 2026, while refrigerant measurement is projected to grow at an 11.2% CAGR through 2033, driven by safety standards that require leak detection where flammable low-global-warming refrigerants are charged.
- By Application: Building HVAC and indoor air quality held 34.6% share in 2026, while medical capnography and anaesthetic monitoring is projected to advance at a 9.6% CAGR through 2033, driven by waveform capnography becoming routine in anaesthesia and resuscitation.
- By Detector Technology: Thermopile detectors held 57.4% share in 2026, while MEMS and microbolometer detectors are projected to expand at an 11.8% CAGR through 2033, driven by wafer-level manufacture shrinking package size and unit cost together.
- By Geography: North America held 31.5% share in 2026, while Asia Pacific is projected to post a 9.9% CAGR through 2033, driven by module manufacturing scale and tightening ventilation requirements in new commercial construction.
Global Non-Dispersive Infrared Market Trends and Insights
Drivers Impact Analysis
| Driver | Impact on CAGR Forecast | Geographic Relevance | Impact Timeline |
| Demand-controlled ventilation provisions making carbon dioxide sensing a required component | High | North America, Europe, Asia Pacific | Long term (≥4 years) |
| Indoor air quality awareness raising monitor and ventilation fitment rates | High | Global | Medium term (2–4 years) |
Two forces account for most of the value added to infrared gas measurement through 2033.
Demand-Controlled Ventilation Rules Make Carbon Dioxide Sensing a Required Building Component
Demand-controlled ventilation is the single largest reason infrared gas sensing ships in volume. National building regulations and ventilation standards increasingly allow outdoor air rates in densely occupied spaces to be modulated against measured carbon dioxide rather than fixed at design occupancy. Once a code permits that trade, energy performance calculations reward it, and the sensor stops being an upgrade and becomes part of the ventilation unit specification.
The mechanism is energy cost. Conditioning outdoor air is one of the largest loads in a classroom, lecture hall, meeting room or cinema, and occupancy varies hourly. Modulating on carbon dioxide cuts that load without breaching the ventilation rate occupants actually need. ASHRAE ventilation standards, European workplace guidance and school air quality programmes all recognise the approach, and WELL and LEED building certification credits award points for continuous carbon dioxide monitoring, which pulls sensors into projects chasing those ratings.
Indoor Air Quality Attention After the Pandemic Lifts NDIR Fitment in Occupied Spaces
Occupant and employer attention to indoor air has durably raised the proportion of buildings that measure carbon dioxide at all. Schools, offices, healthcare waiting areas and transport hubs installed monitors during and after the pandemic, and many kept them because the readings became part of facilities reporting. That shift converted a specialist instrument into a visible building fixture, and infrared measurement captured almost all of it because carbon dioxide cannot be measured cheaply any other way.
The causal chain runs through procurement rather than regulation. Carbon dioxide is used as a proxy for how well a space is ventilated, so a single inexpensive reading answers a question that occupants, unions and school authorities now ask directly. Public guidance in several countries recommends monitoring in classrooms and crowded workplaces, and wireless building sensor platforms made installation cheap enough for retrofit across existing estates.
Restraints Impact Analysis
| Restraint | Impact on CAGR Forecast | Geographic Relevance | Impact Timeline |
| Commoditisation and price erosion in high-volume carbon dioxide modules | High | Global | Short term (≤2 years) |
| Cross-sensitivity, drift and the optical path cost and size floor | Medium | Global | Medium term (2–4 years) |
Two structural pressures sit on supplier margins and on the range of products NDIR can serve.
Price Erosion in Commodity Carbon Dioxide Modules Compresses Supplier Margins
Unit volume growth in carbon dioxide modules has not translated into proportionate revenue growth, because the price of a basic module has fallen steadily. Thermostat, ventilation unit and air quality monitor makers buy in six-figure annual quantities and tender aggressively, and several suppliers have built capacity specifically for that trade. Margins on the simplest single-channel module are now thin enough that some established vendors have stepped away from the lowest price points.
The cost structure explains why. An infrared emitter, a moulded or machined gas cell, a bandpass filter and a thermopile are a short bill of materials with few proprietary steps once the optical design is copied. Differentiation therefore shifts to calibration quality, long-term stability data, firmware compensation and warranty length. Suppliers that cannot sell those attributes compete only on price, and buyers switch sources between production runs.
Drift, Compensation Needs and the Optical Path Size Floor Limit Where NDIR Can Be Used
Buyers routinely underestimate what an infrared gas sensor needs to stay accurate, and disappointed installations slow repeat orders. Readings shift with temperature, barometric pressure and humidity, so every serious design carries compensation and a calibration routine. Many building sensors rely on automatic baseline correction, which assumes the space periodically reaches outdoor carbon dioxide levels. In continuously occupied rooms, greenhouses or storage chambers that assumption fails and the device drifts.
Physics sets the second limit. Selectivity comes from an optical path long enough to absorb measurably at the target wavelength, so there is a floor under package size, power draw and cost that a metal-oxide or electrochemical sensor does not face. That floor keeps infrared out of the cheapest consumer products, while photoacoustic and tunable diode laser techniques take the high-sensitivity and trace-level work above it.
Market Opportunities
Two emerging revenue pools sit outside the established building and process business.
Refrigerant Leak Detection Creates a New Instrument Pool as Flammable Low-GWP Gases Spread
Refrigerant leak detection is becoming a required function rather than a maintenance service, and that creates a durable attached market for infrared sensing. Safety standards for refrigerating systems and heat pumps, including EN 378 and ISO 5149, set charge limits and require detection and ventilation interlocks in machinery rooms and in occupied spaces above defined thresholds. As equipment moves to mildly flammable and natural refrigerants, more installations cross those thresholds.
The buyers are heat pump, chiller, supermarket refrigeration and transport refrigeration manufacturers, plus the contractors who maintain the installed base. Infrared sensing suits the task because it responds to the specific refrigerant molecule rather than to any combustible gas, so it can distinguish a leak from a solvent or cooking vapour and does not poison. Vendors that pre-qualify sensors against named refrigerant blends capture fitment on the equipment bill of materials.
Miniaturised MEMS Infrared Sensing Opens Portable, Wearable and Capnography Volume
Wafer-level infrared emitters and detectors are opening applications the traditional module could never reach, and they carry better margins than the commodity building sensor. MEMS emitters switch faster and draw less power than incandescent sources, and integrated detector arrays remove discrete alignment steps. Together they shrink the optical bench enough for battery-powered monitors, portable analysers and handheld leak detectors sold in consumer and field service channels.
Medical capnography is the most valuable target. Portable and transport capnographs, and single-patient mainstream airway adapters, need small, fast, low-power infrared benches that meet the respiratory gas monitor requirements of ISO 80601-2-55. Device makers in emergency medicine, veterinary care and sleep diagnostics all want the same component. Suppliers able to deliver qualified, documented sensing assemblies rather than bare sensors capture that integration value.
Segment Analysis
By Offering: Sensor Modules Lead Volume While OEM Components Expand Fastest
Sensor modules held 46.8% share in 2026, because the calibrated, digitally interfaced module is what thermostat, ventilation, monitor and appliance makers actually buy. A module hides the optical and compensation work behind a simple output, which lets a product team add gas measurement without acquiring spectroscopy skills. Complete instruments and analysers accounted for 35.8%, covering emissions benches, process analysers, capnographs and portable detectors, where regulatory acceptance and service contracts protect pricing.
OEM components hold 17.4% share and grow fastest at an 8.9% CAGR through 2033. Larger device makers increasingly buy infrared sources, bandpass filters, gas cells and thermopile or pyroelectric detectors separately and build their own benches, to control cost and differentiate performance. The business implication is that value is migrating to both ends of the chain, toward component specialists and toward certified instruments, while the middle commoditises.
By Gas Measured: Carbon Dioxide Dominates as Refrigerant Measurement Accelerates
Carbon dioxide represented 58.2% of infrared gas measurement demand in 2026, a position no other gas approaches. Carbon dioxide has strong, well-separated absorption bands, no practical low-cost alternative measurement, and an enormous ventilation application behind it. Hydrocarbons and methane followed at 13.6%, carbon monoxide at 8.4%, nitrous oxide and anaesthetic agents at 5.8%, and sulphur hexafluoride at 3.2%, mostly in electrical equipment and leak surveys, with other gases at 4.5%.
Refrigerants held 6.3% share and grow fastest at an 11.2% CAGR through 2033. The shift to mildly flammable and lower-global-warming refrigerants brings charge limits and mandatory detection into mainstream heat pump and commercial refrigeration equipment. For suppliers the consequence is that gas-specific filter and calibration libraries, not sensor hardware, become the asset that wins new fitment.
By Application: Building Air Quality Leads While Medical Capnography Grows Quickest
Building HVAC and indoor air quality accounted for 34.6% of demand in 2026, reflecting the sheer unit count of ventilation controllers, thermostats and room monitors. Industrial process and combustion control followed at 19.2%, where infrared analysers measure flue gas, furnace atmospheres and process streams continuously. Automotive and engine emissions measurement took 11.5%, environmental and research monitoring 8.4%, agriculture and controlled-atmosphere storage 7.1%, and food and beverage 4.9%.
Medical capnography and anaesthetic monitoring held 14.3% share and grow fastest at a 9.6% CAGR through 2033. Waveform capnography is now standard practice in anaesthesia, intensive care and increasingly in emergency and transport medicine, and each monitored bed needs an infrared bench. The implication is that the highest-value growth sits where certification, not price, decides the purchase.
By Detector Technology: Thermopile Detectors Hold Scale as MEMS Devices Advance Fastest
Thermopile detectors held 57.4% share in 2026, because they are inexpensive, need no bias power, respond adequately for building and appliance applications and have decades of manufacturing maturity behind them. Pyroelectric detectors took 29.3%, preferred where faster response, multi-channel referencing or higher sensitivity is needed, which covers most analysers, capnographs and multi-gas instruments. Both are produced in high volume by a small group of specialist suppliers.
MEMS and microbolometer detectors hold 13.3% share and grow fastest at an 11.8% CAGR through 2033. Wafer-level fabrication integrates the detector, filter and sometimes the emitter drive on one substrate, cutting assembly cost and package volume at the same time. For the industry this is the clearest route past the size and price floor that has kept infrared sensing out of consumer and wearable products.
Geography Analysis
Which Region Is Leading the Non-Dispersive Infrared Market?
North America is leading the non-dispersive infrared market, with 31.5% share in 2026 and a 6.8% CAGR to 2033. The United States accounts for most of it, with Canada adding commercial building and process instrument demand. Leadership comes from value rather than unit count: the region buys a disproportionate share of capnographs, emissions benches, continuous process analysers and certified calibration services, all of which carry far higher prices than a building module.
Three specific causes sustain the position. Hospital and ambulance capnography fitment is close to universal, vehicle emissions testing supports a large analyser installed base, and commercial building retrofits routinely add carbon dioxide-based ventilation control to cut conditioning load. ISO/IEC 17025 accredited calibration laboratories and certified reference gas suppliers are concentrated here. The main change underway is school and workplace air quality programmes extending monitoring into buildings that previously measured nothing.
Europe Converts Building Ventilation and Workplace Air Quality Rules Into Sensor Demand
Europe accounted for 27.8% of global demand in 2026 and grows at 7.0% through 2033. Germany, France, the United Kingdom, the Netherlands, Sweden and Italy drive most consumption. The region hosts several of the largest infrared module designers and a dense base of process analyser and medical device manufacturing, so it both supplies and consumes at scale.
Regulation shapes demand more directly here than anywhere else. Building energy performance rules push ventilation control toward measured occupancy, classroom air quality programmes in several countries recommend continuous carbon dioxide monitoring, and refrigeration safety standards drive leak detection into heat pump installations. Energy cost is the practical barrier, squeezing construction budgets and delaying retrofit projects. The opportunity is heat pump deployment at scale, which attaches a refrigerant sensing requirement to equipment shipped in millions of units.
Which Region Is Growing Fastest in the Non-Dispersive Infrared Market?
Asia Pacific is growing fastest in the non-dispersive infrared market, at a 9.9% CAGR through 2033 from 28.6% share in 2026. China, Japan, Korea and India account for most of the increase, with Singapore, Vietnam and Australia contributing. The region manufactures the majority of infrared modules and detector components, and it is now consuming them at a comparable pace as commercial construction adopts ventilation control.
Two causes drive the rate. New commercial and institutional buildings are specified with building management systems from the outset, so sensors enter at construction rather than retrofit, and national air quality concern has made indoor monitoring a consumer product category in its own right. Hospital capnography fitment and industrial emissions monitoring are both rising from low bases. The change to watch is domestic component suppliers moving from modules into certified analysers.
Latin America Builds Demand From Commercial Buildings and Controlled-Atmosphere Food Storage
Latin America represented 6.4% share in 2026 and grows at 7.6% to 2033. Brazil and Mexico account for most consumption, with Chile, Colombia and Argentina contributing. Demand divides between commercial building ventilation in the largest cities and controlled-atmosphere storage for fruit, where carbon dioxide and oxygen control directly determine how long produce can be held before export.
Barriers are practical. Building codes rarely mandate ventilation control, calibration and service infrastructure is thin outside major centres, and currency movements make dollar-priced instruments expensive to buy and to recalibrate. Medical capnography fitment lags hospital bed growth. The clearest opportunity is agricultural: the region’s fruit export industry competes on arrival quality, and storage atmosphere measurement pays for itself in reduced spoilage, which makes it an easier sale than an energy efficiency argument.
Middle East & Africa Adds Volume Through Cooling Load Management and Gas Processing
Middle East & Africa held 5.7% share in 2026 and grows at 8.1% to 2033. Saudi Arabia, the United Arab Emirates, Qatar, Egypt, Nigeria and South Africa drive most demand. Two distinct pools exist. Extreme cooling loads make ventilation modulation financially attractive in large air-conditioned buildings, and oil, gas and petrochemical processing supports a steady base of hydrocarbon and carbon dioxide analyser demand.
Barriers include limited local calibration capability, reliance on imported instruments and service, and uneven enforcement of building ventilation requirements outside flagship developments. Skilled maintenance for drifting sensors is scarce. The change underway is large planned urban and infrastructure projects in the Gulf specifying building management systems and indoor environmental quality monitoring from the design stage, which builds an installed base that will need recalibration and replacement throughout the forecast period.
Competitive Landscape
The non-dispersive infrared market is moderately concentrated, and it is really two competitive arenas with different structures. In high-volume carbon dioxide modules a handful of specialists supply most branded fitment, while a long tail of lower-cost manufacturers competes for price-driven monitor and appliance business. In complete analysers the picture is tighter: a small group of established process instrument and medical device companies holds most of the value, protected by regulatory acceptance, service networks and decades of installed base. Consolidation has come mainly through sensor specialists being acquired by larger electronics and materials groups seeking a position in building and medical sensing.
Competition runs on four things. Long-term stability is first, because a sensor that drifts creates service cost the buyer remembers at the next tender. Calibration and traceability is second, with accredited laboratories and certified reference gas mixtures prepared to recognised gas analysis practice underpinning any performance claim. Cost per unit at volume is third and dominates the module trade. Application-specific qualification completes the set, covering medical approvals, refrigerant-specific calibration and emissions measurement acceptance.
Strategic activity concentrates on moving away from the commodity centre. Established suppliers are pushing into MEMS-based benches, multi-gas modules and sensing assemblies sold with firmware and compensation rather than as bare components. Others are deepening in regulated applications where approval cost deters entrants. Component makers are selling emitters, filters and detectors directly to device manufacturers that previously bought finished modules.
The broad direction is differentiation by documentation and integration. Vendors increasingly compete on proven drift performance, qualification evidence and software, because the optical principle itself is no longer scarce.
Non-Dispersive Infrared Industry Leaders
- Senseair AB
- Honeywell International Inc.
- Horiba, Ltd.
- Vaisala Oyj
- Amphenol Advanced Sensors
Recent Industry Developments
- September 2017: Real driving emissions testing became mandatory for new passenger car type approvals in the European Union, requiring on-road measurement with portable emissions measurement systems – infrared benches measure the carbon dioxide and carbon monoxide used to calculate on-road emissions, moving the technology from laboratory equipment to a type-approval requirement.
- November 2017: The revised edition of ISO/IEC 17025, the general requirements for the competence of testing and calibration laboratories, was issued – it set the accreditation basis on which infrared analyser calibrations and reference gas traceability claims now rest.
- September 2021: The World Health Organization published updated global air quality guidelines, tightening recommended limits for several pollutants including carbon monoxide – it strengthened the case for continuous ambient and indoor monitoring programmes that use infrared measurement.
- April 2024: The European Union adopted a recast of its Energy Performance of Buildings Directive, requiring new and significantly renovated buildings to be equipped with devices for monitoring and regulating indoor air quality – it converts carbon dioxide measurement from a design option into a construction requirement across member states.
Companies Covered in the Report
- Senseair AB
- Gas Sensing Solutions Ltd.
- Amphenol Advanced Sensors
- Vaisala Oyj
- Honeywell International Inc.
- Siemens AG
- ABB Ltd.
- Emerson Electric Co.
- Teledyne Technologies Incorporated
- Servomex Group Limited
- Horiba, Ltd.
- Drägerwerk AG & Co. KGaA
- Figaro Engineering Inc.
- Murata Manufacturing Co., Ltd.
Non-Dispersive Infrared Market Report Scope
This report covers infrared gas measurement: sensor modules, the OEM components inside them, and complete instruments and analysers. Measured gases include carbon dioxide, hydrocarbons, carbon monoxide, refrigerants, nitrous oxide and sulphur hexafluoride. Because instruments are counted alongside modules, values exceed module-only estimates; the wider gas sensing market is examined separately. Service subscriptions and laboratory spectrometers are excluded. The base year is 2025, the forecast period 2026 to 2033, in US$ Billion.
Offering
- Sensor Modules
- OEM Components
- Complete Instruments and Analysers
Gas Measured
- Carbon Dioxide
- Hydrocarbons and Methane
- Carbon Monoxide
- Refrigerants
- Nitrous Oxide and Anaesthetic Agents
- Sulphur Hexafluoride
- Other Gases
Application
- Building HVAC and Indoor Air Quality
- Medical Capnography and Anaesthetic Monitoring
- Automotive and Engine Emissions Measurement
- Industrial Process and Combustion Control
- Agriculture and Controlled-Atmosphere Storage
- Food and Beverage
- Environmental and Research Monitoring
Detector Technology
- Thermopile Detectors
- Pyroelectric Detectors
- MEMS and Microbolometer Detectors
Regions
- North America
- Europe
- Asia Pacific
- Latin America
- Middle East & Africa
Key Questions Answered in the Report
How big is the non-dispersive infrared market in 2026?
The global non-dispersive infrared market is valued at US$ 1.6 billion in 2026, counting sensor modules, OEM components and complete infrared gas analysers together.
What is the forecast size and CAGR of the NDIR market by 2033?
The market is projected to reach US$ 2.7 billion by 2033, growing at a 7.8% CAGR and adding an absolute opportunity of US$ 1.1 billion.
Which application leads the non-dispersive infrared market?
Building HVAC and indoor air quality leads with 34.6% share in 2026, reflecting the unit volume of ventilation controllers, thermostats and room air quality monitors.
Which segment is growing fastest in infrared gas measurement?
Refrigerant measurement grows fastest at an 11.2% CAGR, while MEMS and microbolometer detectors expand at 11.8% within the detector technology category.
Which region holds the largest share of the NDIR market?
North America holds 31.5% share in 2026, led by capnography, emissions benches, process analysers and accredited calibration services carrying high unit values.
1. Executive Summary
1.1. Global Non-Dispersive Infrared Market Snapshot
1.2. Future Projections
1.3. Key Report Takeaways
1.4. Regional Snapshot
2. Market Overview
2.1. Market Definition and Report Scope
2.2. Historical Trends 2020–2025
2.3. Market Dynamics
2.3.1. Drivers
2.3.1.1. Demand-Controlled Ventilation Rules Make Carbon Dioxide Sensing a Required Building Component
2.3.1.2. Indoor Air Quality Attention After the Pandemic Lifts NDIR Fitment in Occupied Spaces
2.3.2. Restraints
2.3.2.1. Price Erosion in Commodity Carbon Dioxide Modules Compresses Supplier Margins
2.3.2.2. Drift, Compensation Needs and the Optical Path Size Floor Limit Where NDIR Can Be Used
2.3.3. Market Opportunities
2.3.3.1. Refrigerant Leak Detection Creates a New Instrument Pool as Flammable Low-GWP Gases Spread
2.3.3.2. Miniaturised MEMS Infrared Sensing Opens Portable, Wearable and Capnography Volume
3. Global Non-Dispersive Infrared Market Outlook, 2020–2033
3.1. Global Non-Dispersive Infrared Market Outlook, by Offering, Value (US$ Billion), 2020–2033
3.1.1. Sensor Modules
3.1.2. OEM Components
3.1.3. Complete Instruments and Analysers
3.2. Global Non-Dispersive Infrared Market Outlook, by Gas Measured, Value (US$ Billion), 2020–2033
3.2.1. Carbon Dioxide
3.2.2. Hydrocarbons and Methane
3.2.3. Carbon Monoxide
3.2.4. Refrigerants
3.2.5. Nitrous Oxide and Anaesthetic Agents
3.2.6. Sulphur Hexafluoride
3.2.7. Other Gases
3.3. Global Non-Dispersive Infrared Market Outlook, by Application, Value (US$ Billion), 2020–2033
3.3.1. Building HVAC and Indoor Air Quality
3.3.2. Medical Capnography and Anaesthetic Monitoring
3.3.3. Automotive and Engine Emissions Measurement
3.3.4. Industrial Process and Combustion Control
3.3.5. Agriculture and Controlled-Atmosphere Storage
3.3.6. Food and Beverage
3.3.7. Environmental and Research Monitoring
3.4. Global Non-Dispersive Infrared Market Outlook, by Detector Technology, Value (US$ Billion), 2020–2033
3.4.1. Thermopile Detectors
3.4.2. Pyroelectric Detectors
3.4.3. MEMS and Microbolometer Detectors
3.5. Global Non-Dispersive Infrared Market Outlook, by Region, Value (US$ Billion), 2020–2033
3.5.1. North America
3.5.2. Europe
3.5.3. Asia Pacific
3.5.4. Latin America
3.5.5. Middle East & Africa
4. North America Non-Dispersive Infrared Market Outlook, 2020–2033
4.1. North America Non-Dispersive Infrared Market Outlook, by Offering, Value (US$ Billion), 2020–2033
4.1.1. Sensor Modules
4.1.2. OEM Components
4.1.3. Complete Instruments and Analysers
4.2. North America Non-Dispersive Infrared Market Outlook, by Gas Measured, Value (US$ Billion), 2020–2033
4.2.1. Carbon Dioxide
4.2.2. Hydrocarbons and Methane
4.2.3. Carbon Monoxide
4.2.4. Refrigerants
4.2.5. Nitrous Oxide and Anaesthetic Agents
4.2.6. Sulphur Hexafluoride
4.2.7. Other Gases
4.3. North America Non-Dispersive Infrared Market Outlook, by Application, Value (US$ Billion), 2020–2033
4.3.1. Building HVAC and Indoor Air Quality
4.3.2. Medical Capnography and Anaesthetic Monitoring
4.3.3. Automotive and Engine Emissions Measurement
4.3.4. Industrial Process and Combustion Control
4.3.5. Agriculture and Controlled-Atmosphere Storage
4.3.6. Food and Beverage
4.3.7. Environmental and Research Monitoring
4.4. North America Non-Dispersive Infrared Market Outlook, by Detector Technology, Value (US$ Billion), 2020–2033
4.4.1. Thermopile Detectors
4.4.2. Pyroelectric Detectors
4.4.3. MEMS and Microbolometer Detectors
4.5. North America Non-Dispersive Infrared Market Outlook, by Country, Value (US$ Billion), 2020–2033
4.5.1. United States Non-Dispersive Infrared Market Outlook, by Offering, 2020–2033
4.5.2. United States Non-Dispersive Infrared Market Outlook, by Gas Measured, 2020–2033
4.5.3. United States Non-Dispersive Infrared Market Outlook, by Application, 2020–2033
4.5.4. United States Non-Dispersive Infrared Market Outlook, by Detector Technology, 2020–2033
4.5.5. Canada Non-Dispersive Infrared Market Outlook, by Offering, 2020–2033
4.5.6. Canada Non-Dispersive Infrared Market Outlook, by Gas Measured, 2020–2033
4.5.7. Canada Non-Dispersive Infrared Market Outlook, by Application, 2020–2033
4.5.8. Canada Non-Dispersive Infrared Market Outlook, by Detector Technology, 2020–2033
5. Europe Non-Dispersive Infrared Market Outlook, 2020–2033
5.1. Europe Non-Dispersive Infrared Market Outlook, by Offering, Value (US$ Billion), 2020–2033
5.1.1. Sensor Modules
5.1.2. OEM Components
5.1.3. Complete Instruments and Analysers
5.2. Europe Non-Dispersive Infrared Market Outlook, by Gas Measured, Value (US$ Billion), 2020–2033
5.2.1. Carbon Dioxide
5.2.2. Hydrocarbons and Methane
5.2.3. Carbon Monoxide
5.2.4. Refrigerants
5.2.5. Nitrous Oxide and Anaesthetic Agents
5.2.6. Sulphur Hexafluoride
5.2.7. Other Gases
5.3. Europe Non-Dispersive Infrared Market Outlook, by Application, Value (US$ Billion), 2020–2033
5.3.1. Building HVAC and Indoor Air Quality
5.3.2. Medical Capnography and Anaesthetic Monitoring
5.3.3. Automotive and Engine Emissions Measurement
5.3.4. Industrial Process and Combustion Control
5.3.5. Agriculture and Controlled-Atmosphere Storage
5.3.6. Food and Beverage
5.3.7. Environmental and Research Monitoring
5.4. Europe Non-Dispersive Infrared Market Outlook, by Detector Technology, Value (US$ Billion), 2020–2033
5.4.1. Thermopile Detectors
5.4.2. Pyroelectric Detectors
5.4.3. MEMS and Microbolometer Detectors
5.5. Europe Non-Dispersive Infrared Market Outlook, by Country, Value (US$ Billion), 2020–2033
5.5.1. Germany Non-Dispersive Infrared Market Outlook, by Offering, 2020–2033
5.5.2. Germany Non-Dispersive Infrared Market Outlook, by Gas Measured, 2020–2033
5.5.3. Germany Non-Dispersive Infrared Market Outlook, by Application, 2020–2033
5.5.4. Germany Non-Dispersive Infrared Market Outlook, by Detector Technology, 2020–2033
5.5.5. France Non-Dispersive Infrared Market Outlook, by Offering, 2020–2033
5.5.6. France Non-Dispersive Infrared Market Outlook, by Gas Measured, 2020–2033
5.5.7. France Non-Dispersive Infrared Market Outlook, by Application, 2020–2033
5.5.8. France Non-Dispersive Infrared Market Outlook, by Detector Technology, 2020–2033
5.5.9. United Kingdom Non-Dispersive Infrared Market Outlook, by Offering, 2020–2033
5.5.10. United Kingdom Non-Dispersive Infrared Market Outlook, by Gas Measured, 2020–2033
5.5.11. United Kingdom Non-Dispersive Infrared Market Outlook, by Application, 2020–2033
5.5.12. United Kingdom Non-Dispersive Infrared Market Outlook, by Detector Technology, 2020–2033
5.5.13. Netherlands Non-Dispersive Infrared Market Outlook, by Offering, 2020–2033
5.5.14. Netherlands Non-Dispersive Infrared Market Outlook, by Gas Measured, 2020–2033
5.5.15. Netherlands Non-Dispersive Infrared Market Outlook, by Application, 2020–2033
5.5.16. Netherlands Non-Dispersive Infrared Market Outlook, by Detector Technology, 2020–2033
5.5.17. Sweden Non-Dispersive Infrared Market Outlook, by Offering, 2020–2033
5.5.18. Sweden Non-Dispersive Infrared Market Outlook, by Gas Measured, 2020–2033
5.5.19. Sweden Non-Dispersive Infrared Market Outlook, by Application, 2020–2033
5.5.20. Sweden Non-Dispersive Infrared Market Outlook, by Detector Technology, 2020–2033
5.5.21. Italy Non-Dispersive Infrared Market Outlook, by Offering, 2020–2033
5.5.22. Italy Non-Dispersive Infrared Market Outlook, by Gas Measured, 2020–2033
5.5.23. Italy Non-Dispersive Infrared Market Outlook, by Application, 2020–2033
5.5.24. Italy Non-Dispersive Infrared Market Outlook, by Detector Technology, 2020–2033
6. Asia Pacific Non-Dispersive Infrared Market Outlook, 2020–2033
6.1. Asia Pacific Non-Dispersive Infrared Market Outlook, by Offering, Value (US$ Billion), 2020–2033
6.1.1. Sensor Modules
6.1.2. OEM Components
6.1.3. Complete Instruments and Analysers
6.2. Asia Pacific Non-Dispersive Infrared Market Outlook, by Gas Measured, Value (US$ Billion), 2020–2033
6.2.1. Carbon Dioxide
6.2.2. Hydrocarbons and Methane
6.2.3. Carbon Monoxide
6.2.4. Refrigerants
6.2.5. Nitrous Oxide and Anaesthetic Agents
6.2.6. Sulphur Hexafluoride
6.2.7. Other Gases
6.3. Asia Pacific Non-Dispersive Infrared Market Outlook, by Application, Value (US$ Billion), 2020–2033
6.3.1. Building HVAC and Indoor Air Quality
6.3.2. Medical Capnography and Anaesthetic Monitoring
6.3.3. Automotive and Engine Emissions Measurement
6.3.4. Industrial Process and Combustion Control
6.3.5. Agriculture and Controlled-Atmosphere Storage
6.3.6. Food and Beverage
6.3.7. Environmental and Research Monitoring
6.4. Asia Pacific Non-Dispersive Infrared Market Outlook, by Detector Technology, Value (US$ Billion), 2020–2033
6.4.1. Thermopile Detectors
6.4.2. Pyroelectric Detectors
6.4.3. MEMS and Microbolometer Detectors
6.5. Asia Pacific Non-Dispersive Infrared Market Outlook, by Country, Value (US$ Billion), 2020–2033
6.5.1. China Non-Dispersive Infrared Market Outlook, by Offering, 2020–2033
6.5.2. China Non-Dispersive Infrared Market Outlook, by Gas Measured, 2020–2033
6.5.3. China Non-Dispersive Infrared Market Outlook, by Application, 2020–2033
6.5.4. China Non-Dispersive Infrared Market Outlook, by Detector Technology, 2020–2033
6.5.5. Japan Non-Dispersive Infrared Market Outlook, by Offering, 2020–2033
6.5.6. Japan Non-Dispersive Infrared Market Outlook, by Gas Measured, 2020–2033
6.5.7. Japan Non-Dispersive Infrared Market Outlook, by Application, 2020–2033
6.5.8. Japan Non-Dispersive Infrared Market Outlook, by Detector Technology, 2020–2033
6.5.9. Korea Non-Dispersive Infrared Market Outlook, by Offering, 2020–2033
6.5.10. Korea Non-Dispersive Infrared Market Outlook, by Gas Measured, 2020–2033
6.5.11. Korea Non-Dispersive Infrared Market Outlook, by Application, 2020–2033
6.5.12. Korea Non-Dispersive Infrared Market Outlook, by Detector Technology, 2020–2033
6.5.13. India Non-Dispersive Infrared Market Outlook, by Offering, 2020–2033
6.5.14. India Non-Dispersive Infrared Market Outlook, by Gas Measured, 2020–2033
6.5.15. India Non-Dispersive Infrared Market Outlook, by Application, 2020–2033
6.5.16. India Non-Dispersive Infrared Market Outlook, by Detector Technology, 2020–2033
6.5.17. Singapore Non-Dispersive Infrared Market Outlook, by Offering, 2020–2033
6.5.18. Singapore Non-Dispersive Infrared Market Outlook, by Gas Measured, 2020–2033
6.5.19. Singapore Non-Dispersive Infrared Market Outlook, by Application, 2020–2033
6.5.20. Singapore Non-Dispersive Infrared Market Outlook, by Detector Technology, 2020–2033
6.5.21. Vietnam Non-Dispersive Infrared Market Outlook, by Offering, 2020–2033
6.5.22. Vietnam Non-Dispersive Infrared Market Outlook, by Gas Measured, 2020–2033
6.5.23. Vietnam Non-Dispersive Infrared Market Outlook, by Application, 2020–2033
6.5.24. Vietnam Non-Dispersive Infrared Market Outlook, by Detector Technology, 2020–2033
6.5.25. Australia Non-Dispersive Infrared Market Outlook, by Offering, 2020–2033
6.5.26. Australia Non-Dispersive Infrared Market Outlook, by Gas Measured, 2020–2033
6.5.27. Australia Non-Dispersive Infrared Market Outlook, by Application, 2020–2033
6.5.28. Australia Non-Dispersive Infrared Market Outlook, by Detector Technology, 2020–2033
7. Latin America Non-Dispersive Infrared Market Outlook, 2020–2033
7.1. Latin America Non-Dispersive Infrared Market Outlook, by Offering, Value (US$ Billion), 2020–2033
7.1.1. Sensor Modules
7.1.2. OEM Components
7.1.3. Complete Instruments and Analysers
7.2. Latin America Non-Dispersive Infrared Market Outlook, by Gas Measured, Value (US$ Billion), 2020–2033
7.2.1. Carbon Dioxide
7.2.2. Hydrocarbons and Methane
7.2.3. Carbon Monoxide
7.2.4. Refrigerants
7.2.5. Nitrous Oxide and Anaesthetic Agents
7.2.6. Sulphur Hexafluoride
7.2.7. Other Gases
7.3. Latin America Non-Dispersive Infrared Market Outlook, by Application, Value (US$ Billion), 2020–2033
7.3.1. Building HVAC and Indoor Air Quality
7.3.2. Medical Capnography and Anaesthetic Monitoring
7.3.3. Automotive and Engine Emissions Measurement
7.3.4. Industrial Process and Combustion Control
7.3.5. Agriculture and Controlled-Atmosphere Storage
7.3.6. Food and Beverage
7.3.7. Environmental and Research Monitoring
7.4. Latin America Non-Dispersive Infrared Market Outlook, by Detector Technology, Value (US$ Billion), 2020–2033
7.4.1. Thermopile Detectors
7.4.2. Pyroelectric Detectors
7.4.3. MEMS and Microbolometer Detectors
7.5. Latin America Non-Dispersive Infrared Market Outlook, by Country, Value (US$ Billion), 2020–2033
7.5.1. Brazil Non-Dispersive Infrared Market Outlook, by Offering, 2020–2033
7.5.2. Brazil Non-Dispersive Infrared Market Outlook, by Gas Measured, 2020–2033
7.5.3. Brazil Non-Dispersive Infrared Market Outlook, by Application, 2020–2033
7.5.4. Brazil Non-Dispersive Infrared Market Outlook, by Detector Technology, 2020–2033
7.5.5. Mexico Non-Dispersive Infrared Market Outlook, by Offering, 2020–2033
7.5.6. Mexico Non-Dispersive Infrared Market Outlook, by Gas Measured, 2020–2033
7.5.7. Mexico Non-Dispersive Infrared Market Outlook, by Application, 2020–2033
7.5.8. Mexico Non-Dispersive Infrared Market Outlook, by Detector Technology, 2020–2033
7.5.9. Chile Non-Dispersive Infrared Market Outlook, by Offering, 2020–2033
7.5.10. Chile Non-Dispersive Infrared Market Outlook, by Gas Measured, 2020–2033
7.5.11. Chile Non-Dispersive Infrared Market Outlook, by Application, 2020–2033
7.5.12. Chile Non-Dispersive Infrared Market Outlook, by Detector Technology, 2020–2033
7.5.13. Colombia Non-Dispersive Infrared Market Outlook, by Offering, 2020–2033
7.5.14. Colombia Non-Dispersive Infrared Market Outlook, by Gas Measured, 2020–2033
7.5.15. Colombia Non-Dispersive Infrared Market Outlook, by Application, 2020–2033
7.5.16. Colombia Non-Dispersive Infrared Market Outlook, by Detector Technology, 2020–2033
7.5.17. Argentina Non-Dispersive Infrared Market Outlook, by Offering, 2020–2033
7.5.18. Argentina Non-Dispersive Infrared Market Outlook, by Gas Measured, 2020–2033
7.5.19. Argentina Non-Dispersive Infrared Market Outlook, by Application, 2020–2033
7.5.20. Argentina Non-Dispersive Infrared Market Outlook, by Detector Technology, 2020–2033
8. Middle East & Africa Non-Dispersive Infrared Market Outlook, 2020–2033
8.1. Middle East & Africa Non-Dispersive Infrared Market Outlook, by Offering, Value (US$ Billion), 2020–2033
8.1.1. Sensor Modules
8.1.2. OEM Components
8.1.3. Complete Instruments and Analysers
8.2. Middle East & Africa Non-Dispersive Infrared Market Outlook, by Gas Measured, Value (US$ Billion), 2020–2033
8.2.1. Carbon Dioxide
8.2.2. Hydrocarbons and Methane
8.2.3. Carbon Monoxide
8.2.4. Refrigerants
8.2.5. Nitrous Oxide and Anaesthetic Agents
8.2.6. Sulphur Hexafluoride
8.2.7. Other Gases
8.3. Middle East & Africa Non-Dispersive Infrared Market Outlook, by Application, Value (US$ Billion), 2020–2033
8.3.1. Building HVAC and Indoor Air Quality
8.3.2. Medical Capnography and Anaesthetic Monitoring
8.3.3. Automotive and Engine Emissions Measurement
8.3.4. Industrial Process and Combustion Control
8.3.5. Agriculture and Controlled-Atmosphere Storage
8.3.6. Food and Beverage
8.3.7. Environmental and Research Monitoring
8.4. Middle East & Africa Non-Dispersive Infrared Market Outlook, by Detector Technology, Value (US$ Billion), 2020–2033
8.4.1. Thermopile Detectors
8.4.2. Pyroelectric Detectors
8.4.3. MEMS and Microbolometer Detectors
8.5. Middle East & Africa Non-Dispersive Infrared Market Outlook, by Country, Value (US$ Billion), 2020–2033
8.5.1. Saudi Arabia Non-Dispersive Infrared Market Outlook, by Offering, 2020–2033
8.5.2. Saudi Arabia Non-Dispersive Infrared Market Outlook, by Gas Measured, 2020–2033
8.5.3. Saudi Arabia Non-Dispersive Infrared Market Outlook, by Application, 2020–2033
8.5.4. Saudi Arabia Non-Dispersive Infrared Market Outlook, by Detector Technology, 2020–2033
8.5.5. United Arab Emirates Non-Dispersive Infrared Market Outlook, by Offering, 2020–2033
8.5.6. United Arab Emirates Non-Dispersive Infrared Market Outlook, by Gas Measured, 2020–2033
8.5.7. United Arab Emirates Non-Dispersive Infrared Market Outlook, by Application, 2020–2033
8.5.8. United Arab Emirates Non-Dispersive Infrared Market Outlook, by Detector Technology, 2020–2033
8.5.9. Qatar Non-Dispersive Infrared Market Outlook, by Offering, 2020–2033
8.5.10. Qatar Non-Dispersive Infrared Market Outlook, by Gas Measured, 2020–2033
8.5.11. Qatar Non-Dispersive Infrared Market Outlook, by Application, 2020–2033
8.5.12. Qatar Non-Dispersive Infrared Market Outlook, by Detector Technology, 2020–2033
8.5.13. Egypt Non-Dispersive Infrared Market Outlook, by Offering, 2020–2033
8.5.14. Egypt Non-Dispersive Infrared Market Outlook, by Gas Measured, 2020–2033
8.5.15. Egypt Non-Dispersive Infrared Market Outlook, by Application, 2020–2033
8.5.16. Egypt Non-Dispersive Infrared Market Outlook, by Detector Technology, 2020–2033
8.5.17. Nigeria Non-Dispersive Infrared Market Outlook, by Offering, 2020–2033
8.5.18. Nigeria Non-Dispersive Infrared Market Outlook, by Gas Measured, 2020–2033
8.5.19. Nigeria Non-Dispersive Infrared Market Outlook, by Application, 2020–2033
8.5.20. Nigeria Non-Dispersive Infrared Market Outlook, by Detector Technology, 2020–2033
8.5.21. South Africa Non-Dispersive Infrared Market Outlook, by Offering, 2020–2033
8.5.22. South Africa Non-Dispersive Infrared Market Outlook, by Gas Measured, 2020–2033
8.5.23. South Africa Non-Dispersive Infrared Market Outlook, by Application, 2020–2033
8.5.24. South Africa Non-Dispersive Infrared Market Outlook, by Detector Technology, 2020–2033
9. Competitive Landscape
9.1. Market Concentration and Industry Leaders
9.2. Competitive Differentiation
9.3. Strategic Moves and Market Direction
9.4. Recent Industry Developments
9.5. Company Profiles
9.5.1. Senseair AB
9.5.2. Gas Sensing Solutions Ltd.
9.5.3. Amphenol Advanced Sensors
9.5.4. Vaisala Oyj
9.5.5. Honeywell International Inc.
9.5.6. Siemens AG
9.5.7. ABB Ltd.
9.5.8. Emerson Electric Co.
9.5.9. Teledyne Technologies Incorporated
9.5.10. Servomex Group Limited
9.5.11. Horiba, Ltd.
9.5.12. Drägerwerk AG & Co. KGaA
9.5.13. Figaro Engineering Inc.
9.5.14. Murata Manufacturing Co., Ltd.
10. Appendix
10.1. Research Methodology
10.2. Report Assumptions
10.3. Acronyms and Abbreviations
| Offering | Sensor Modules, OEM Components, Complete Instruments and Analysers |
| Gas Measured | Carbon Dioxide, Hydrocarbons and Methane, Carbon Monoxide, Refrigerants, Nitrous Oxide and Anaesthetic Agents, Sulphur Hexafluoride, Other Gases |
| Application | Building HVAC and Indoor Air Quality, Medical Capnography and Anaesthetic Monitoring, Automotive and Engine Emissions Measurement, Industrial Process and Combustion Control, Agriculture and Controlled-Atmosphere Storage, Food and Beverage, Environmental and Research Monitoring |
| Detector Technology | Thermopile Detectors, Pyroelectric Detectors, MEMS and Microbolometer Detectors |
| Regions | North America, Europe, Asia Pacific, Latin America, Middle East & Africa |
Our Research Methodology
Considering the volatility of business today, traditional approaches to strategizing a game plan can be unfruitful if not detrimental. True ambiguity is no way to determine a forecast. A myriad of predetermined factors must be accounted for such as the degree of risk involved, the magnitude of circumstances, as well as conditions or consequences that are not known or unpredictable. To circumvent binary views that cast uncertainty, the application of market research intelligence to strategically posture, move, and enable actionable outcomes is necessary.
View Methodology
Quality Assured
Rigorous Validation Process

Confidentiality Assured
End-to-end Data Security

Custom Research Services
Tailored To Your Objectives
FAQs
The global non-dispersive infrared market is valued at US$ 1.6 billion in 2026, counting sensor modules, OEM components and complete infrared gas analysers together.
The market is projected to reach US$ 2.7 billion by 2033, growing at a 7.8% CAGR and adding an absolute opportunity of US$ 1.1 billion.
Building HVAC and indoor air quality leads with 34.6% share in 2026, reflecting the unit volume of ventilation controllers, thermostats and room air quality monitors.
Refrigerant measurement grows fastest at an 11.2% CAGR, while MEMS and microbolometer detectors expand at 11.8% within the detector technology category.
North America holds 31.5% share in 2026, led by capnography, emissions benches, process analysers and accredited calibration services carrying high unit values.
Related Reports
Satcom Terminal Market Size, Share, Insights, Competitive Landscape, and Forecast 2026 to 2033
The satcom terminal market is projected to grow from US$8.6 billion in 2026 to US$20.6 billion by 2033, at a 13.3% CAGR. Explore segments and key trends.
5G Edge Computing Market Size, Share, Insights, Competitive Landscape, and Forecast 2026 to 2033
The global 5G edge computing market is valued at US$10.45 billion in 2026, reaching US$161.37 billion by 2033, growing at a 47.8% CAGR
Aerial Imaging Market Size, Share, Insights, Competitive Landscape, and Forecast 2026 to 2033
The global aerial imaging market is valued at US$3.83 billion in 2026, reaching US$8.13 billion by 2033, growing at an 11.4% CAGR
Wearable Cameras Market Size, Share, Insights, Competitive Landscape, and Forecast 2026 to 2033
The global wearable cameras market is valued at US$8.80 billion in 2026, reaching US$20.80 billion by 2033, growing at a 13.1% CAGR
Spend Analytics Market Size, Share, Insights, Competitive Landscape, and Forecast 2026 to 2033
The global spend analytics market is valued at US$3.90 billion in 2026, reaching US$10.40 billion by 2033, growing at a 15.0% CAGR
IoT Security Market Size, Share, Insights, Competitive Landscape, and Forecast 2026 to 2033
The global IoT security market is valued at US$21.40 billion in 2026, reaching US$66.60 billion by 2033, growing at a 17.6% CAGR