



Satcom Terminal Market
Satcom Terminal Market Size, Share, Insights, Competitive Landscape, and Forecast 2026 to 2033
Satcom Terminal Market Size and Trend Analysis
How Big Will the Satcom Terminal Market Become by 2033?
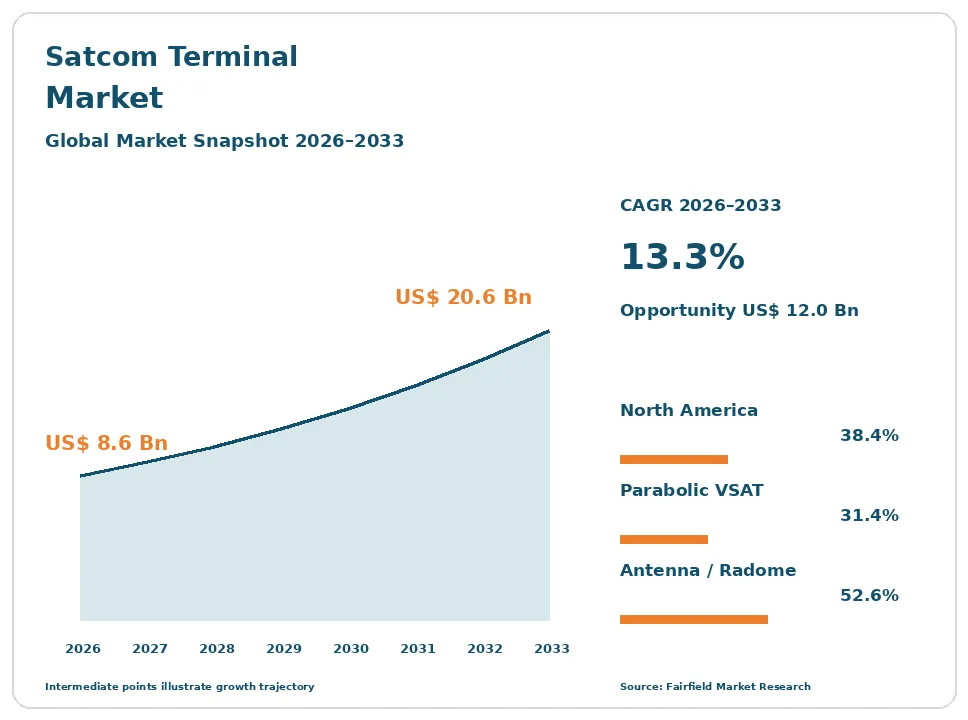
The global satcom terminal market size is expected to be valued at US$ 8.6 billion in 2026 and projected to reach US$ 20.6 billion by 2033, growing at a CAGR of 13.3% between 2026 and 2033.
Between 2020 and 2025 the market grew at about 10.5% a year, as low Earth orbit services moved from pilot deployments into mass consumer and enterprise sales. Three forces carry growth to 2033. Terminal unit volumes have risen by orders of magnitude because a consumer broadband subscription now requires its own user terminal, not a shared dish. Aviation and maritime operators are refitting fleets for higher throughput and lower latency. Defence buyers are funding resilient, multi-orbit ground equipment after watching fixed geostationary links prove vulnerable. The direction is strong value growth on very strong volume growth, partly offset by falling unit prices as electronically steered arrays move onto commercial semiconductor processes.
Key Report Takeaways
- By Terminal Type: Parabolic VSAT antennas held 31.4% share in 2026, while flat-panel and electronically steered array antennas are projected to expand at a 21.4% CAGR through 2033, driven by the need to track and hand over between fast-moving non-geostationary satellites.
- By Component: Antenna and radome assemblies held 52.6% share in 2026, while terminal management software and services are projected to grow at a 17.8% CAGR through 2033, driven by fleet operators buying remote monitoring, orbit selection and network switching as a managed function.
- By Frequency Band: Ku-band held 38.2% share in 2026, while V-band and Q-band terminals are projected to advance at a 24.6% CAGR through 2033, driven by gateway and high-capacity feeder links moving above conventional allocations.
- By End Use: Consumer and small-business broadband held 24.3% share in 2026, while aviation and in-flight connectivity is projected to expand at a 19.2% CAGR through 2033, driven by cabin connectivity becoming a competitive requirement rather than an ancillary service.
- By Geography: North America held 38.4% share in 2026, while Asia Pacific is projected to post a 15.8% CAGR through 2033, driven by maritime fleet refits, archipelagic broadband programmes and growing regional defence procurement.
Global Satcom Terminal Market Trends and Insights
Drivers Impact Analysis
| Driver | Impact on CAGR Forecast | Geographic Relevance | Impact Timeline |
| Low Earth orbit constellations replacing fixed dishes with electronically steered arrays | High | Global | Long term (≥4 years) |
| Government and defence demand for resilient, proliferated-orbit ground equipment | High | North America, Europe, Asia Pacific | Medium term (2–4 years) |
Two forces account for most of the value added to satellite ground terminals through 2033.
Low Earth Orbit Constellations Turn the Satellite Terminal Into a Tracking Array
The shift to low Earth orbit is the defining change in this market, and it rewrote the product. A geostationary terminal is a dish aimed once at a fixed slot and left alone for years. A low Earth orbit terminal must track satellites crossing the sky in minutes, acquire the next one and hand over without dropping the link, which forces electronic beam steering and continuous software control into every unit.
That change moved the centre of gravity from mechanical and radio-frequency dish engineering to semiconductors. An electronically steered array is thousands of radiating elements, beamforming integrated circuits and digital control, so cost falls with silicon volume rather than with sheet metal. Unit shipments rose by orders of magnitude once consumer broadband required one terminal per household, and manufacturers that could not reach semiconductor-scale volumes found themselves outside the growth.
Defence Procurement of Resilient Multi-Orbit Terminals Expands the Government Ground Segment
Government and defence buyers have become the most profitable customer group for terminal makers, and their requirements are expanding. Recent conflicts showed that a force dependent on a small number of fixed, well-known satellite links is exposed to jamming, spoofing and physical attack. The response has been to procure terminals that can move between orbits, constellations and bands, and to fit them on vehicles, vessels, aircraft and dismounted soldiers.
The procurement mechanism rewards hardware rather than services. Defence users buy manpack, tactical, communications-on-the-move and transportable terminals outright, hold them for long service lives, and pay premiums for ruggedisation, anti-jam waveforms, low probability of intercept and protected military Ka-band operation. International Traffic in Arms Regulations and Export Administration Regulations treatment of this equipment also limits which suppliers can bid, which supports pricing for qualified vendors.
Restraints Impact Analysis
| Restraint | Impact on CAGR Forecast | Geographic Relevance | Impact Timeline |
| Terminal cost and operator subsidy squeezing independent terminal manufacturers | High | Global | Short term (≤2 years) |
| Spectrum licensing, landing rights and market access complexity by country | Medium | Latin America, Middle East & Africa, Asia Pacific | Long term (≥4 years) |
Two pressures limit how fast terminals can be deployed and how much merchant suppliers can earn.
Terminal Cost and Operator Subsidies Squeeze Independent Hardware Manufacturers
Terminal price remains the main barrier to satellite broadband adoption, and the industry’s answer has damaged merchant hardware economics. Vertically integrated service operators have sold user terminals below manufacturing cost to win subscribers, recovering the difference through monthly service revenue. That makes the retail price look achievable while making it almost impossible for an independent manufacturer, which has no service margin to draw on, to match it.
The underlying cost source is the phased array itself. Each unit carries hundreds to thousands of radiating elements with associated beamforming and power amplification silicon, a multilayer board, thermal management and a motorised or fixed mount. Transmit arrays are the expensive half, because generating steered power efficiently is far harder than receiving. Until element counts fall or semiconductor integration improves further, the bill of materials resists the price point the mass market expects.
Spectrum Licensing and Landing Rights Limit Where a Terminal May Legally Operate
Regulatory access, not technology, decides where terminals can be sold and used, and it slows deployment market by market. A terminal must operate within nationally authorised spectrum, the service behind it needs landing rights, and earth stations in motion face separate authorisation on ships, aircraft and vehicles. A manufacturer can have a certified product and still wait years for permission in a given country.
The causes are jurisdictional. The International Telecommunication Union Radio Regulations allocate spectrum internationally, but national administrations license individually, often with local partnership, gateway hosting or data routing conditions. Aeronautical and maritime fitment adds certification layers, including environmental qualification to RTCA DO-160 and supplemental type certificates for aircraft installation. Equipment sold in the European Union must meet harmonised ETSI standards for satellite earth stations, and export control adds a further national approval step.
Market Opportunities
Two revenue pools sit beyond the consumer broadband terminal that currently dominates attention.
Multi-Orbit Terminals Open a Premium Replacement Cycle Across Maritime and Aviation Fleets
Terminals that work with both geostationary and non-geostationary satellites are where most commercial engineering effort now sits, and they open a replacement cycle worth more per unit than consumer hardware. Operators of vessels and aircraft do not want to choose between orbits. They want low latency where a constellation is overhead, wide-beam geostationary coverage as fallback, and automatic switching governed by cost, coverage and application priority.
The buyers are shipping companies, cruise and offshore operators, airlines and business aviation fleets, plus the integrators that maintain their communications. Each installation is a high-value sale combining a stabilised or electronically steered antenna, modems for two network types, switching software and certification work. Retrofit is the larger pool, because the installed base of single-orbit maritime and aeronautical terminals vastly exceeds annual new vessel and aircraft deliveries.
Land Mobility and Direct-to-Device Complementarity Create a New Terminal Category
Land mobility is the least developed terminal application and the one with the most headroom. Rail operators, long-haul trucking fleets, emergency services, broadcast outside-broadcast units, mining operations and recreational vehicle owners all need connectivity beyond terrestrial coverage, and flat-panel arrays finally make a low-profile vehicle installation practical where a steerable dish never was.
Direct-to-device services, which link ordinary handsets to satellites, support rather than threaten this pool. They deliver messaging and low-rate data over wide areas, which raises awareness of satellite connectivity but cannot carry the throughput a connected vehicle, a mining site or a broadcast feed requires. The result is a tiered market, where the phone handles the fallback case and a dedicated terminal handles capacity. Vehicle manufacturers and fleet telematics providers are the channel that converts it into volume.
Segment Analysis
By Terminal Type: Parabolic VSAT Antennas Still Lead as Electronically Steered Arrays Surge
Parabolic VSAT antennas held 31.4% share in 2026, retaining the largest position because the installed base is enormous and because a fixed dish remains the cheapest way to move high throughput to and from a geostationary satellite for broadcast contribution, enterprise backhaul and government fixed sites. Maritime stabilised antennas took 12.3%, aeronautical terminals 11.6%, land-mobile and communications-on-the-move terminals 10.2%, and manpack and tactical terminals 7.7%.
Flat-panel and electronically steered array antennas hold 26.8% share and grow fastest at a 21.4% CAGR through 2033. They are the only practical way to track non-geostationary satellites from a moving platform or a consumer rooftop. The business implication is a manufacturing base shifting from precision mechanical assembly toward printed-circuit and semiconductor processes, which favours different suppliers entirely.
By Component: Antenna Assemblies Dominate Value While Terminal Software Climbs Quickest
Antenna and radome assemblies represented 52.6% of terminal value in 2026, because the aperture, its radiating elements, amplification and enclosure carry the majority of the bill of materials in every terminal class. Modems and baseband equipment followed at 21.8%, and block upconverters, downconverters and transceivers accounted for 17.4%, concentrated in the parabolic and maritime segments where the radio chain remains a separate assembly.
Terminal management software and services hold 8.2% share and grow fastest at a 17.8% CAGR through 2033. Multi-orbit operation created a genuine control problem: deciding which network to use, when to hand over and how to allocate capacity across a fleet. Operators increasingly buy that as a managed capability. For vendors it is the most defensible revenue in the terminal, because it renews annually rather than once per hardware cycle.
By Frequency Band: Ku-Band Carries the Installed Base While V-Band and Q-Band Scale Fastest
Ku-band held 38.2% share in 2026, reflecting its dominance in maritime, aeronautical and enterprise VSAT networks and its use by several large non-geostationary constellations. Ka-band followed closely at 32.6%, favoured for high-throughput consumer and aviation services where smaller apertures are possible. X-band and military Ka-band together took 14.1%, serving government users, and C-band retained 12.4% in broadcast contribution and tropical regions where rain fade matters.
V-band and Q-band terminals hold 2.7% share and grow fastest at a 24.6% CAGR through 2033, from a very small base. These allocations are being opened primarily for gateway and feeder links, where concentrating capacity above conventional bands relieves congestion. The implication is that band diversity, rather than any single allocation, becomes a terminal design requirement.
By End Use: Consumer Broadband Leads Volume While Aviation Connectivity Grows Fastest
Consumer and small-business broadband accounted for 24.3% of terminal value in 2026, the largest single pool, driven by households and small sites outside terrestrial broadband reach buying an individual terminal per subscription. Government and defence followed at 23.6% and contributes far more per unit. Commercial maritime took 14.8%, land mobility and enterprise 11.4%, energy and mining 8.1%, and broadcast contribution 5.1%.
Aviation and in-flight connectivity held 12.7% share and grows fastest at a 19.2% CAGR through 2033. Cabin connectivity has become a competitive requirement on long-haul and increasingly on short-haul fleets, and existing installations are being replaced to deliver usable streaming bandwidth per seat. For suppliers this is the most demanding segment, since every design change requires certification before it can fly.
Geography Analysis
Which Region Is Leading the Satcom Terminal Market?
North America is leading the satcom terminal market, with 38.4% share in 2026 and a 12.0% CAGR to 2033. The United States accounts for the overwhelming majority, with Canada adding remote community and resource sector demand. Leadership rests on three concentrations: the largest defence satellite communications budget in the world, the headquarters and manufacturing base of most major terminal suppliers, and the earliest and deepest consumer adoption of low Earth orbit broadband.
Regulation reinforces the position. The US Federal Communications Commission moved relatively early to authorise non-geostationary systems and to create a workable earth stations in motion framework with blanket licensing, which let terminals be deployed at scale without individual site approvals. Defence programmes funding proliferated-orbit architectures sustain high-value terminal procurement. The main change underway is aviation and maritime operators replacing legacy equipment with multi-orbit installations across large fleets.
Europe Builds Terminal Demand Around Sovereignty, Certification and Maritime Fitment
Europe accounted for 23.6% of global demand in 2026 and grows at 13.0% through 2033. The United Kingdom, France, Germany, Italy, Norway and Spain drive most activity. The region hosts significant antenna, modem and radio-frequency manufacturing, a large commercial shipping and offshore fleet, and airline groups refitting cabins, so demand spans consumer, mobility and government uses fairly evenly.
Two forces shape the market. Sovereign connectivity policy is pushing public investment toward communications infrastructure that is not dependent on non-domestic systems, which supports procurement of terminals compatible with regionally governed networks. Certification is the practical gate: equipment must meet harmonised ETSI standards for satellite earth stations and the broader radio equipment requirements before sale. Fragmented national licensing is the main barrier. The clearest opportunity is maritime retrofit, given the size of the regional fleet and offshore energy base.
Which Region Is Growing Fastest in the Satcom Terminal Market?
Asia Pacific is growing fastest in the satcom terminal market, at a 15.8% CAGR through 2033 from 22.8% share in 2026. China, Japan, India, Korea, Australia, Indonesia and the Philippines drive most of the increase. Geography is the fundamental cause: thousands of inhabited islands, extensive mountainous terrain and some of the world’s busiest shipping lanes make satellite the only practical connectivity in large areas.
Three specific causes accelerate it. National programmes aimed at connecting unserved communities buy terminals in bulk for schools, clinics and village access points. The region operates a very large share of the world’s commercial shipping and fishing fleets, which are being fitted with stabilised and flat-panel antennas. Defence spending is rising across several countries, with resilient communications a stated priority. Domestic manufacturing of antennas and modems is also expanding, which will lower delivered cost regionally.
Latin America Expands Terminal Demand Through Rural Broadband and Resource Operations
Latin America represented 7.2% share in 2026 and grows at 14.2% to 2033. Brazil, Mexico, Chile, Colombia, Argentina and Peru account for most demand. Two pools dominate: rural and remote household broadband, where terrestrial networks stop well short of the population, and resource industries, where mining, agriculture and energy sites need connectivity far outside any coverage footprint.
Barriers are regulatory and economic. Landing rights and licensing differ sharply between countries and can take years to obtain, import duties raise delivered terminal prices, and currency volatility makes dollar-denominated hardware expensive relative to local incomes. Installation and maintenance skills are thin outside major cities. The opportunity is public connectivity programmes: several governments subsidise service to schools and clinics, and those tenders buy terminals in quantities no commercial channel would generate alone.
Middle East & Africa Converts Coverage Gaps and Defence Spending Into Terminal Demand
Middle East & Africa held 8.0% share in 2026 and grows at 13.6% to 2033. Saudi Arabia, the United Arab Emirates, Israel, Egypt, Nigeria, Kenya and South Africa account for most activity. The region has the widest gap between population and terrestrial network coverage anywhere, which makes satellite the default rather than the fallback across much of the continent, while Gulf states buy heavily for defence and government use.
Barriers are significant. Licensing regimes are restrictive in several countries, some require local gateway hosting or partnership, and affordability limits consumer uptake where terminal cost exceeds months of household income. Power availability at remote sites constrains installation. The change underway is community and shared-access models, where one terminal backhauls a local wireless network, spreading hardware cost across many users and making the economics work at far lower income levels.
Competitive Landscape
The satcom terminal market is moderately concentrated and is being reordered rather than consolidated. For decades a stable group of VSAT, modem and stabilised antenna specialists divided the market by application. The arrival of electronically steered arrays admitted a different kind of competitor: semiconductor-led antenna companies, printed-circuit and radio-frequency integrators, and vertically integrated service operators that design and build their own user terminals. The result is a market where incumbents hold the installed base and the certified mobility business, while newer entrants hold most of the unit volume growth.
Competition now runs on several axes at once. Cost per terminal at volume matters most in consumer and land mobility, and it is really a semiconductor integration contest over beamforming chip counts, yield and thermal design. Certification and qualification decide aviation, maritime and defence, where environmental testing, airworthiness approval and export clearance take years and deter casual entry. Multi-orbit capability and network-agnostic operation have become table stakes in mobility. Service and global support networks remain decisive for enterprise and maritime customers running critical links.
Strategic activity clusters in recognisable patterns rather than isolated moves. Defence electronics groups have been absorbing antenna and waveform specialists to assemble complete tactical terminal offerings. Service operators keep terminal design in-house to control cost and user experience, which squeezes merchant suppliers out of their largest potential customers. Independent manufacturers are responding by specialising in multi-orbit, certified mobility hardware that operators do not build themselves, and by licensing array technology rather than manufacturing everything internally.
The broad direction is a split between commodity consumer hardware subsidised by service revenue and certified, high-value mobility and government terminals where engineering and approvals still create defensible margins.
Satcom Terminal Industry Leaders
- Viasat, Inc.
- Hughes Network Systems, LLC
- Gilat Satellite Networks Ltd.
- Intellian Technologies, Inc.
- ST Engineering iDirect
Recent Industry Developments
- September 2017: The US Federal Communications Commission adopted updated rules for non-geostationary fixed-satellite service systems, including deployment milestone obligations and spectrum-sharing conditions – it gave constellation operators and their terminal suppliers a defined regulatory path in the largest single market.
- November 2019: The World Radiocommunication Conference concluded with provisions covering earth stations in motion communicating with geostationary networks and a regulatory framework for non-geostationary deployment – it made mobile satellite terminals on ships, aircraft and vehicles internationally authorisable rather than case-by-case.
- January 2020: A second mobile satellite service entered operation within the Global Maritime Distress and Safety System following International Maritime Organization recognition – it ended three decades of single-provider maritime distress communications and opened mandatory ship terminal fitment to competing hardware.
- December 2023: The World Radiocommunication Conference concluded with further decisions on spectrum sharing and on earth stations in motion operating with non-geostationary systems – it reduced the regulatory uncertainty that had limited where low Earth orbit mobility terminals could be licensed.
Companies Covered in the Report
- Viasat, Inc.
- Hughes Network Systems, LLC
- Gilat Satellite Networks Ltd.
- ST Engineering iDirect
- Comtech Telecommunications Corp.
- Kymeta Corporation
- Intellian Technologies, Inc.
- Cobham Satcom
- KVH Industries, Inc.
- Thales Group
- L3Harris Technologies, Inc.
- General Dynamics Mission Systems
- Honeywell International Inc.
- Communications & Power Industries LLC
Satcom Terminal Market Report Scope
This report covers ground user terminals for satellite communications: parabolic VSAT, flat-panel and electronically steered array, maritime stabilised, aeronautical, land-mobile, manpack and tactical terminals, together with the modems, upconverters, downconverters, transceivers and terminal management software sold with them. Satellites, launch services and connectivity service subscriptions are excluded. Coverage spans commercial, government and consumer users. The base year is 2025, the forecast period 2026 to 2033, in US$ Billion.
Terminal Type
- Parabolic VSAT Antennas
- Flat-Panel and Electronically Steered Array Antennas
- Maritime Stabilised Antennas
- Aeronautical Terminals
- Land-Mobile and Communications-on-the-Move Terminals
- Manpack and Tactical Terminals
Component
- Antenna and Radome Assemblies
- Modems and Baseband Equipment
- Block Upconverters, Downconverters and Transceivers
- Terminal Management Software and Services
Frequency Band
- Ku-Band
- Ka-Band
- C-Band
- X-Band and Military Ka-Band
- V-Band and Q-Band
End Use
- Consumer and Small-Business Broadband
- Government and Defence
- Commercial Maritime
- Aviation and In-Flight Connectivity
- Land Mobility and Enterprise
- Energy and Mining
- Broadcast Contribution
Regions
- North America
- Europe
- Asia Pacific
- Latin America
- Middle East & Africa
Key Questions Answered in the Report
How big is the satcom terminal market in 2026?
The global satcom terminal market is valued at US$ 8.6 billion in 2026, covering antennas, modems, radio-frequency electronics and terminal management software worldwide.
What is the forecast size and CAGR of the satellite terminal market by 2033?
The market is projected to reach US$ 20.6 billion by 2033, growing at a 13.3% CAGR and adding an absolute opportunity of US$ 12.0 billion.
Which terminal type holds the largest share?
Parabolic VSAT antennas lead with 31.4% share in 2026, supported by a large installed base in broadcast, enterprise backhaul and fixed government sites.
Which satcom terminal segment is growing fastest?
Flat-panel and electronically steered array antennas grow fastest at a 21.4% CAGR, because tracking non-geostationary satellites requires electronic rather than mechanical beam steering.
Which region leads the satcom terminal market?
North America leads with 38.4% share in 2026, reflecting defence procurement scale, supplier concentration and the earliest mass adoption of low Earth orbit broadband.
1. Executive Summary
1.1. Global Satcom Terminal Market Snapshot
1.2. Future Projections
1.3. Key Report Takeaways
1.4. Regional Snapshot
2. Market Overview
2.1. Market Definition and Report Scope
2.2. Historical Trends 2020–2025
2.3. Market Dynamics
2.3.1. Drivers
2.3.1.1. Low Earth Orbit Constellations Turn the Satellite Terminal Into a Tracking Array
2.3.1.2. Defence Procurement of Resilient Multi-Orbit Terminals Expands the Government Ground Segment
2.3.2. Restraints
2.3.2.1. Terminal Cost and Operator Subsidies Squeeze Independent Hardware Manufacturers
2.3.2.2. Spectrum Licensing and Landing Rights Limit Where a Terminal May Legally Operate
2.3.3. Market Opportunities
2.3.3.1. Multi-Orbit Terminals Open a Premium Replacement Cycle Across Maritime and Aviation Fleets
2.3.3.2. Land Mobility and Direct-to-Device Complementarity Create a New Terminal Category
3. Global Satcom Terminal Market Outlook, 2020–2033
3.1. Global Satcom Terminal Market Outlook, by Terminal Type, Value (US$ Billion), 2020–2033
3.1.1. Parabolic VSAT Antennas
3.1.2. Flat-Panel and Electronically Steered Array Antennas
3.1.3. Maritime Stabilised Antennas
3.1.4. Aeronautical Terminals
3.1.5. Land-Mobile and Communications-on-the-Move Terminals
3.1.6. Manpack and Tactical Terminals
3.2. Global Satcom Terminal Market Outlook, by Component, Value (US$ Billion), 2020–2033
3.2.1. Antenna and Radome Assemblies
3.2.2. Modems and Baseband Equipment
3.2.3. Block Upconverters, Downconverters and Transceivers
3.2.4. Terminal Management Software and Services
3.3. Global Satcom Terminal Market Outlook, by Frequency Band, Value (US$ Billion), 2020–2033
3.3.1. Ku-Band
3.3.2. Ka-Band
3.3.3. C-Band
3.3.4. X-Band and Military Ka-Band
3.3.5. V-Band and Q-Band
3.4. Global Satcom Terminal Market Outlook, by End Use, Value (US$ Billion), 2020–2033
3.4.1. Consumer and Small-Business Broadband
3.4.2. Government and Defence
3.4.3. Commercial Maritime
3.4.4. Aviation and In-Flight Connectivity
3.4.5. Land Mobility and Enterprise
3.4.6. Energy and Mining
3.4.7. Broadcast Contribution
3.5. Global Satcom Terminal Market Outlook, by Region, Value (US$ Billion), 2020–2033
3.5.1. North America
3.5.2. Europe
3.5.3. Asia Pacific
3.5.4. Latin America
3.5.5. Middle East & Africa
4. North America Satcom Terminal Market Outlook, 2020–2033
4.1. North America Satcom Terminal Market Outlook, by Terminal Type, Value (US$ Billion), 2020–2033
4.1.1. Parabolic VSAT Antennas
4.1.2. Flat-Panel and Electronically Steered Array Antennas
4.1.3. Maritime Stabilised Antennas
4.1.4. Aeronautical Terminals
4.1.5. Land-Mobile and Communications-on-the-Move Terminals
4.1.6. Manpack and Tactical Terminals
4.2. North America Satcom Terminal Market Outlook, by Component, Value (US$ Billion), 2020–2033
4.2.1. Antenna and Radome Assemblies
4.2.2. Modems and Baseband Equipment
4.2.3. Block Upconverters, Downconverters and Transceivers
4.2.4. Terminal Management Software and Services
4.3. North America Satcom Terminal Market Outlook, by Frequency Band, Value (US$ Billion), 2020–2033
4.3.1. Ku-Band
4.3.2. Ka-Band
4.3.3. C-Band
4.3.4. X-Band and Military Ka-Band
4.3.5. V-Band and Q-Band
4.4. North America Satcom Terminal Market Outlook, by End Use, Value (US$ Billion), 2020–2033
4.4.1. Consumer and Small-Business Broadband
4.4.2. Government and Defence
4.4.3. Commercial Maritime
4.4.4. Aviation and In-Flight Connectivity
4.4.5. Land Mobility and Enterprise
4.4.6. Energy and Mining
4.4.7. Broadcast Contribution
4.5. North America Satcom Terminal Market Outlook, by Country, Value (US$ Billion), 2020–2033
4.5.1. United States Satcom Terminal Market Outlook, by Terminal Type, 2020–2033
4.5.2. United States Satcom Terminal Market Outlook, by Component, 2020–2033
4.5.3. United States Satcom Terminal Market Outlook, by Frequency Band, 2020–2033
4.5.4. United States Satcom Terminal Market Outlook, by End Use, 2020–2033
4.5.5. Canada Satcom Terminal Market Outlook, by Terminal Type, 2020–2033
4.5.6. Canada Satcom Terminal Market Outlook, by Component, 2020–2033
4.5.7. Canada Satcom Terminal Market Outlook, by Frequency Band, 2020–2033
4.5.8. Canada Satcom Terminal Market Outlook, by End Use, 2020–2033
5. Europe Satcom Terminal Market Outlook, 2020–2033
5.1. Europe Satcom Terminal Market Outlook, by Terminal Type, Value (US$ Billion), 2020–2033
5.1.1. Parabolic VSAT Antennas
5.1.2. Flat-Panel and Electronically Steered Array Antennas
5.1.3. Maritime Stabilised Antennas
5.1.4. Aeronautical Terminals
5.1.5. Land-Mobile and Communications-on-the-Move Terminals
5.1.6. Manpack and Tactical Terminals
5.2. Europe Satcom Terminal Market Outlook, by Component, Value (US$ Billion), 2020–2033
5.2.1. Antenna and Radome Assemblies
5.2.2. Modems and Baseband Equipment
5.2.3. Block Upconverters, Downconverters and Transceivers
5.2.4. Terminal Management Software and Services
5.3. Europe Satcom Terminal Market Outlook, by Frequency Band, Value (US$ Billion), 2020–2033
5.3.1. Ku-Band
5.3.2. Ka-Band
5.3.3. C-Band
5.3.4. X-Band and Military Ka-Band
5.3.5. V-Band and Q-Band
5.4. Europe Satcom Terminal Market Outlook, by End Use, Value (US$ Billion), 2020–2033
5.4.1. Consumer and Small-Business Broadband
5.4.2. Government and Defence
5.4.3. Commercial Maritime
5.4.4. Aviation and In-Flight Connectivity
5.4.5. Land Mobility and Enterprise
5.4.6. Energy and Mining
5.4.7. Broadcast Contribution
5.5. Europe Satcom Terminal Market Outlook, by Country, Value (US$ Billion), 2020–2033
5.5.1. United Kingdom Satcom Terminal Market Outlook, by Terminal Type, 2020–2033
5.5.2. United Kingdom Satcom Terminal Market Outlook, by Component, 2020–2033
5.5.3. United Kingdom Satcom Terminal Market Outlook, by Frequency Band, 2020–2033
5.5.4. United Kingdom Satcom Terminal Market Outlook, by End Use, 2020–2033
5.5.5. France Satcom Terminal Market Outlook, by Terminal Type, 2020–2033
5.5.6. France Satcom Terminal Market Outlook, by Component, 2020–2033
5.5.7. France Satcom Terminal Market Outlook, by Frequency Band, 2020–2033
5.5.8. France Satcom Terminal Market Outlook, by End Use, 2020–2033
5.5.9. Germany Satcom Terminal Market Outlook, by Terminal Type, 2020–2033
5.5.10. Germany Satcom Terminal Market Outlook, by Component, 2020–2033
5.5.11. Germany Satcom Terminal Market Outlook, by Frequency Band, 2020–2033
5.5.12. Germany Satcom Terminal Market Outlook, by End Use, 2020–2033
5.5.13. Italy Satcom Terminal Market Outlook, by Terminal Type, 2020–2033
5.5.14. Italy Satcom Terminal Market Outlook, by Component, 2020–2033
5.5.15. Italy Satcom Terminal Market Outlook, by Frequency Band, 2020–2033
5.5.16. Italy Satcom Terminal Market Outlook, by End Use, 2020–2033
5.5.17. Norway Satcom Terminal Market Outlook, by Terminal Type, 2020–2033
5.5.18. Norway Satcom Terminal Market Outlook, by Component, 2020–2033
5.5.19. Norway Satcom Terminal Market Outlook, by Frequency Band, 2020–2033
5.5.20. Norway Satcom Terminal Market Outlook, by End Use, 2020–2033
5.5.21. Spain Satcom Terminal Market Outlook, by Terminal Type, 2020–2033
5.5.22. Spain Satcom Terminal Market Outlook, by Component, 2020–2033
5.5.23. Spain Satcom Terminal Market Outlook, by Frequency Band, 2020–2033
5.5.24. Spain Satcom Terminal Market Outlook, by End Use, 2020–2033
6. Asia Pacific Satcom Terminal Market Outlook, 2020–2033
6.1. Asia Pacific Satcom Terminal Market Outlook, by Terminal Type, Value (US$ Billion), 2020–2033
6.1.1. Parabolic VSAT Antennas
6.1.2. Flat-Panel and Electronically Steered Array Antennas
6.1.3. Maritime Stabilised Antennas
6.1.4. Aeronautical Terminals
6.1.5. Land-Mobile and Communications-on-the-Move Terminals
6.1.6. Manpack and Tactical Terminals
6.2. Asia Pacific Satcom Terminal Market Outlook, by Component, Value (US$ Billion), 2020–2033
6.2.1. Antenna and Radome Assemblies
6.2.2. Modems and Baseband Equipment
6.2.3. Block Upconverters, Downconverters and Transceivers
6.2.4. Terminal Management Software and Services
6.3. Asia Pacific Satcom Terminal Market Outlook, by Frequency Band, Value (US$ Billion), 2020–2033
6.3.1. Ku-Band
6.3.2. Ka-Band
6.3.3. C-Band
6.3.4. X-Band and Military Ka-Band
6.3.5. V-Band and Q-Band
6.4. Asia Pacific Satcom Terminal Market Outlook, by End Use, Value (US$ Billion), 2020–2033
6.4.1. Consumer and Small-Business Broadband
6.4.2. Government and Defence
6.4.3. Commercial Maritime
6.4.4. Aviation and In-Flight Connectivity
6.4.5. Land Mobility and Enterprise
6.4.6. Energy and Mining
6.4.7. Broadcast Contribution
6.5. Asia Pacific Satcom Terminal Market Outlook, by Country, Value (US$ Billion), 2020–2033
6.5.1. China Satcom Terminal Market Outlook, by Terminal Type, 2020–2033
6.5.2. China Satcom Terminal Market Outlook, by Component, 2020–2033
6.5.3. China Satcom Terminal Market Outlook, by Frequency Band, 2020–2033
6.5.4. China Satcom Terminal Market Outlook, by End Use, 2020–2033
6.5.5. Japan Satcom Terminal Market Outlook, by Terminal Type, 2020–2033
6.5.6. Japan Satcom Terminal Market Outlook, by Component, 2020–2033
6.5.7. Japan Satcom Terminal Market Outlook, by Frequency Band, 2020–2033
6.5.8. Japan Satcom Terminal Market Outlook, by End Use, 2020–2033
6.5.9. India Satcom Terminal Market Outlook, by Terminal Type, 2020–2033
6.5.10. India Satcom Terminal Market Outlook, by Component, 2020–2033
6.5.11. India Satcom Terminal Market Outlook, by Frequency Band, 2020–2033
6.5.12. India Satcom Terminal Market Outlook, by End Use, 2020–2033
6.5.13. Korea Satcom Terminal Market Outlook, by Terminal Type, 2020–2033
6.5.14. Korea Satcom Terminal Market Outlook, by Component, 2020–2033
6.5.15. Korea Satcom Terminal Market Outlook, by Frequency Band, 2020–2033
6.5.16. Korea Satcom Terminal Market Outlook, by End Use, 2020–2033
6.5.17. Australia Satcom Terminal Market Outlook, by Terminal Type, 2020–2033
6.5.18. Australia Satcom Terminal Market Outlook, by Component, 2020–2033
6.5.19. Australia Satcom Terminal Market Outlook, by Frequency Band, 2020–2033
6.5.20. Australia Satcom Terminal Market Outlook, by End Use, 2020–2033
6.5.21. Indonesia Satcom Terminal Market Outlook, by Terminal Type, 2020–2033
6.5.22. Indonesia Satcom Terminal Market Outlook, by Component, 2020–2033
6.5.23. Indonesia Satcom Terminal Market Outlook, by Frequency Band, 2020–2033
6.5.24. Indonesia Satcom Terminal Market Outlook, by End Use, 2020–2033
6.5.25. Philippines Satcom Terminal Market Outlook, by Terminal Type, 2020–2033
6.5.26. Philippines Satcom Terminal Market Outlook, by Component, 2020–2033
6.5.27. Philippines Satcom Terminal Market Outlook, by Frequency Band, 2020–2033
6.5.28. Philippines Satcom Terminal Market Outlook, by End Use, 2020–2033
7. Latin America Satcom Terminal Market Outlook, 2020–2033
7.1. Latin America Satcom Terminal Market Outlook, by Terminal Type, Value (US$ Billion), 2020–2033
7.1.1. Parabolic VSAT Antennas
7.1.2. Flat-Panel and Electronically Steered Array Antennas
7.1.3. Maritime Stabilised Antennas
7.1.4. Aeronautical Terminals
7.1.5. Land-Mobile and Communications-on-the-Move Terminals
7.1.6. Manpack and Tactical Terminals
7.2. Latin America Satcom Terminal Market Outlook, by Component, Value (US$ Billion), 2020–2033
7.2.1. Antenna and Radome Assemblies
7.2.2. Modems and Baseband Equipment
7.2.3. Block Upconverters, Downconverters and Transceivers
7.2.4. Terminal Management Software and Services
7.3. Latin America Satcom Terminal Market Outlook, by Frequency Band, Value (US$ Billion), 2020–2033
7.3.1. Ku-Band
7.3.2. Ka-Band
7.3.3. C-Band
7.3.4. X-Band and Military Ka-Band
7.3.5. V-Band and Q-Band
7.4. Latin America Satcom Terminal Market Outlook, by End Use, Value (US$ Billion), 2020–2033
7.4.1. Consumer and Small-Business Broadband
7.4.2. Government and Defence
7.4.3. Commercial Maritime
7.4.4. Aviation and In-Flight Connectivity
7.4.5. Land Mobility and Enterprise
7.4.6. Energy and Mining
7.4.7. Broadcast Contribution
7.5. Latin America Satcom Terminal Market Outlook, by Country, Value (US$ Billion), 2020–2033
7.5.1. Brazil Satcom Terminal Market Outlook, by Terminal Type, 2020–2033
7.5.2. Brazil Satcom Terminal Market Outlook, by Component, 2020–2033
7.5.3. Brazil Satcom Terminal Market Outlook, by Frequency Band, 2020–2033
7.5.4. Brazil Satcom Terminal Market Outlook, by End Use, 2020–2033
7.5.5. Mexico Satcom Terminal Market Outlook, by Terminal Type, 2020–2033
7.5.6. Mexico Satcom Terminal Market Outlook, by Component, 2020–2033
7.5.7. Mexico Satcom Terminal Market Outlook, by Frequency Band, 2020–2033
7.5.8. Mexico Satcom Terminal Market Outlook, by End Use, 2020–2033
7.5.9. Chile Satcom Terminal Market Outlook, by Terminal Type, 2020–2033
7.5.10. Chile Satcom Terminal Market Outlook, by Component, 2020–2033
7.5.11. Chile Satcom Terminal Market Outlook, by Frequency Band, 2020–2033
7.5.12. Chile Satcom Terminal Market Outlook, by End Use, 2020–2033
7.5.13. Colombia Satcom Terminal Market Outlook, by Terminal Type, 2020–2033
7.5.14. Colombia Satcom Terminal Market Outlook, by Component, 2020–2033
7.5.15. Colombia Satcom Terminal Market Outlook, by Frequency Band, 2020–2033
7.5.16. Colombia Satcom Terminal Market Outlook, by End Use, 2020–2033
7.5.17. Argentina Satcom Terminal Market Outlook, by Terminal Type, 2020–2033
7.5.18. Argentina Satcom Terminal Market Outlook, by Component, 2020–2033
7.5.19. Argentina Satcom Terminal Market Outlook, by Frequency Band, 2020–2033
7.5.20. Argentina Satcom Terminal Market Outlook, by End Use, 2020–2033
7.5.21. Peru Satcom Terminal Market Outlook, by Terminal Type, 2020–2033
7.5.22. Peru Satcom Terminal Market Outlook, by Component, 2020–2033
7.5.23. Peru Satcom Terminal Market Outlook, by Frequency Band, 2020–2033
7.5.24. Peru Satcom Terminal Market Outlook, by End Use, 2020–2033
8. Middle East & Africa Satcom Terminal Market Outlook, 2020–2033
8.1. Middle East & Africa Satcom Terminal Market Outlook, by Terminal Type, Value (US$ Billion), 2020–2033
8.1.1. Parabolic VSAT Antennas
8.1.2. Flat-Panel and Electronically Steered Array Antennas
8.1.3. Maritime Stabilised Antennas
8.1.4. Aeronautical Terminals
8.1.5. Land-Mobile and Communications-on-the-Move Terminals
8.1.6. Manpack and Tactical Terminals
8.2. Middle East & Africa Satcom Terminal Market Outlook, by Component, Value (US$ Billion), 2020–2033
8.2.1. Antenna and Radome Assemblies
8.2.2. Modems and Baseband Equipment
8.2.3. Block Upconverters, Downconverters and Transceivers
8.2.4. Terminal Management Software and Services
8.3. Middle East & Africa Satcom Terminal Market Outlook, by Frequency Band, Value (US$ Billion), 2020–2033
8.3.1. Ku-Band
8.3.2. Ka-Band
8.3.3. C-Band
8.3.4. X-Band and Military Ka-Band
8.3.5. V-Band and Q-Band
8.4. Middle East & Africa Satcom Terminal Market Outlook, by End Use, Value (US$ Billion), 2020–2033
8.4.1. Consumer and Small-Business Broadband
8.4.2. Government and Defence
8.4.3. Commercial Maritime
8.4.4. Aviation and In-Flight Connectivity
8.4.5. Land Mobility and Enterprise
8.4.6. Energy and Mining
8.4.7. Broadcast Contribution
8.5. Middle East & Africa Satcom Terminal Market Outlook, by Country, Value (US$ Billion), 2020–2033
8.5.1. Saudi Arabia Satcom Terminal Market Outlook, by Terminal Type, 2020–2033
8.5.2. Saudi Arabia Satcom Terminal Market Outlook, by Component, 2020–2033
8.5.3. Saudi Arabia Satcom Terminal Market Outlook, by Frequency Band, 2020–2033
8.5.4. Saudi Arabia Satcom Terminal Market Outlook, by End Use, 2020–2033
8.5.5. United Arab Emirates Satcom Terminal Market Outlook, by Terminal Type, 2020–2033
8.5.6. United Arab Emirates Satcom Terminal Market Outlook, by Component, 2020–2033
8.5.7. United Arab Emirates Satcom Terminal Market Outlook, by Frequency Band, 2020–2033
8.5.8. United Arab Emirates Satcom Terminal Market Outlook, by End Use, 2020–2033
8.5.9. Israel Satcom Terminal Market Outlook, by Terminal Type, 2020–2033
8.5.10. Israel Satcom Terminal Market Outlook, by Component, 2020–2033
8.5.11. Israel Satcom Terminal Market Outlook, by Frequency Band, 2020–2033
8.5.12. Israel Satcom Terminal Market Outlook, by End Use, 2020–2033
8.5.13. Egypt Satcom Terminal Market Outlook, by Terminal Type, 2020–2033
8.5.14. Egypt Satcom Terminal Market Outlook, by Component, 2020–2033
8.5.15. Egypt Satcom Terminal Market Outlook, by Frequency Band, 2020–2033
8.5.16. Egypt Satcom Terminal Market Outlook, by End Use, 2020–2033
8.5.17. Nigeria Satcom Terminal Market Outlook, by Terminal Type, 2020–2033
8.5.18. Nigeria Satcom Terminal Market Outlook, by Component, 2020–2033
8.5.19. Nigeria Satcom Terminal Market Outlook, by Frequency Band, 2020–2033
8.5.20. Nigeria Satcom Terminal Market Outlook, by End Use, 2020–2033
8.5.21. Kenya Satcom Terminal Market Outlook, by Terminal Type, 2020–2033
8.5.22. Kenya Satcom Terminal Market Outlook, by Component, 2020–2033
8.5.23. Kenya Satcom Terminal Market Outlook, by Frequency Band, 2020–2033
8.5.24. Kenya Satcom Terminal Market Outlook, by End Use, 2020–2033
8.5.25. South Africa Satcom Terminal Market Outlook, by Terminal Type, 2020–2033
8.5.26. South Africa Satcom Terminal Market Outlook, by Component, 2020–2033
8.5.27. South Africa Satcom Terminal Market Outlook, by Frequency Band, 2020–2033
8.5.28. South Africa Satcom Terminal Market Outlook, by End Use, 2020–2033
9. Competitive Landscape
9.1. Market Concentration and Industry Leaders
9.2. Competitive Differentiation
9.3. Strategic Moves and Market Direction
9.4. Recent Industry Developments
9.5. Company Profiles
9.5.1. Viasat, Inc.
9.5.2. Hughes Network Systems, LLC
9.5.3. Gilat Satellite Networks Ltd.
9.5.4. ST Engineering iDirect
9.5.5. Comtech Telecommunications Corp.
9.5.6. Kymeta Corporation
9.5.7. Intellian Technologies, Inc.
9.5.8. Cobham Satcom
9.5.9. KVH Industries, Inc.
9.5.10. Thales Group
9.5.11. L3Harris Technologies, Inc.
9.5.12. General Dynamics Mission Systems
9.5.13. Honeywell International Inc.
9.5.14. Communications & Power Industries LLC
10. Appendix
10.1. Research Methodology
10.2. Report Assumptions
10.3. Acronyms and Abbreviations
| Terminal Type | Parabolic VSAT Antennas, Flat-Panel and Electronically Steered Array Antennas, Maritime Stabilised Antennas, Aeronautical Terminals, Land-Mobile and Communications-on-the-Move Terminals, Manpack and Tactical Terminals |
| Component | Antenna and Radome Assemblies, Modems and Baseband Equipment, Block Upconverters, Downconverters and Transceivers, Terminal Management Software and Services |
| Frequency Band | Ku-Band, Ka-Band, C-Band, X-Band and Military Ka-Band, V-Band and Q-Band |
| End Use | Consumer and Small-Business Broadband, Government and Defence, Commercial Maritime, Aviation and In-Flight Connectivity, Land Mobility and Enterprise, Energy and Mining, Broadcast Contribution |
| Regions | North America, Europe, Asia Pacific, Latin America, Middle East & Africa |
Our Research Methodology
Considering the volatility of business today, traditional approaches to strategizing a game plan can be unfruitful if not detrimental. True ambiguity is no way to determine a forecast. A myriad of predetermined factors must be accounted for such as the degree of risk involved, the magnitude of circumstances, as well as conditions or consequences that are not known or unpredictable. To circumvent binary views that cast uncertainty, the application of market research intelligence to strategically posture, move, and enable actionable outcomes is necessary.
View Methodology
Quality Assured
Rigorous Validation Process

Confidentiality Assured
End-to-end Data Security

Custom Research Services
Tailored To Your Objectives
FAQs
The global satcom terminal market is valued at US$ 8.6 billion in 2026, covering antennas, modems, radio-frequency electronics and terminal management software worldwide.
The market is projected to reach US$ 20.6 billion by 2033, growing at a 13.3% CAGR and adding an absolute opportunity of US$ 12.0 billion.
Parabolic VSAT antennas lead with 31.4% share in 2026, supported by a large installed base in broadcast, enterprise backhaul and fixed government sites.
Flat-panel and electronically steered array antennas grow fastest at a 21.4% CAGR, because tracking non-geostationary satellites requires electronic rather than mechanical beam steering.
North America leads with 38.4% share in 2026, reflecting defence procurement scale, supplier concentration and the earliest mass adoption of low Earth orbit broadband.
Related Reports
Non-Dispersive Infrared Market Size, Share, Insights, Competitive Landscape, and Forecast 2026 to 2033
The non-dispersive infrared market is projected to grow from US$1.6 billion in 2026 to US$2.7 billion by 2033, at a 7.8% CAGR. Explore segments and trends.
5G Edge Computing Market Size, Share, Insights, Competitive Landscape, and Forecast 2026 to 2033
The global 5G edge computing market is valued at US$10.45 billion in 2026, reaching US$161.37 billion by 2033, growing at a 47.8% CAGR
Aerial Imaging Market Size, Share, Insights, Competitive Landscape, and Forecast 2026 to 2033
The global aerial imaging market is valued at US$3.83 billion in 2026, reaching US$8.13 billion by 2033, growing at an 11.4% CAGR
Wearable Cameras Market Size, Share, Insights, Competitive Landscape, and Forecast 2026 to 2033
The global wearable cameras market is valued at US$8.80 billion in 2026, reaching US$20.80 billion by 2033, growing at a 13.1% CAGR
Spend Analytics Market Size, Share, Insights, Competitive Landscape, and Forecast 2026 to 2033
The global spend analytics market is valued at US$3.90 billion in 2026, reaching US$10.40 billion by 2033, growing at a 15.0% CAGR
IoT Security Market Size, Share, Insights, Competitive Landscape, and Forecast 2026 to 2033
The global IoT security market is valued at US$21.40 billion in 2026, reaching US$66.60 billion by 2033, growing at a 17.6% CAGR