



Polyurethane Elastomers Market
Polyurethane Elastomers Market Size, Share, Insights, Competitive Landscape, and Forecast 2026 to 2033
Polyurethane Elastomers Market Size and Trend Analysis
How Fast Will Polyurethane Elastomers Demand Grow?
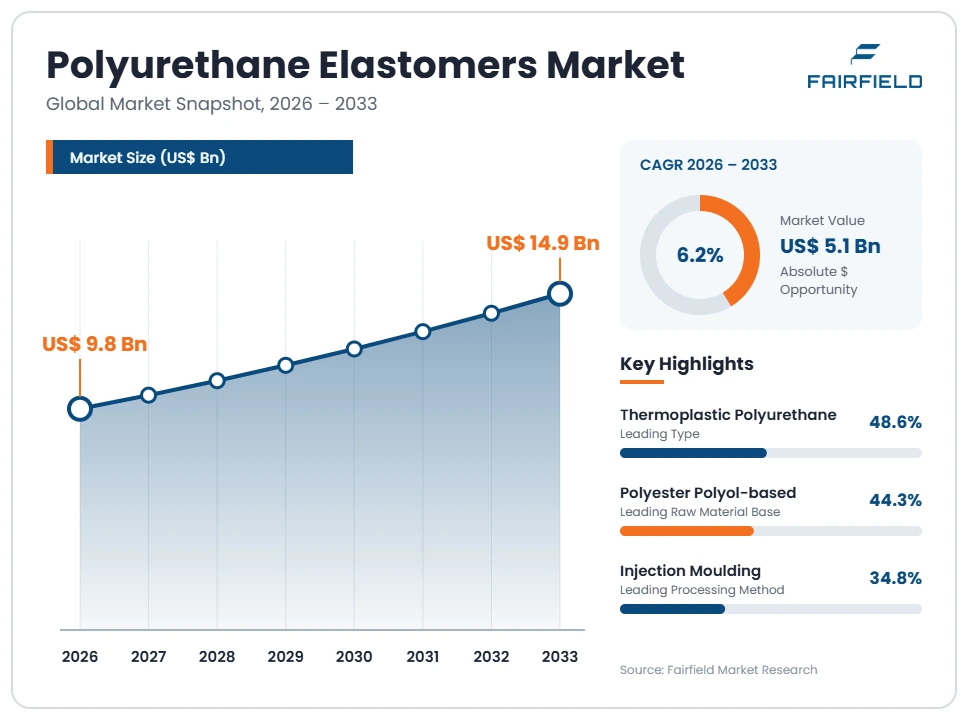
The global Polyurethane Elastomers market size is expected to be valued at US$ 9.8 billion in 2026 and projected to reach US$ 14.9 billion by 2033, growing at a CAGR of 6.2% between 2026 and 2033. Growth rests on a rare mix of abrasion resistance, load-bearing strength and elasticity that lets the material replace rubber and metal in hard-working parts. Automotive components, performance footwear, mining and material-handling equipment, and medical tubing form the largest demand pools. The market grew at a 4.8% CAGR between 2020 and 2025, restrained by isocyanate feedstock swings. Quicker growth ahead reflects wider thermoplastic polyurethane use, bio-based polyol commercialisation and a US$ 5.1 billion absolute dollar opportunity.
Key Report Takeaways
- By Type: Thermoplastic polyurethane led with 48.6% share in 2026, while cast polyurethane elastomers are projected to expand at a 7.1% CAGR through 2033, driven by the replacement of natural rubber in mining screens and heavy-duty wheels.
- By End-use Industry: Automotive and transportation led with 26.4% share in 2026, while medical and healthcare is projected to grow at an 8.0% CAGR through 2033, driven by single-use catheters and wound-care films moving to solvent-free polyurethane grades.
- By Processing Method: Injection moulding led with 34.8% share in 2026, while additive manufacturing is projected to advance at an 11.4% CAGR through 2033, driven by powder-bed and filament printing of custom orthotics, midsoles and short-run industrial parts.
- By Raw Material Base: Polyester polyol grades led with 44.3% share in 2026, while bio-based and partially renewable polyols are projected to rise at a 9.7% CAGR through 2033, driven by brand-owner recycled and renewable content targets in footwear and automotive interiors.
- By Region: Asia Pacific led with 44.8% share in 2026, ahead of Europe, North America and Latin America, while Middle East & Africa is projected to grow fastest at a 7.6% CAGR, driven by mining fleet refurbishment and pipeline maintenance work.
Global Polyurethane Elastomers Market Trends and Insights
Market Growth Drivers
Vehicle Lightweighting and Longer Component Service Life
Automotive demand is the single largest pull on polyurethane elastomer volumes. Carmakers swap rubber, metal and plasticised PVC out of bushings, anti-vibration mounts, seals, cable jacketing and interior skins because polyurethane carries the same load at lower weight. Lighter parts help combustion fleets meet emission limits and help battery electric platforms protect driving range. Electric drivetrains also raise the value of noise, vibration and harshness control, a job that cast and thermoplastic grades handle well at thin wall sections.
A steady change in vehicle engineering sits underneath this shift. Battery enclosures, charging cables and thermal management lines need materials that resist heat, oils and abrasion across long service lives. Thermoplastic polyurethane meets those conditions while staying easy to extrude and mould, so suppliers can combine several parts into one. Interior programmes also specify solvent-free skins to cut cabin emissions.
Performance Footwear and Athletic Midsole Innovation
Footwear is the second engine of volume growth, and it rewards material performance rather than price alone. Brand owners use expanded and cast polyurethane in midsoles, outsoles and uppers because the material returns energy, resists compression set and survives repeated flexing. A midsole that keeps its height after long use protects brand reputation, so formulators are paid for durability. Polyurethane also bonds well to textiles and films, which supports the seamless, knitted upper designs that dominate current running and training ranges.
Production economics reinforce the trend. Direct injection and expanded bead moulding cut adhesive use, trim scrap and shorten cycle times against older rubber routes. Large manufacturing clusters in Vietnam, Indonesia, India and China have installed this equipment at scale. Lifestyle and work footwear now borrow the same chassis designs, which spreads polyurethane into higher unit volumes.
Market Restraints
Isocyanate and Polyol Feedstock Price Volatility
Raw material volatility is the clearest brake on market value and on margin stability across the chain. Polyurethane elastomers depend on MDI, TDI and polyether or polyester polyols, all of which trace back to crude oil, natural gas and chlorine economics. When propylene oxide or benzene costs move sharply, elastomer producers cannot pass the change through quickly, because automotive and footwear contracts are often fixed for a season. Converters respond by holding thinner inventory, delaying trials and keeping cheaper rubber options alive for price-sensitive parts.
Supply concentration deepens the problem. A limited number of world-scale isocyanate plants serve global demand, so a single unplanned outage, turnaround or logistics disruption tightens availability across several regions at once. Buyers answer with dual sourcing, index-linked contracts and regional stock cover, all of which add working capital and slow new product adoption.
Regulatory Pressure on Diisocyanate Handling and Worker Exposure
Tighter control of diisocyanates raises the cost of entry and slows capacity additions at smaller processors. Under REACH and comparable national chemical frameworks, industrial and professional users of diisocyanates must complete documented training before handling these substances, and workplaces must show exposure controls. Cast elastomer shops that mix and pour on site carry the heaviest burden, since they handle liquid prepolymers directly. Compliance spending on ventilation, monitoring and record keeping competes with investment in new moulds and capacity.
The effect reaches product design as well. Customers in medical, food contact and consumer applications ask for low free-monomer prepolymers, documented migration data and full substance declarations. Suppliers that cannot provide this paperwork lose access to regulated accounts. Smaller regional compounders often exit demanding segments instead, which concentrates supply toward larger producers.
Market Opportunities
Bio-based and Mass-balance Polyurethane Elastomer Grades
Renewable-content grades open a premium revenue pool that barely existed a decade ago. Brand owners in footwear, automotive interiors and consumer goods now set public targets for recycled and bio-based content, and they need drop-in materials that meet existing specifications. Polyols made from castor oil, recycled polyester streams and certified mass-balance feedstocks let producers offer that content without forcing customers to requalify tooling. Buyers accept a price premium when the certificate supports a product claim, which lifts blended margins across the elastomer portfolio.
Capability is building on the supply side. Producers have extended mass-balance certification across polyol and isocyanate assets, so documented renewable attribution can follow the molecule into finished elastomer grades. Chemical recycling routes that recover polyols from end-of-life foam and elastomer scrap add a second feedstock path. Both routes suit regulated European and North American accounts first.
Additive Manufacturing and Mechanical Recycling of Thermoplastic Polyurethane
Printing and recycling together create new revenue outside traditional moulded parts. Thermoplastic polyurethane prints well as powder and filament, and it holds the flexibility that rigid printing resins lack. That combination supports lattice midsoles, custom orthotics, prosthetic liners, gaskets and short-run industrial components that injection tooling cannot justify. Because printing needs no mould, suppliers can sell qualified material grades into small-batch and personalised production, where value per kilogram runs far above commodity extrusion work.
Recycling strengthens the same commercial position. Thermoplastic grades can be reground and recompounded, so converters recover sprues, skeletal scrap and returned parts into second-life products. Equipment makers now supply sorting, washing and compounding lines sized for elastomer streams. Producers that pair printable grades with structured take-back and recompounding services create switching costs that pure resin sellers cannot match.
Segment Analysis
- Why Does Thermoplastic Polyurethane Lead the Polyurethane Elastomers Market?
Thermoplastic polyurethane leads because it can be melt processed on standard plastics equipment, taking 48.6% share in 2026. Converters extrude, injection mould and blow mould it without the mixing, pouring and curing cycles that thermoset routes demand, which lowers cost per part at volume. Scrap can be reground, and finished parts keep elasticity across a wide hardness window. Cast polyurethane elastomers, holding the second position, are the fastest-growing type at a 7.1% CAGR through 2033, because poured parts reach thicker sections and higher load capacity than melt processing allows. Mining screens, conveyor rollers, pipeline pigs and heavy-duty wheels rely on that bulk toughness. The split matters for strategy: melt-processable grades carry volume growth in consumer and automotive parts, while cast grades defend high-margin industrial replacement demand that is tied to equipment uptime rather than unit price.
- Automotive Holds the Largest End-use Share While Medical Grows Fastest
Automotive and transportation remains the largest end-use industry with 26.4% share in 2026, because a single vehicle carries polyurethane elastomers in dozens of places. Seals, bushings, bump stops, cable sheathing, instrument panel skins and battery pack components all draw on the same material family, and model volumes are large and predictable. Footwear and industrial machinery follow, each supported by abrasion-driven replacement cycles. Medical and healthcare is the fastest-growing end use at an 8.0% CAGR through 2033, as catheters, tubing sets, wound dressings and wearable device components shift from PVC and silicone toward polyurethane for kink resistance and biocompatibility. Medical volumes stay small against automotive, but they command documentation, purity and traceability that few suppliers can deliver. Producers serving both ends balance steady industrial tonnage against specialised grades that earn higher value per kilogram.
- Which Processing Method Is Gaining Share Fastest?
Additive manufacturing is gaining share fastest among processing methods, at an 11.4% CAGR through 2033, though injection moulding still leads with 34.8% share in 2026. Injection moulding holds its position because it delivers precise, repeatable parts at high cycle rates, which suits automotive and appliance programmes. Extrusion and open casting follow, serving tubing, film, sheet and large poured industrial items. Printing grows from a small base because it removes tooling entirely, letting manufacturers make lattice midsoles, patient-specific orthotics, prosthetic liners and short-run industrial parts economically. Powder-bed fusion and filament extrusion both now have qualified polyurethane grades with consistent melt behaviour. For producers, the shift changes how material is sold: printed applications need tight particle or filament specification, print parameter support and application engineering, which moves the supplier relationship from tonnage supply toward technical partnership.
- Polyester Polyols Dominate While Bio-based Feedstocks Accelerate
Polyester polyol-based grades lead the raw material mix with 44.3% share in 2026, because they deliver the mechanical strength, oil resistance and abrasion performance that industrial and automotive parts require. Polyether polyol grades hold the next position, preferred where hydrolysis resistance and low-temperature flexibility matter, such as in footwear and outdoor equipment. Polycaprolactone grades serve demanding applications that need both properties together. Bio-based and partially renewable polyols are the fastest-growing base at a 9.7% CAGR through 2033, supported by castor-derived chemistry, recycled polyester streams and certified mass-balance feedstocks. Growth here is pulled by customer procurement policy rather than by technical shortfall in existing grades. The practical result is a two-track portfolio: conventional polyols carry the cost-driven tonnage, while renewable grades protect access to brand-owner accounts that now screen suppliers on documented content.
Geography Analysis
- North America Anchors Industrial, Medical and Specialty Demand
North America held 21.3% share in 2026 and is set to grow at a 5.2% CAGR through 2033. The United States contributes most of the volume, with Canada and Mexico adding automotive and appliance converting capacity. Demand leans toward higher-value grades rather than commodity tonnage: medical device manufacturing, oil and gas equipment, mining components and defence applications all specify certified polyurethane elastomers. Nearshoring of automotive and electronics assembly into Mexico has pulled compounding and moulding capacity closer to end customers. Regional producers compete on documentation, regulatory support and application engineering, because buyers in medical and aerospace accounts qualify suppliers on traceability. Established isocyanate and polyol production on the Gulf Coast gives converters reliable local feedstock access.
- Europe Competes on Compliance and Circular Material Design
Europe held 24.6% share in 2026 and is projected to grow at a 4.8% CAGR through 2033, the slowest of the five regions. Germany, Italy, France and Spain lead consumption through automotive, machinery and footwear manufacturing. Mature industrial output limits volume growth, so value comes from specification rather than tonnage. Chemical rules under REACH, end-of-life vehicle requirements and packaging and waste policy push converters toward low-emission, recyclable and renewable-content grades well ahead of other regions. Automotive interior and sealing programmes now carry documented material declarations as standard. High energy costs have pressured domestic chemical production economics, encouraging producers to focus European assets on specialty elastomer grades while sourcing commodity intermediates more widely.
- Which Region Is Leading the Polyurethane Elastomers Market?
Asia Pacific leads the Polyurethane Elastomers market with 44.8% share in 2026 and is growing at a 7.4% CAGR through 2033. China anchors the region through integrated isocyanate and polyol production, large automotive output and the world’s deepest converting base. Vietnam, Indonesia, India and Thailand supply most of the world’s athletic footwear, which consumes substantial elastomer volume. Japan and South Korea contribute specialty grades for electronics, medical devices and precision machinery. Leadership comes from co-location: feedstock plants, compounders, mould makers and assembly operations sit within short logistics distances, which compresses cost and lead times. Rising domestic vehicle ownership, infrastructure construction and consumer spending add demand that no longer depends on export orders.
- Latin America Builds on Footwear, Mining and Vehicle Assembly
Latin America held 5.4% share in 2026 and is projected to grow at a 6.0% CAGR through 2033. Brazil and Mexico account for most consumption, with Argentina, Colombia and Chile adding industrial demand. Brazilian footwear manufacturing is a long-established consumer of cast and expanded polyurethane, supported by domestic design and tooling capability. Mining operations across Chile, Peru and Brazil use polyurethane screens, liners and wheels that wear out and need regular replacement, which creates steady aftermarket volume. Vehicle assembly plants in Mexico draw elastomer grades for sealing and vibration control. Growth depends on local compounding capacity, since imported specialty grades carry freight and tariff costs that limit price-sensitive applications.
- Which Region Is Growing Fastest in the Polyurethane Elastomers Market?
Middle East & Africa is growing fastest in the Polyurethane Elastomers market, at a 7.6% CAGR through 2033, from 3.9% share in 2026. Saudi Arabia, the United Arab Emirates, South Africa and Egypt drive most of the increase. Gulf economic diversification programmes are adding downstream chemical conversion and manufacturing to existing hydrocarbon assets, which brings elastomer processing closer to feedstock. Oil and gas operators consume polyurethane pipeline pigs, seals and protective linings as maintenance activity rises. Mining across South Africa, Zambia and the Democratic Republic of the Congo uses abrasion-resistant screens and liners that need frequent replacement. Construction and infrastructure projects add demand for sealants, coatings and expansion joints.
Competitive Landscape
The Polyurethane Elastomers market is moderately concentrated upstream and fragmented downstream. A small group of integrated chemical producers controls isocyanate and polyol supply alongside branded elastomer portfolios, which gives them cost and reliability advantages that smaller players cannot copy. Below them sits a wide field of regional compounders, prepolymer houses and cast elastomer shops that compete on formulation skill, service speed and proximity to customers. Vertical integration has become the main dividing line, with integrated producers steadily extending into compounding to capture more value per tonne.
Competition runs on technical performance rather than price alone. Vendors differentiate on hardness range, abrasion and hydrolysis resistance, processing window, colour stability and the ability to certify grades for medical, food contact and flame-retardant uses. Sustainability has become a second competitive axis, with mass-balance certification, recycled-content grades and lower-emission chemistry now appearing in tender requirements. Specialist entrants focused on printable grades and recycled feedstocks matter because they reach applications that large portfolios have treated as marginal.
Strategic activity follows three themes. Producers are adding regional compounding and application development centres so customers can qualify grades locally, which shortens design cycles. They are extending certified renewable and recycled offerings across existing asset bases rather than building separate plants, which protects capital efficiency. They are also investing in application engineering for printing, electric vehicle components and medical devices, where early specification locks in long programme supply.
Competitive direction points toward suppliers that pair integrated feedstock access with documented sustainability credentials and deep application support, serving customers who now choose materials on total programme risk rather than resin price.
Industry Leaders
- BASF SE
- Covestro AG
- The Lubrizol Corporation
- Huntsman Corporation
- Wanhua Chemical Group Co., Ltd.
- LANXESS AG
- Mitsui Chemicals, Inc.
- Dow Inc.
Companies Covered in the Report
- BASF SE
- Covestro AG
- The Lubrizol Corporation
- Huntsman Corporation
- Wanhua Chemical Group Co., Ltd.
- LANXESS AG
- Mitsui Chemicals, Inc.
- Dow Inc.
- Tosoh Corporation
- Kuraray Co., Ltd.
- COIM Group
- Era Polymers Pty Ltd
- HEXPOL AB
- Trelleborg AB
- Avient Corporation
- Great Eastern Resins Industrial Co., Ltd.
Polyurethane Elastomers Market Report Scope
| Metric | Value |
| Study Period | 2020–2033 |
| Market Size 2026 | US$ 9.8 Billion |
| Market Size 2033 | US$ 14.9 Billion |
| CAGR 2026–2033 | 6.2% |
| Absolute Dollar Opportunity | US$ 5.1 Billion |
| Largest Market | Asia Pacific (44.8% share in 2026) |
| Fastest-Growing Market | Middle East & Africa (7.6% CAGR 2026–2033) |
| Market Concentration | Moderately Concentrated |
| Major Players | BASF SE, Covestro AG, The Lubrizol Corporation, Huntsman Corporation, Wanhua Chemical Group Co., Ltd. |
Polyurethane Elastomers Market Segmentation
- Executive Summary
- Polyurethane Elastomers Market Snapshot
- Future Projections
- Key Market Trends
- Regional Snapshot
- Market Overview
- Market Definition and Report Scope
- Historical Market Trends
- Market Dynamics
- Drivers
- Vehicle Lightweighting and Longer Component Service Life
- Performance Footwear and Athletic Midsole Innovation
- Restraints
- Isocyanate and Polyol Feedstock Price Volatility
- Regulatory Pressure on Diisocyanate Handling and Worker Exposure
- Market Opportunities
- Bio-based and Mass-balance Polyurethane Elastomer Grades
- Additive Manufacturing and Mechanical Recycling of Thermoplastic Polyurethane
- Drivers
- Global Polyurethane Elastomers Market Outlook, 2026–2033
- Global Polyurethane Elastomers Market Outlook, by Type, Value (US$ Billion), 2026–2033
- Thermoplastic Polyurethane (TPU)
- Cast Polyurethane Elastomers
- Millable Polyurethane Elastomers
- Other Grades, including spray and microcellular
- Global Polyurethane Elastomers Market Outlook, by End-use Industry, Value (US$ Billion), 2026–2033
- Automotive and Transportation
- Footwear
- Industrial Machinery
- Construction and Infrastructure
- Medical and Healthcare
- Other End Uses
- Global Polyurethane Elastomers Market Outlook, by Processing Method, Value (US$ Billion), 2026–2033
- Injection Moulding
- Extrusion
- Open Casting
- Compression Moulding
- Additive Manufacturing
- Global Polyurethane Elastomers Market Outlook, by Raw Material Base, Value (US$ Billion), 2026–2033
- Polyester Polyol-based
- Polyether Polyol-based
- Polycaprolactone-based
- Bio-based and Partially Renewable Polyols
- Global Polyurethane Elastomers Market Outlook, by Region, Value (US$ Billion), 2026–2033
- North America
- Europe
- Asia Pacific
- Latin America
- Middle East & Africa
- Global Polyurethane Elastomers Market Outlook, by Type, Value (US$ Billion), 2026–2033
- North America Polyurethane Elastomers Market Outlook, 2026–2033
- North America Polyurethane Elastomers Market Outlook, by Type, Value (US$ Billion), 2026–2033
- Thermoplastic Polyurethane (TPU)
- Cast Polyurethane Elastomers
- Millable Polyurethane Elastomers
- Other Grades, including spray and microcellular
- North America Polyurethane Elastomers Market Outlook, by End-use Industry, Value (US$ Billion), 2026–2033
- Automotive and Transportation
- Footwear
- Industrial Machinery
- Construction and Infrastructure
- Medical and Healthcare
- Other End Uses
- North America Polyurethane Elastomers Market Outlook, by Processing Method, Value (US$ Billion), 2026–2033
- Injection Moulding
- Extrusion
- Open Casting
- Compression Moulding
- Additive Manufacturing
- North America Polyurethane Elastomers Market Outlook, by Raw Material Base, Value (US$ Billion), 2026–2033
- Polyester Polyol-based
- Polyether Polyol-based
- Polycaprolactone-based
- Bio-based and Partially Renewable Polyols
- North America Polyurethane Elastomers Market Outlook, by Country, Value (US$ Billion), 2026–2033
- United States Polyurethane Elastomers Market Outlook, by Type, 2026–2033
- United States Polyurethane Elastomers Market Outlook, by End-use Industry, 2026–2033
- United States Polyurethane Elastomers Market Outlook, by Processing Method, 2026–2033
- United States Polyurethane Elastomers Market Outlook, by Raw Material Base, 2026–2033
- Canada Polyurethane Elastomers Market Outlook, by Type, 2026–2033
- Canada Polyurethane Elastomers Market Outlook, by End-use Industry, 2026–2033
- Canada Polyurethane Elastomers Market Outlook, by Processing Method, 2026–2033
- Canada Polyurethane Elastomers Market Outlook, by Raw Material Base, 2026–2033
- Mexico Polyurethane Elastomers Market Outlook, by Type, 2026–2033
- Mexico Polyurethane Elastomers Market Outlook, by End-use Industry, 2026–2033
- Mexico Polyurethane Elastomers Market Outlook, by Processing Method, 2026–2033
- Mexico Polyurethane Elastomers Market Outlook, by Raw Material Base, 2026–2033
- North America Polyurethane Elastomers Market Outlook, by Type, Value (US$ Billion), 2026–2033
- Europe Polyurethane Elastomers Market Outlook, 2026–2033
- Europe Polyurethane Elastomers Market Outlook, by Type, Value (US$ Billion), 2026–2033
- Thermoplastic Polyurethane (TPU)
- Cast Polyurethane Elastomers
- Millable Polyurethane Elastomers
- Other Grades, including spray and microcellular
- Europe Polyurethane Elastomers Market Outlook, by End-use Industry, Value (US$ Billion), 2026–2033
- Automotive and Transportation
- Footwear
- Industrial Machinery
- Construction and Infrastructure
- Medical and Healthcare
- Other End Uses
- Europe Polyurethane Elastomers Market Outlook, by Processing Method, Value (US$ Billion), 2026–2033
- Injection Moulding
- Extrusion
- Open Casting
- Compression Moulding
- Additive Manufacturing
- Europe Polyurethane Elastomers Market Outlook, by Raw Material Base, Value (US$ Billion), 2026–2033
- Polyester Polyol-based
- Polyether Polyol-based
- Polycaprolactone-based
- Bio-based and Partially Renewable Polyols
- Europe Polyurethane Elastomers Market Outlook, by Country, Value (US$ Billion), 2026–2033
- Germany Polyurethane Elastomers Market Outlook, by Type, 2026–2033
- Germany Polyurethane Elastomers Market Outlook, by End-use Industry, 2026–2033
- Germany Polyurethane Elastomers Market Outlook, by Processing Method, 2026–2033
- Germany Polyurethane Elastomers Market Outlook, by Raw Material Base, 2026–2033
- Italy Polyurethane Elastomers Market Outlook, by Type, 2026–2033
- Italy Polyurethane Elastomers Market Outlook, by End-use Industry, 2026–2033
- Italy Polyurethane Elastomers Market Outlook, by Processing Method, 2026–2033
- Italy Polyurethane Elastomers Market Outlook, by Raw Material Base, 2026–2033
- France Polyurethane Elastomers Market Outlook, by Type, 2026–2033
- France Polyurethane Elastomers Market Outlook, by End-use Industry, 2026–2033
- France Polyurethane Elastomers Market Outlook, by Processing Method, 2026–2033
- France Polyurethane Elastomers Market Outlook, by Raw Material Base, 2026–2033
- Spain Polyurethane Elastomers Market Outlook, by Type, 2026–2033
- Spain Polyurethane Elastomers Market Outlook, by End-use Industry, 2026–2033
- Spain Polyurethane Elastomers Market Outlook, by Processing Method, 2026–2033
- Spain Polyurethane Elastomers Market Outlook, by Raw Material Base, 2026–2033
- Europe Polyurethane Elastomers Market Outlook, by Type, Value (US$ Billion), 2026–2033
- Asia Pacific Polyurethane Elastomers Market Outlook, 2026–2033
- Asia Pacific Polyurethane Elastomers Market Outlook, by Type, Value (US$ Billion), 2026–2033
- Thermoplastic Polyurethane (TPU)
- Cast Polyurethane Elastomers
- Millable Polyurethane Elastomers
- Other Grades, including spray and microcellular
- Asia Pacific Polyurethane Elastomers Market Outlook, by End-use Industry, Value (US$ Billion), 2026–2033
- Automotive and Transportation
- Footwear
- Industrial Machinery
- Construction and Infrastructure
- Medical and Healthcare
- Other End Uses
- Asia Pacific Polyurethane Elastomers Market Outlook, by Processing Method, Value (US$ Billion), 2026–2033
- Injection Moulding
- Extrusion
- Open Casting
- Compression Moulding
- Additive Manufacturing
- Asia Pacific Polyurethane Elastomers Market Outlook, by Raw Material Base, Value (US$ Billion), 2026–2033
- Polyester Polyol-based
- Polyether Polyol-based
- Polycaprolactone-based
- Bio-based and Partially Renewable Polyols
- Asia Pacific Polyurethane Elastomers Market Outlook, by Country, Value (US$ Billion), 2026–2033
- China Polyurethane Elastomers Market Outlook, by Type, 2026–2033
- China Polyurethane Elastomers Market Outlook, by End-use Industry, 2026–2033
- China Polyurethane Elastomers Market Outlook, by Processing Method, 2026–2033
- China Polyurethane Elastomers Market Outlook, by Raw Material Base, 2026–2033
- Vietnam Polyurethane Elastomers Market Outlook, by Type, 2026–2033
- Vietnam Polyurethane Elastomers Market Outlook, by End-use Industry, 2026–2033
- Vietnam Polyurethane Elastomers Market Outlook, by Processing Method, 2026–2033
- Vietnam Polyurethane Elastomers Market Outlook, by Raw Material Base, 2026–2033
- Indonesia Polyurethane Elastomers Market Outlook, by Type, 2026–2033
- Indonesia Polyurethane Elastomers Market Outlook, by End-use Industry, 2026–2033
- Indonesia Polyurethane Elastomers Market Outlook, by Processing Method, 2026–2033
- Indonesia Polyurethane Elastomers Market Outlook, by Raw Material Base, 2026–2033
- India Polyurethane Elastomers Market Outlook, by Type, 2026–2033
- India Polyurethane Elastomers Market Outlook, by End-use Industry, 2026–2033
- India Polyurethane Elastomers Market Outlook, by Processing Method, 2026–2033
- India Polyurethane Elastomers Market Outlook, by Raw Material Base, 2026–2033
- Thailand Polyurethane Elastomers Market Outlook, by Type, 2026–2033
- Thailand Polyurethane Elastomers Market Outlook, by End-use Industry, 2026–2033
- Thailand Polyurethane Elastomers Market Outlook, by Processing Method, 2026–2033
- Thailand Polyurethane Elastomers Market Outlook, by Raw Material Base, 2026–2033
- Japan Polyurethane Elastomers Market Outlook, by Type, 2026–2033
- Japan Polyurethane Elastomers Market Outlook, by End-use Industry, 2026–2033
- Japan Polyurethane Elastomers Market Outlook, by Processing Method, 2026–2033
- Japan Polyurethane Elastomers Market Outlook, by Raw Material Base, 2026–2033
- South Korea Polyurethane Elastomers Market Outlook, by Type, 2026–2033
- South Korea Polyurethane Elastomers Market Outlook, by End-use Industry, 2026–2033
- South Korea Polyurethane Elastomers Market Outlook, by Processing Method, 2026–2033
- South Korea Polyurethane Elastomers Market Outlook, by Raw Material Base, 2026–2033
- Asia Pacific Polyurethane Elastomers Market Outlook, by Type, Value (US$ Billion), 2026–2033
- Latin America Polyurethane Elastomers Market Outlook, 2026–2033
- Latin America Polyurethane Elastomers Market Outlook, by Type, Value (US$ Billion), 2026–2033
- Thermoplastic Polyurethane (TPU)
- Cast Polyurethane Elastomers
- Millable Polyurethane Elastomers
- Other Grades, including spray and microcellular
- Latin America Polyurethane Elastomers Market Outlook, by End-use Industry, Value (US$ Billion), 2026–2033
- Automotive and Transportation
- Footwear
- Industrial Machinery
- Construction and Infrastructure
- Medical and Healthcare
- Other End Uses
- Latin America Polyurethane Elastomers Market Outlook, by Processing Method, Value (US$ Billion), 2026–2033
- Injection Moulding
- Extrusion
- Open Casting
- Compression Moulding
- Additive Manufacturing
- Latin America Polyurethane Elastomers Market Outlook, by Raw Material Base, Value (US$ Billion), 2026–2033
- Polyester Polyol-based
- Polyether Polyol-based
- Polycaprolactone-based
- Bio-based and Partially Renewable Polyols
- Latin America Polyurethane Elastomers Market Outlook, by Country, Value (US$ Billion), 2026–2033
- Brazil Polyurethane Elastomers Market Outlook, by Type, 2026–2033
- Brazil Polyurethane Elastomers Market Outlook, by End-use Industry, 2026–2033
- Brazil Polyurethane Elastomers Market Outlook, by Processing Method, 2026–2033
- Brazil Polyurethane Elastomers Market Outlook, by Raw Material Base, 2026–2033
- Mexico Polyurethane Elastomers Market Outlook, by Type, 2026–2033
- Mexico Polyurethane Elastomers Market Outlook, by End-use Industry, 2026–2033
- Mexico Polyurethane Elastomers Market Outlook, by Processing Method, 2026–2033
- Mexico Polyurethane Elastomers Market Outlook, by Raw Material Base, 2026–2033
- Argentina Polyurethane Elastomers Market Outlook, by Type, 2026–2033
- Argentina Polyurethane Elastomers Market Outlook, by End-use Industry, 2026–2033
- Argentina Polyurethane Elastomers Market Outlook, by Processing Method, 2026–2033
- Argentina Polyurethane Elastomers Market Outlook, by Raw Material Base, 2026–2033
- Colombia Polyurethane Elastomers Market Outlook, by Type, 2026–2033
- Colombia Polyurethane Elastomers Market Outlook, by End-use Industry, 2026–2033
- Colombia Polyurethane Elastomers Market Outlook, by Processing Method, 2026–2033
- Colombia Polyurethane Elastomers Market Outlook, by Raw Material Base, 2026–2033
- Chile Polyurethane Elastomers Market Outlook, by Type, 2026–2033
- Chile Polyurethane Elastomers Market Outlook, by End-use Industry, 2026–2033
- Chile Polyurethane Elastomers Market Outlook, by Processing Method, 2026–2033
- Chile Polyurethane Elastomers Market Outlook, by Raw Material Base, 2026–2033
- Peru Polyurethane Elastomers Market Outlook, by Type, 2026–2033
- Peru Polyurethane Elastomers Market Outlook, by End-use Industry, 2026–2033
- Peru Polyurethane Elastomers Market Outlook, by Processing Method, 2026–2033
- Peru Polyurethane Elastomers Market Outlook, by Raw Material Base, 2026–2033
- Latin America Polyurethane Elastomers Market Outlook, by Type, Value (US$ Billion), 2026–2033
- Middle East & Africa Polyurethane Elastomers Market Outlook, 2026–2033
- Middle East & Africa Polyurethane Elastomers Market Outlook, by Type, Value (US$ Billion), 2026–2033
- Thermoplastic Polyurethane (TPU)
- Cast Polyurethane Elastomers
- Millable Polyurethane Elastomers
- Other Grades, including spray and microcellular
- Middle East & Africa Polyurethane Elastomers Market Outlook, by End-use Industry, Value (US$ Billion), 2026–2033
- Automotive and Transportation
- Footwear
- Industrial Machinery
- Construction and Infrastructure
- Medical and Healthcare
- Other End Uses
- Middle East & Africa Polyurethane Elastomers Market Outlook, by Processing Method, Value (US$ Billion), 2026–2033
- Injection Moulding
- Extrusion
- Open Casting
- Compression Moulding
- Additive Manufacturing
- Middle East & Africa Polyurethane Elastomers Market Outlook, by Raw Material Base, Value (US$ Billion), 2026–2033
- Polyester Polyol-based
- Polyether Polyol-based
- Polycaprolactone-based
- Bio-based and Partially Renewable Polyols
- Middle East & Africa Polyurethane Elastomers Market Outlook, by Country, Value (US$ Billion), 2026–2033
- Saudi Arabia Polyurethane Elastomers Market Outlook, by Type, 2026–2033
- Saudi Arabia Polyurethane Elastomers Market Outlook, by End-use Industry, 2026–2033
- Saudi Arabia Polyurethane Elastomers Market Outlook, by Processing Method, 2026–2033
- Saudi Arabia Polyurethane Elastomers Market Outlook, by Raw Material Base, 2026–2033
- United Arab Emirates Polyurethane Elastomers Market Outlook, by Type, 2026–2033
- United Arab Emirates Polyurethane Elastomers Market Outlook, by End-use Industry, 2026–2033
- United Arab Emirates Polyurethane Elastomers Market Outlook, by Processing Method, 2026–2033
- United Arab Emirates Polyurethane Elastomers Market Outlook, by Raw Material Base, 2026–2033
- South Africa Polyurethane Elastomers Market Outlook, by Type, 2026–2033
- South Africa Polyurethane Elastomers Market Outlook, by End-use Industry, 2026–2033
- South Africa Polyurethane Elastomers Market Outlook, by Processing Method, 2026–2033
- South Africa Polyurethane Elastomers Market Outlook, by Raw Material Base, 2026–2033
- Egypt Polyurethane Elastomers Market Outlook, by Type, 2026–2033
- Egypt Polyurethane Elastomers Market Outlook, by End-use Industry, 2026–2033
- Egypt Polyurethane Elastomers Market Outlook, by Processing Method, 2026–2033
- Egypt Polyurethane Elastomers Market Outlook, by Raw Material Base, 2026–2033
- Middle East & Africa Polyurethane Elastomers Market Outlook, by Type, Value (US$ Billion), 2026–2033
- Competitive Landscape
- Industry Leaders
- Company Profiles
- BASF SE
- Covestro AG
- The Lubrizol Corporation
- Huntsman Corporation
- Wanhua Chemical Group Co., Ltd.
- LANXESS AG
- Mitsui Chemicals, Inc.
- Dow Inc.
- Tosoh Corporation
- Kuraray Co., Ltd.
- COIM Group
- Era Polymers Pty Ltd
- HEXPOL AB
- Trelleborg AB
- Avient Corporation
- Great Eastern Resins Industrial Co., Ltd.
- Appendix
- Research Methodology
- Report Assumptions
- Acronyms and Abbreviations
Type
- Thermoplastic Polyurethane (TPU)
- Cast Polyurethane Elastomers
- Millable Polyurethane Elastomers
- Other Grades, including spray and microcellular
End-use Industry
- Automotive and Transportation
- Footwear
- Industrial Machinery
- Construction and Infrastructure
- Medical and Healthcare
- Other End Uses
Processing Method
- Injection Moulding
- Extrusion
- Open Casting
- Compression Moulding
- Additive Manufacturing
Raw Material Base
- Polyester Polyol-based
- Polyether Polyol-based
- Polycaprolactone-based
- Bio-based and Partially Renewable Polyols
Region
- North America
- Europe
- Asia Pacific
- Latin America
- Middle East & Africa
Our Research Methodology
Considering the volatility of business today, traditional approaches to strategizing a game plan can be unfruitful if not detrimental. True ambiguity is no way to determine a forecast. A myriad of predetermined factors must be accounted for such as the degree of risk involved, the magnitude of circumstances, as well as conditions or consequences that are not known or unpredictable. To circumvent binary views that cast uncertainty, the application of market research intelligence to strategically posture, move, and enable actionable outcomes is necessary.
View Methodology
Quality Assured
Rigorous Validation Process

Confidentiality Assured
End-to-end Data Security

Custom Research Services
Tailored To Your Objectives
FAQs
The global Polyurethane Elastomers market is valued at US$ 9.8 billion in 2026 and is projected to reach US$ 14.9 billion by 2033.
Thermoplastic polyurethane holds the largest share at 48.6% in 2026, while cast polyurethane elastomers grow fastest at a 7.1% CAGR through 2033.
Asia Pacific leads with 44.8% share in 2026, while Middle East & Africa records the fastest growth at a 7.6% CAGR through 2033.
Principal suppliers include BASF SE, Covestro AG, The Lubrizol Corporation, Huntsman Corporation, Wanhua Chemical Group Co., Ltd., LANXESS AG and Dow Inc.
Related Reports
Medical Flexible Packaging Market Size, Share, Insights, Competitive Landscape, and Forecast 2026 to 2033
The global medical flexible packaging market is valued at US$33.27 billion in 2026, reaching US$47.66 billion by 2033, growing at a 5.3% CAGR
Green Composites Market Size, Share, Insights, Competitive Landscape, and Forecast 2026 to 2033
The global green composites market is valued at US$9.2 billion in 2026, reaching US$18.6 billion by 2033, growing at a 10.6% CAGR
Corrosion Protection Coatings Market Size, Share, Insights, Competitive Landscape, and Forecast 2026 to 2033
Explore the corrosion protection coatings market outlook for 2026–2033, including resin trends, application methods, regional demand, and key suppliers.
Coated Abrasives Market Size, Share, Insights, Competitive Landscape, and Forecast 2026 to 2033
The coated abrasives market is projected to grow from US$13.4 billion in 2026 to US$19.0 billion by 2033 at a 5.1% CAGR.
Aerosol Propellants Market Size, Share, Insights, Competitive Landscape, and Forecast 2026 to 2033
The aerosol propellants market is projected to grow from US$11.90 billion in 2026 to US$16.63 billion by 2033 at a 4.9% CAGR.
Marine Oligosaccharides Market Size, Share, Insights, Competitive Landscape, and Forecast 2026 to 2033
The marine oligosaccharides market is projected to grow from US$0.3 billion in 2026 to US$0.6 billion by 2033 at a 10.4% CAGR.