



Quick Service Restaurants Market
Quick Service Restaurants Market Size, Share, Insights, Competitive Landscape, and Forecast 2026 to 2033
Quick Service Restaurants Market Size and Trend Analysis
How Fast Will Quick Service Restaurant Sales Grow?
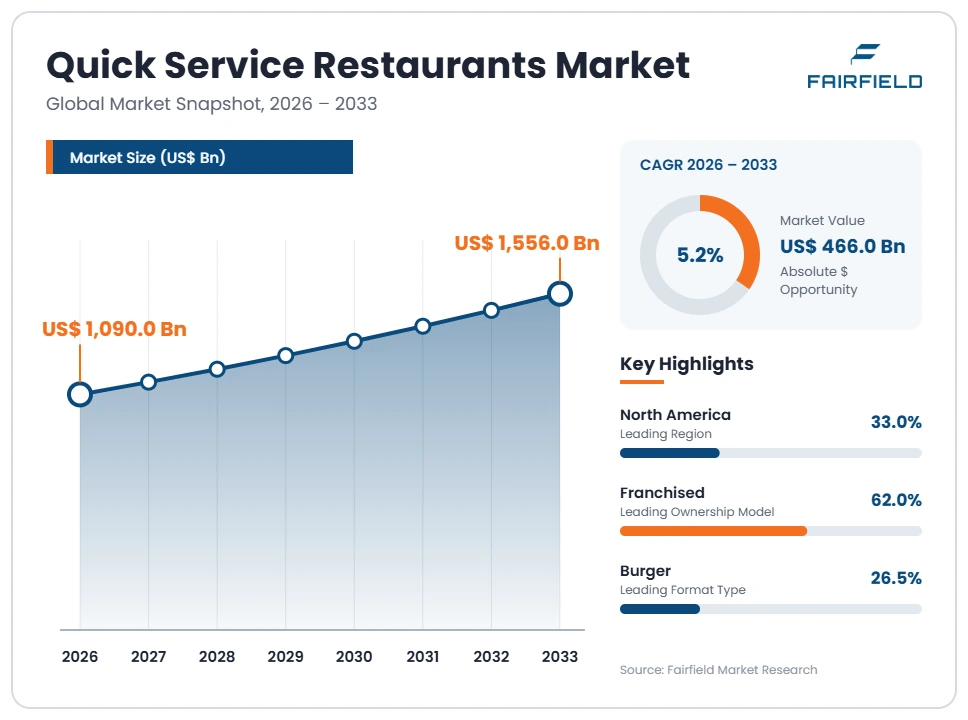
The global Quick Service Restaurants market size is expected to be valued at US$ 1,090.0 billion in 2026 and projected to reach US$ 1,556.0 billion by 2033, growing at a CAGR of 5.2% between 2026 and 2033.
All figures measure system-wide sales at the consumer level, not the reported revenue of franchisors, which is far smaller because franchised chains book only royalties, fees and rent. Sales grew at roughly 7.8% a year between 2020 and 2025, reaching about US$ 1,035.0 billion, though much of that reflected menu price inflation rather than extra visits. Three factors carry growth forward: new unit development in under-penetrated countries, higher throughput from drive-through and app-based ordering, and continued conversion of independent outlets into franchised brands. Pricing power is now limited, so the forecast assumes volume and unit count do more of the work than price increases did.
Key Report Takeaways
- By Format Type: Burger outlets held 26.5% of system sales in 2026, while chicken formats are projected to expand at a 6.8% CAGR through 2033, helped by lower input cost volatility and strong acceptance across very different national cuisines.
- By Ownership Model: Franchised units held 62.0% of system sales in 2026, while master-franchised operations are projected to expand at a 6.9% CAGR through 2033, as brands enter new countries through partners who already run local supply chains.
- By Channel: Drive-through accounted for 31.0% of sales in 2026, while digital ordering is projected to expand at a 9.2% CAGR through 2033, driven by app-based pre-ordering that raises average ticket and shortens service times.
- By Location Type: Standalone restaurants held 54.0% of sales in 2026, while convenience and forecourt sites are projected to expand at a 6.5% CAGR through 2033, because fuel retailers want food traffic and offer low-cost tenancy terms.
- By Geography: North America held 33.0% of system sales in 2026, while Asia Pacific is projected to expand at a 6.6% CAGR through 2033, supported by rising urban employment, delivery infrastructure and aggressive master franchise expansion.
Global Quick Service Restaurants Market Trends and Insights
Drivers Impact Analysis
Growth in this industry comes from two places: how many units franchisees choose to build, and how many transactions each unit can process.
| Driver | Impact on CAGR Forecast | Geographic Relevance | Impact Timeline |
| Franchised and master-franchised unit development in under-penetrated countries | High | Asia Pacific, Latin America, Middle East & Africa | Long term (≥4 years) |
| Drive-through, kiosk and app ordering raising transactions per store | High | North America and Europe | Short term (≤2 years) |
Franchised Unit Development Decides How Quickly System Sales Expand
This is a franchising and real estate business that sells food, and unit development is the main growth lever. The large chains are capital-light franchisors that earn royalties and rent on a store base built with franchisee money, so system sales rise mainly when franchisees sign new development agreements. Where franchise partners see acceptable returns, pipelines fill quickly and a brand can add hundreds of sites in a country within a few years.
The mechanism is the unit economic model presented to the franchisee. A development decision turns on build cost, rent, expected weekly sales and the fees charged against them. Brands that lower build cost through smaller formats, or lift sales per site through drive-through lanes and delivery, improve that calculation. Franchise disclosure rules in the United States and similar regimes elsewhere require these terms to be documented, which makes comparison between brands unusually transparent to operators.
Drive-Through and App Ordering Lift Transactions per Restaurant
Throughput improvements are the second growth engine, because they raise sales without adding a single building. A drive-through lane, an in-store kiosk or a mobile app lets one kitchen serve more customers in the same peak hour, and digital orders typically carry a higher average ticket than counter orders. For franchisors this is valuable in a different way: royalties scale with sales, so a throughput gain across thousands of existing restaurants costs the brand almost nothing to capture.
The change is operational and technical. Order-ahead applications move the ordering step away from the counter, kitchen display systems sequence production, and forecasting tools stage food before the queue builds. Dual drive-through lanes and separate pickup windows have become standard in new builds in the United States. Loyalty programmes attached to these applications also give the brand first-party customer data it cannot obtain from a third-party delivery platform.
Restraints Impact Analysis
Two constraints weigh on the industry, and both act through the economics of a single restaurant rather than through consumer demand.
| Restraint | Impact on CAGR Forecast | Geographic Relevance | Impact Timeline |
| Labour cost inflation and sector-specific wage legislation | High | North America and Europe | Short term (≤2 years) |
| Weak franchisee profitability constraining the development pipeline | High | Global | Medium term (2–4 years) |
Labour Cost Legislation Compresses Restaurant-Level Operating Margins
Labour is the largest controllable cost in a limited-service restaurant, and legislation has pushed it up faster than menu prices in several markets. Crew wages, scheduling rules and benefit obligations now consume a materially higher share of store sales than they did five years ago. Because franchisees absorb this cost while royalty and advertising fees stay fixed as a percentage of sales, the squeeze lands on the operator rather than the brand, and it shows up as slower reinvestment and shorter opening hours.
The cause is partly sector-specific regulation. Some jurisdictions set wage floors that apply to fast food chains above a defined size, and sectoral wage councils can revisit those floors periodically. Availability compounds cost, since high turnover in crew roles means continuous recruitment and training expense. Operators have responded with kiosks, simplified menus and tighter labour scheduling, but automation offsets only part of a structural increase in the hourly rate.
Weak Franchisee Profitability Slows the New-Unit Development Pipeline
When franchisee margins compress, development stops regardless of consumer demand, and this is the most important restraint on the industry. A franchisee who cannot clear an acceptable return on an existing restaurant will not sign for another, even where traffic is steady and the brand is popular. Because franchisors depend on partners to fund construction, a store-level profitability problem becomes a system-level growth problem within about two years, as pipelines empty and remodel programmes slip.
Several specific costs drive this. Construction and equipment costs for a new drive-through site have risen sharply, interest on development loans is higher than in the previous cycle, and rent escalations follow commercial property indices. Discounting adds to the strain: value menus and loyalty offers protect traffic but reduce the margin on each transaction. Franchisors have answered with remodel subsidies, royalty relief and development incentives, which transfers part of the burden back to the brand.
Market Opportunities
Two revenue pools remain genuinely underexploited, and both reduce dependence on the traditional full-size restaurant.
Smaller Formats and Delivery-Only Kitchens Open a Lower-Capital Expansion Pool
Smaller-footprint restaurants are the clearest way to restart unit growth where build costs have become prohibitive. Pickup-only stores, modular drive-through units, kiosks inside convenience and forecourt sites, and delivery-only kitchens cost a fraction of a conventional building and need far less land. Lower capital per site changes the return calculation for a franchisee, which allows brands to enter catchment areas that could never support a full restaurant and to add fill-in locations in dense cities.
Operators with strong digital order volume can capture this pool first, because these formats depend on orders arriving before the customer does. Demand comes from urban office districts, transport interchanges, universities and fuel retail sites where property owners want food traffic. Modular construction shortens build times to weeks, and landlords increasingly offer turnover-linked rents for small units, which lowers the fixed cost that makes marginal sites unviable for franchise partners.
First-Party Ordering and Loyalty Recapture Margin Lost to Aggregators
Shifting delivery orders onto first-party channels is the industry’s most valuable margin opportunity. Third-party aggregators charge commission that can consume most of the restaurant-level profit on an order, and they retain the customer relationship, so the chain pays repeatedly for access to its own demand. Moving even a modest share of that volume into a brand’s own application converts commission into retained margin and creates a direct marketing channel that costs little to use.
Chains with large installed app bases and dense store networks are positioned to take this, since both are required to deliver quickly without a platform. The demand comes from frequent customers who already order the same items and respond to personalised offers. Loyalty programmes supply the purchase history that makes those offers work, while white-label delivery providers let a brand hire couriers without surrendering the customer record or the order data.
Segment Analysis
- By Format Type: Burger Chains Lead the System While Chicken Formats Grow Faster
Burger restaurants generated 26.5% of global system sales in 2026, reflecting the earliest international expansion, the densest store networks and the most efficient drive-through operating models in the industry. Pizza, sandwich, Mexican, Asian and coffee and bakery quick-service formats share most of the remainder, with regional and ethnic fast food holding a large but fragmented position across several developing markets.
Chicken formats are expanding fastest at a 6.8% CAGR through 2033. Chicken travels well across cuisines and carries no religious dietary restriction in most markets, which makes it the easiest protein for a brand to take abroad. Input prices have also been less volatile than beef, protecting franchisee margins during a period of food cost inflation. The practical consequence is that burger-led groups are adding chicken brands and chicken menu lines rather than ceding the segment to specialists.
- By Ownership Model: Franchised Estates Dominate as Master Franchising Expands Quickest
Franchised restaurants produced 62.0% of system sales in 2026. The model lets a brand grow its store base with partner capital while earning royalties and, in many cases, rent on the underlying property, which is why most large chains have been selling company-operated restaurants to franchisees. Company-operated units remain useful for testing menu and equipment changes and for holding a presence in strategic cities.
Master-franchised operations are the fastest-growing ownership model at a 6.9% CAGR to 2033. Entering a new country through one large partner transfers the cost of supply chain construction, site selection and local hiring to a group that already runs restaurants in that market. Large regional operators in the Gulf, the Philippines and Mexico now hold rights to several international brands at once. This concentrates execution risk in fewer hands but accelerates the pace at which a brand reaches scale.
- By Channel: Drive-Through Carries the Volume While Digital Ordering Accelerates
Drive-through sales represented 31.0% of the market in 2026, the single largest channel. A drive-through lane serves peak demand with less floor space and fewer staff per transaction than counter service, and its share rose permanently after the pandemic altered customer habits. Dine-in, takeaway and delivery divide the balance, with dine-in weakest in markets where chains have shifted new builds toward pickup and drive-through formats.
Digital ordering is growing fastest at a 9.2% CAGR through 2033. Order-ahead applications raise average ticket size because customers browse longer and add items without queue pressure, and they let kitchens stage production before arrival. The strategic value is data: first-party ordering gives the brand purchase histories that aggregator platforms will not share. Chains are therefore pricing delivery differently across channels and reserving their strongest offers for their own applications.
- By Location Type: Standalone Sites Anchor Sales While Forecourt Units Rise Fastest
Standalone restaurants accounted for 54.0% of system sales in 2026. They support drive-through lanes, longer trading hours and dedicated parking, and they generate the highest weekly sales per site, which is why franchise development programmes still favour them where land is available. Mall and food court locations follow, though their share has fallen with footfall in older shopping centres, while travel and transport sites recovered strongly with passenger volumes.
Convenience and forecourt locations are expanding fastest at a 6.5% CAGR to 2033. Fuel retailers are rebuilding their economics around food and beverage as vehicle refuelling patterns change, and they offer chains cheap tenancy, existing utilities and guaranteed traffic. For quick service brands the attraction is a low-capital entry into catchments that cannot justify a full restaurant, usually through a limited menu run from a small kitchen footprint.
Geography Analysis
- Which Region Is Leading the Quick Service Restaurants Market?
North America is leading the quick service restaurants market with 33.0% of system sales in 2026, because the industry was built there and remains deeply embedded in daily routines. The United States holds the largest store base, the highest average unit volumes and the most developed drive-through infrastructure, with Canada and Mexico adding substantial franchised estates. Per-capita spending on limited-service meals is higher than anywhere else.
The region’s current dynamic is price. Several years of food and labour inflation were passed through to menus, and customers responded by cutting visit frequency or trading down, which pushed chains into value menus and loyalty discounting that protect traffic at the cost of margin. State-level wage legislation specific to fast food has raised the operating cost base. Growth now depends on throughput, remodels and smaller formats rather than on large increases in store count.
- Europe Operates Mature Estates Under Tight Promotion and Packaging Rules
Europe accounted for 22.0% of system sales in 2026, led by the United Kingdom, France, Germany, Spain and Poland. Store networks are mature in the west, so growth comes from remodelling, delivery and drive-through conversion rather than from large new-build programmes. Central and eastern countries remain the exception, where franchised chains continue to open at pace against a still-fragmented independent restaurant base.
Regulation shapes the operating model more here than elsewhere. Packaging rules adopted at European Union level set reuse and recyclability obligations that reach foodservice containers directly, while national measures restrict the advertising and promotion of certain products to children. Labour regulation and collective agreements raise employment costs and limit scheduling flexibility. Chains have responded with reusable serviceware trials, kiosk ordering to manage labour, and menu localisation that gives each country a distinct product range.
- Which Region Is Growing Fastest in the Quick Service Restaurants Market?
Asia Pacific is growing fastest in the quick service restaurants market, at a 6.6% CAGR between 2026 and 2033, from a 31.5% share in 2026. China, India, Indonesia, Japan, Vietnam and the Philippines supply the volume, driven by urban employment, young populations and a large base of independent outlets that organised chains can convert. Store counts in several of these countries are still low relative to population.
Delivery infrastructure is the regional differentiator. Dense cities, cheap last-mile logistics and near-universal mobile payment make delivery and digital ordering a larger share of sales than in western markets, and some brands design restaurants around it. Master franchise partners with existing retail and cold chain operations are executing most of this expansion. The constraints are real estate cost in tier-one cities, intense price competition from local chains, and wide variation in food safety enforcement between countries.
- Latin America Grows Through Large Master Franchise Operators
Latin America held 7.5% of global system sales in 2026, with Brazil and Mexico generating most of it, followed by Argentina, Chile, Colombia and Peru. The regional structure is distinctive: a small number of large listed operators hold the franchise rights to several international brands at once and run them across multiple countries, which gives the industry more purchasing scale than store counts alone would suggest.
Growth is supported by urbanisation, expanding shopping centre development and rapid adoption of delivery applications in major cities. The barriers are economic rather than regulatory. Currency volatility raises the local cost of imported equipment and ingredients, consumer spending is sensitive to inflation, and credit for franchise development is expensive. Operators have adapted by localising supply, running strong value platforms and favouring smaller formats that can be opened without large capital commitments.
- Middle East & Africa Builds Scale on Franchise Operators and Young Populations
Middle East & Africa represented 6.0% of system sales in 2026. Gulf states account for a disproportionate share, with Saudi Arabia and the United Arab Emirates supporting high per-capita restaurant spending, international brand density and a professional franchise operator base. Egypt, Morocco, Nigeria, Kenya and South Africa form the growth frontier, where young populations and urban migration create demand faster than organised supply can meet it.
Expansion depends on franchise partners who can manage supply chains across difficult logistics. Halal certification, local sourcing requirements and national workforce quotas shape operating models in the Gulf. Barriers elsewhere include unreliable power, limited cold chain, import duties on equipment and foreign exchange availability for royalty payments. The main opportunity is delivery-led entry into cities with poor retail property supply, letting a brand establish demand before committing to permanent sites.
Competitive Landscape
The quick service restaurants market is moderately concentrated at the top and highly fragmented beneath it. A handful of global franchisors control a large share of international system sales, yet independents and regional chains still take most of the world’s limited-service spending. Concentration is rising slowly as private equity and listed operators acquire regional brands and as master franchisees consolidate country rights. The structure is unusual because the brands that appear dominant own relatively few of the restaurants carrying their signs.
Competition rests on unit economics rather than on menus alone. Brands compete to attract and retain franchisees by offering build costs, supply chain pricing, marketing support and sales per restaurant that compare well against alternatives, since development capital flows to whichever system produces the better return. At the consumer level, the battlegrounds are price and convenience: value platforms, loyalty pricing, drive-through speed and app reliability. New entrants rarely challenge the majors head-on. They arrive as regional specialists in chicken or local cuisine, as fast-casual formats positioned above traditional fast food, or as delivery-native brands operating from shared kitchens with minimal capital.
Strategic activity across the industry has concentrated on refranchising company-operated estates, consolidating country franchise rights into larger operators, investing in digital ordering platforms and loyalty infrastructure, and rebuilding development programmes around smaller and cheaper store formats. Each of these shifts capital intensity away from the brand owner and toward partners while preserving royalty income.
Strategic direction is converging. Operators are protecting traffic with value offers, pushing customers into first-party channels, and designing new restaurants around off-premise demand rather than seating.
Recent Industry Developments
- April 2024: A statutory minimum wage of US$ 20 per hour took effect for large limited-service chains in California under state legislation that also created a sectoral council for the industry – it reset the labour cost base in the largest national restaurant market and accelerated menu price increases.
- February 2025: The European Union packaging and packaging waste regulation entered into force, with most obligations applying from 2026 – it sets recyclability, reuse and single-use restrictions that reach foodservice packaging directly and add compliance cost for every operator trading in the bloc.
- January 2026: Statutory restrictions on television and paid online advertising of products high in fat, salt or sugar took effect in the United Kingdom, following voluntary industry compliance from October 2025 – it removes a long-standing promotional channel for parts of the quick service menu.
Companies Covered in the Report
- McDonald’s Corporation
- Yum! Brands, Inc.
- Restaurant Brands International Inc.
- Starbucks Corporation
- Subway IP LLC
- Inspire Brands, Inc.
- Domino’s Pizza, Inc.
- Chick-fil-A, Inc.
- The Wendy’s Company
- Chipotle Mexican Grill, Inc.
- Jollibee Foods Corporation
- Yum China Holdings, Inc.
- Alsea, S.A.B. de C.V.
- Americana Restaurants International PLC
Quick Service Restaurants Market Report Scope
| Metric | Value |
| Study Period | 2020–2033 |
| Market Size 2026 | US$ 1090.0 Billion |
| Market Size 2033 | US$ 1556.0 Billion |
| CAGR 2026–2033 | 5.2% |
| Absolute Dollar Opportunity | US$ 466.0 Billion |
| Largest Market | North America |
| Fastest-Growing Market | Asia Pacific |
| Market Concentration | Medium |
| Major Players | McDonald’s Corporation, Yum! Brands, Inc., Restaurant Brands International Inc., Starbucks Corporation, Domino’s Pizza, Inc. |
Quick Service Restaurants Market Segmentation
Format Type
- Burger
- Chicken
- Pizza
- Sandwich
- Mexican
- Asian
- Coffee and Bakery Quick-Service
- Regional and Ethnic Fast Food
Ownership Model
- Company-Operated
- Franchised
- Master-Franchised
Channel
- Dine-In
- Drive-Through
- Takeaway
- Delivery
- Digital Ordering
Location Type
- Standalone
- Mall and Food Court
- Travel and Transport
- Convenience and Forecourt
Regions
- North America
- Europe
- Asia Pacific
- Latin America
- Middle East & Africa
- Executive Summary
- Global Quick Service Restaurants Market Snapshot
- Future Projections, 2026-2033
- Key Market Trends
- Regional Snapshot
- Market Overview
- Market Definition and Report Scope
- Historical Market Trends, 2020-2025
- Market Dynamics
- Drivers Impact Analysis
- Franchised Unit Development Decides How Quickly System Sales Expand
- Drive-Through and App Ordering Lift Transactions per Restaurant
- Restraints Impact Analysis
- Labour Cost Legislation Compresses Restaurant-Level Operating Margins
- Weak Franchisee Profitability Slows the New-Unit Development Pipeline
- Market Opportunities
- Smaller Formats and Delivery-Only Kitchens Open a Lower-Capital Expansion Pool
- First-Party Ordering and Loyalty Recapture Margin Lost to Aggregators
- Drivers Impact Analysis
- Global Quick Service Restaurants Market Outlook, 2020-2033
- Global Quick Service Restaurants Market Outlook, by Format Type, Value (US$ Billion), 2020-2033
- Burger
- Chicken
- Pizza
- Sandwich
- Mexican
- Asian
- Coffee and Bakery Quick-Service
- Regional and Ethnic Fast Food
- Global Quick Service Restaurants Market Outlook, by Ownership Model, Value (US$ Billion), 2020-2033
- Company-Operated
- Franchised
- Master-Franchised
- Global Quick Service Restaurants Market Outlook, by Channel, Value (US$ Billion), 2020-2033
- Dine-In
- Drive-Through
- Takeaway
- Delivery
- Digital Ordering
- Global Quick Service Restaurants Market Outlook, by Location Type, Value (US$ Billion), 2020-2033
- Standalone
- Mall and Food Court
- Travel and Transport
- Convenience and Forecourt
- Global Quick Service Restaurants Market Outlook, by Region, Value (US$ Billion), 2020-2033
- North America
- Europe
- Asia Pacific
- Latin America
- Middle East & Africa
- Global Quick Service Restaurants Market Outlook, by Format Type, Value (US$ Billion), 2020-2033
- North America Quick Service Restaurants Market Outlook, 2020-2033
- North America Quick Service Restaurants Market Outlook, by Format Type, Value (US$ Billion), 2020-2033
- Burger
- Chicken
- Pizza
- Sandwich
- Mexican
- Asian
- Coffee and Bakery Quick-Service
- Regional and Ethnic Fast Food
- North America Quick Service Restaurants Market Outlook, by Ownership Model, Value (US$ Billion), 2020-2033
- Company-Operated
- Franchised
- Master-Franchised
- North America Quick Service Restaurants Market Outlook, by Channel, Value (US$ Billion), 2020-2033
- Dine-In
- Drive-Through
- Takeaway
- Delivery
- Digital Ordering
- North America Quick Service Restaurants Market Outlook, by Location Type, Value (US$ Billion), 2020-2033
- Standalone
- Mall and Food Court
- Travel and Transport
- Convenience and Forecourt
- North America Quick Service Restaurants Market Outlook, by Country, Value (US$ Billion), 2020-2033
- United States Quick Service Restaurants Market Outlook, by Format Type, 2020-2033
- United States Quick Service Restaurants Market Outlook, by Ownership Model, 2020-2033
- United States Quick Service Restaurants Market Outlook, by Channel, 2020-2033
- United States Quick Service Restaurants Market Outlook, by Location Type, 2020-2033
- Canada Quick Service Restaurants Market Outlook, by Format Type, 2020-2033
- Canada Quick Service Restaurants Market Outlook, by Ownership Model, 2020-2033
- Canada Quick Service Restaurants Market Outlook, by Channel, 2020-2033
- Canada Quick Service Restaurants Market Outlook, by Location Type, 2020-2033
- Mexico Quick Service Restaurants Market Outlook, by Format Type, 2020-2033
- Mexico Quick Service Restaurants Market Outlook, by Ownership Model, 2020-2033
- Mexico Quick Service Restaurants Market Outlook, by Channel, 2020-2033
- Mexico Quick Service Restaurants Market Outlook, by Location Type, 2020-2033
- North America Quick Service Restaurants Market Outlook, by Format Type, Value (US$ Billion), 2020-2033
- Europe Quick Service Restaurants Market Outlook, 2020-2033
- Europe Quick Service Restaurants Market Outlook, by Format Type, Value (US$ Billion), 2020-2033
- Burger
- Chicken
- Pizza
- Sandwich
- Mexican
- Asian
- Coffee and Bakery Quick-Service
- Regional and Ethnic Fast Food
- Europe Quick Service Restaurants Market Outlook, by Ownership Model, Value (US$ Billion), 2020-2033
- Company-Operated
- Franchised
- Master-Franchised
- Europe Quick Service Restaurants Market Outlook, by Channel, Value (US$ Billion), 2020-2033
- Dine-In
- Drive-Through
- Takeaway
- Delivery
- Digital Ordering
- Europe Quick Service Restaurants Market Outlook, by Location Type, Value (US$ Billion), 2020-2033
- Standalone
- Mall and Food Court
- Travel and Transport
- Convenience and Forecourt
- Europe Quick Service Restaurants Market Outlook, by Country, Value (US$ Billion), 2020-2033
- United Kingdom Quick Service Restaurants Market Outlook, by Format Type, 2020-2033
- United Kingdom Quick Service Restaurants Market Outlook, by Ownership Model, 2020-2033
- United Kingdom Quick Service Restaurants Market Outlook, by Channel, 2020-2033
- United Kingdom Quick Service Restaurants Market Outlook, by Location Type, 2020-2033
- France Quick Service Restaurants Market Outlook, by Format Type, 2020-2033
- France Quick Service Restaurants Market Outlook, by Ownership Model, 2020-2033
- France Quick Service Restaurants Market Outlook, by Channel, 2020-2033
- France Quick Service Restaurants Market Outlook, by Location Type, 2020-2033
- Germany Quick Service Restaurants Market Outlook, by Format Type, 2020-2033
- Germany Quick Service Restaurants Market Outlook, by Ownership Model, 2020-2033
- Germany Quick Service Restaurants Market Outlook, by Channel, 2020-2033
- Germany Quick Service Restaurants Market Outlook, by Location Type, 2020-2033
- Spain Quick Service Restaurants Market Outlook, by Format Type, 2020-2033
- Spain Quick Service Restaurants Market Outlook, by Ownership Model, 2020-2033
- Spain Quick Service Restaurants Market Outlook, by Channel, 2020-2033
- Spain Quick Service Restaurants Market Outlook, by Location Type, 2020-2033
- Poland Quick Service Restaurants Market Outlook, by Format Type, 2020-2033
- Poland Quick Service Restaurants Market Outlook, by Ownership Model, 2020-2033
- Poland Quick Service Restaurants Market Outlook, by Channel, 2020-2033
- Poland Quick Service Restaurants Market Outlook, by Location Type, 2020-2033
- Europe Quick Service Restaurants Market Outlook, by Format Type, Value (US$ Billion), 2020-2033
- Asia Pacific Quick Service Restaurants Market Outlook, 2020-2033
- Asia Pacific Quick Service Restaurants Market Outlook, by Format Type, Value (US$ Billion), 2020-2033
- Burger
- Chicken
- Pizza
- Sandwich
- Mexican
- Asian
- Coffee and Bakery Quick-Service
- Regional and Ethnic Fast Food
- Asia Pacific Quick Service Restaurants Market Outlook, by Ownership Model, Value (US$ Billion), 2020-2033
- Company-Operated
- Franchised
- Master-Franchised
- Asia Pacific Quick Service Restaurants Market Outlook, by Channel, Value (US$ Billion), 2020-2033
- Dine-In
- Drive-Through
- Takeaway
- Delivery
- Digital Ordering
- Asia Pacific Quick Service Restaurants Market Outlook, by Location Type, Value (US$ Billion), 2020-2033
- Standalone
- Mall and Food Court
- Travel and Transport
- Convenience and Forecourt
- Asia Pacific Quick Service Restaurants Market Outlook, by Country, Value (US$ Billion), 2020-2033
- China Quick Service Restaurants Market Outlook, by Format Type, 2020-2033
- China Quick Service Restaurants Market Outlook, by Ownership Model, 2020-2033
- China Quick Service Restaurants Market Outlook, by Channel, 2020-2033
- China Quick Service Restaurants Market Outlook, by Location Type, 2020-2033
- India Quick Service Restaurants Market Outlook, by Format Type, 2020-2033
- India Quick Service Restaurants Market Outlook, by Ownership Model, 2020-2033
- India Quick Service Restaurants Market Outlook, by Channel, 2020-2033
- India Quick Service Restaurants Market Outlook, by Location Type, 2020-2033
- Indonesia Quick Service Restaurants Market Outlook, by Format Type, 2020-2033
- Indonesia Quick Service Restaurants Market Outlook, by Ownership Model, 2020-2033
- Indonesia Quick Service Restaurants Market Outlook, by Channel, 2020-2033
- Indonesia Quick Service Restaurants Market Outlook, by Location Type, 2020-2033
- Japan Quick Service Restaurants Market Outlook, by Format Type, 2020-2033
- Japan Quick Service Restaurants Market Outlook, by Ownership Model, 2020-2033
- Japan Quick Service Restaurants Market Outlook, by Channel, 2020-2033
- Japan Quick Service Restaurants Market Outlook, by Location Type, 2020-2033
- Vietnam Quick Service Restaurants Market Outlook, by Format Type, 2020-2033
- Vietnam Quick Service Restaurants Market Outlook, by Ownership Model, 2020-2033
- Vietnam Quick Service Restaurants Market Outlook, by Channel, 2020-2033
- Vietnam Quick Service Restaurants Market Outlook, by Location Type, 2020-2033
- Philippines Quick Service Restaurants Market Outlook, by Format Type, 2020-2033
- Philippines Quick Service Restaurants Market Outlook, by Ownership Model, 2020-2033
- Philippines Quick Service Restaurants Market Outlook, by Channel, 2020-2033
- Philippines Quick Service Restaurants Market Outlook, by Location Type, 2020-2033
- Asia Pacific Quick Service Restaurants Market Outlook, by Format Type, Value (US$ Billion), 2020-2033
- Latin America Quick Service Restaurants Market Outlook, 2020-2033
- Latin America Quick Service Restaurants Market Outlook, by Format Type, Value (US$ Billion), 2020-2033
- Burger
- Chicken
- Pizza
- Sandwich
- Mexican
- Asian
- Coffee and Bakery Quick-Service
- Regional and Ethnic Fast Food
- Latin America Quick Service Restaurants Market Outlook, by Ownership Model, Value (US$ Billion), 2020-2033
- Company-Operated
- Franchised
- Master-Franchised
- Latin America Quick Service Restaurants Market Outlook, by Channel, Value (US$ Billion), 2020-2033
- Dine-In
- Drive-Through
- Takeaway
- Delivery
- Digital Ordering
- Latin America Quick Service Restaurants Market Outlook, by Location Type, Value (US$ Billion), 2020-2033
- Standalone
- Mall and Food Court
- Travel and Transport
- Convenience and Forecourt
- Latin America Quick Service Restaurants Market Outlook, by Country, Value (US$ Billion), 2020-2033
- Brazil Quick Service Restaurants Market Outlook, by Format Type, 2020-2033
- Brazil Quick Service Restaurants Market Outlook, by Ownership Model, 2020-2033
- Brazil Quick Service Restaurants Market Outlook, by Channel, 2020-2033
- Brazil Quick Service Restaurants Market Outlook, by Location Type, 2020-2033
- Mexico Quick Service Restaurants Market Outlook, by Format Type, 2020-2033
- Mexico Quick Service Restaurants Market Outlook, by Ownership Model, 2020-2033
- Mexico Quick Service Restaurants Market Outlook, by Channel, 2020-2033
- Mexico Quick Service Restaurants Market Outlook, by Location Type, 2020-2033
- Argentina Quick Service Restaurants Market Outlook, by Format Type, 2020-2033
- Argentina Quick Service Restaurants Market Outlook, by Ownership Model, 2020-2033
- Argentina Quick Service Restaurants Market Outlook, by Channel, 2020-2033
- Argentina Quick Service Restaurants Market Outlook, by Location Type, 2020-2033
- Chile Quick Service Restaurants Market Outlook, by Format Type, 2020-2033
- Chile Quick Service Restaurants Market Outlook, by Ownership Model, 2020-2033
- Chile Quick Service Restaurants Market Outlook, by Channel, 2020-2033
- Chile Quick Service Restaurants Market Outlook, by Location Type, 2020-2033
- Colombia Quick Service Restaurants Market Outlook, by Format Type, 2020-2033
- Colombia Quick Service Restaurants Market Outlook, by Ownership Model, 2020-2033
- Colombia Quick Service Restaurants Market Outlook, by Channel, 2020-2033
- Colombia Quick Service Restaurants Market Outlook, by Location Type, 2020-2033
- Peru Quick Service Restaurants Market Outlook, by Format Type, 2020-2033
- Peru Quick Service Restaurants Market Outlook, by Ownership Model, 2020-2033
- Peru Quick Service Restaurants Market Outlook, by Channel, 2020-2033
- Peru Quick Service Restaurants Market Outlook, by Location Type, 2020-2033
- Latin America Quick Service Restaurants Market Outlook, by Format Type, Value (US$ Billion), 2020-2033
- Middle East & Africa Quick Service Restaurants Market Outlook, 2020-2033
- Middle East & Africa Quick Service Restaurants Market Outlook, by Format Type, Value (US$ Billion), 2020-2033
- Burger
- Chicken
- Pizza
- Sandwich
- Mexican
- Asian
- Coffee and Bakery Quick-Service
- Regional and Ethnic Fast Food
- Middle East & Africa Quick Service Restaurants Market Outlook, by Ownership Model, Value (US$ Billion), 2020-2033
- Company-Operated
- Franchised
- Master-Franchised
- Middle East & Africa Quick Service Restaurants Market Outlook, by Channel, Value (US$ Billion), 2020-2033
- Dine-In
- Drive-Through
- Takeaway
- Delivery
- Digital Ordering
- Middle East & Africa Quick Service Restaurants Market Outlook, by Location Type, Value (US$ Billion), 2020-2033
- Standalone
- Mall and Food Court
- Travel and Transport
- Convenience and Forecourt
- Middle East & Africa Quick Service Restaurants Market Outlook, by Country and Subregion, Value (US$ Billion), 2020-2033
- Gulf states Quick Service Restaurants Market Outlook, by Format Type, 2020-2033
- Gulf states Quick Service Restaurants Market Outlook, by Ownership Model, 2020-2033
- Gulf states Quick Service Restaurants Market Outlook, by Channel, 2020-2033
- Gulf states Quick Service Restaurants Market Outlook, by Location Type, 2020-2033
- Saudi Arabia Quick Service Restaurants Market Outlook, by Format Type, 2020-2033
- Saudi Arabia Quick Service Restaurants Market Outlook, by Ownership Model, 2020-2033
- Saudi Arabia Quick Service Restaurants Market Outlook, by Channel, 2020-2033
- Saudi Arabia Quick Service Restaurants Market Outlook, by Location Type, 2020-2033
- United Arab Emirates Quick Service Restaurants Market Outlook, by Format Type, 2020-2033
- United Arab Emirates Quick Service Restaurants Market Outlook, by Ownership Model, 2020-2033
- United Arab Emirates Quick Service Restaurants Market Outlook, by Channel, 2020-2033
- United Arab Emirates Quick Service Restaurants Market Outlook, by Location Type, 2020-2033
- Egypt Quick Service Restaurants Market Outlook, by Format Type, 2020-2033
- Egypt Quick Service Restaurants Market Outlook, by Ownership Model, 2020-2033
- Egypt Quick Service Restaurants Market Outlook, by Channel, 2020-2033
- Egypt Quick Service Restaurants Market Outlook, by Location Type, 2020-2033
- Morocco Quick Service Restaurants Market Outlook, by Format Type, 2020-2033
- Morocco Quick Service Restaurants Market Outlook, by Ownership Model, 2020-2033
- Morocco Quick Service Restaurants Market Outlook, by Channel, 2020-2033
- Morocco Quick Service Restaurants Market Outlook, by Location Type, 2020-2033
- Nigeria Quick Service Restaurants Market Outlook, by Format Type, 2020-2033
- Nigeria Quick Service Restaurants Market Outlook, by Ownership Model, 2020-2033
- Nigeria Quick Service Restaurants Market Outlook, by Channel, 2020-2033
- Nigeria Quick Service Restaurants Market Outlook, by Location Type, 2020-2033
- Kenya Quick Service Restaurants Market Outlook, by Format Type, 2020-2033
- Kenya Quick Service Restaurants Market Outlook, by Ownership Model, 2020-2033
- Kenya Quick Service Restaurants Market Outlook, by Channel, 2020-2033
- Kenya Quick Service Restaurants Market Outlook, by Location Type, 2020-2033
- South Africa Quick Service Restaurants Market Outlook, by Format Type, 2020-2033
- South Africa Quick Service Restaurants Market Outlook, by Ownership Model, 2020-2033
- South Africa Quick Service Restaurants Market Outlook, by Channel, 2020-2033
- South Africa Quick Service Restaurants Market Outlook, by Location Type, 2020-2033
- Middle East & Africa Quick Service Restaurants Market Outlook, by Format Type, Value (US$ Billion), 2020-2033
- Competitive Landscape
- Market Concentration and Industry Leaders
- Competitive Differentiation
- Strategic Initiatives
- Recent Industry Developments
- Company Profiles
- McDonald's Corporation
- Yum! Brands, Inc.
- Restaurant Brands International Inc.
- Starbucks Corporation
- Subway IP LLC
- Inspire Brands, Inc.
- Domino's Pizza, Inc.
- Chick-fil-A, Inc.
- The Wendy's Company
- Chipotle Mexican Grill, Inc.
- Jollibee Foods Corporation
- Yum China Holdings, Inc.
- Alsea, S.A.B. de C.V.
- Americana Restaurants International PLC
- Appendix
- Research Methodology
- Report Assumptions
- Acronyms and Abbreviations
Format Type
- Burger
- Chicken
- Pizza
- Sandwich
- Mexican
- Asian
- Coffee and Bakery Quick-Service
- Regional and Ethnic Fast Food
Ownership Model
- Company-Operated
- Franchised
- Master-Franchised
Channel
- Dine-In
- Drive-Through
- Takeaway
- Delivery
- Digital Ordering
Location Type
- Standalone
- Mall and Food Court
- Travel and Transport
- Convenience and Forecourt
Regions
- North America
- Europe
- Asia Pacific
- Latin America
- Middle East & Africa
Our Research Methodology
Considering the volatility of business today, traditional approaches to strategizing a game plan can be unfruitful if not detrimental. True ambiguity is no way to determine a forecast. A myriad of predetermined factors must be accounted for such as the degree of risk involved, the magnitude of circumstances, as well as conditions or consequences that are not known or unpredictable. To circumvent binary views that cast uncertainty, the application of market research intelligence to strategically posture, move, and enable actionable outcomes is necessary.
View Methodology
Quality Assured
Rigorous Validation Process

Confidentiality Assured
End-to-end Data Security

Custom Research Services
Tailored To Your Objectives
FAQs
Global system-wide sales reach US$ 1,090.0 billion in 2026, measured at the consumer level across company-operated and franchised limited-service restaurants worldwide.
System sales are projected to reach US$ 1,556.0 billion by 2033, a 5.2% CAGR that adds US$ 466.0 billion across the forecast period.
Burger restaurants lead with 26.5% of system sales in 2026, supported by the densest networks and the most efficient drive-through operating models.
Digital ordering grows fastest at a 9.2% CAGR to 2033, because order-ahead applications raise average ticket size and give brands first-party customer data.
North America holds 33.0% of system sales in 2026, reflecting the largest store base, highest unit volumes and most developed drive-through infrastructure.
Related Reports
Plant Extracts Market Size, Share, Insights, Competitive Landscape, and Forecast 2026 to 2033
The global plant extracts market is valued at US$42.0 billion in 2026, reaching US$68.5 billion by 2033, growing at a 7.2% CAGR
Kombucha Market Size, Share, Insights, Competitive Landscape, and Forecast 2026 to 2033
The Kombucha Market is projected to grow from US$ 3.2 billion in 2026 to US$ 4.8 billion by 2033 at a 6.0% CAGR. Explore trends and leading segments.
Insect Protein Market Size, Share, Insights, Competitive Landscape, and Forecast 2026 to 2033
Insect Protein Market is projected to grow from US$ 1.03 billion in 2026 to US$ 3.17 billion by 2033 at a 17.4% CAGR. Explore trends and key segments.
Functional Mushroom Market Size, Share, Insights, Competitive Landscape, and Forecast 2026 to 2033
Explore the Functional Mushroom Market, projected to grow from US$ 2.6 billion in 2026 to US$ 4.4 billion by 2033 at a 7.8% CAGR. See trends and segments.
Food Preservatives Market Size, Share, Insights, Competitive Landscape, and Forecast 2026 to 2033
The food preservatives market is valued at US$ 3.67 billion in 2026 and projected to reach US$ 4.97 billion by 2033 at a CAGR of 4.4%.
Beeswax Market Size, Share, Insights, Competitive Landscape, and Forecast 2026 to 2033
The beeswax market is valued at US$ 0.7 billion in 2026 and projected to reach US$ 1.0 billion by 2033 at a CAGR of 5.2%.