



Zirconium Market
Zirconium Market Size, Share, Insights, Competitive Landscape, and Forecast 2026 to 2033
Zirconium Market Size and Trend Analysis
What Will Drive Zirconium Market Value Through 2033?
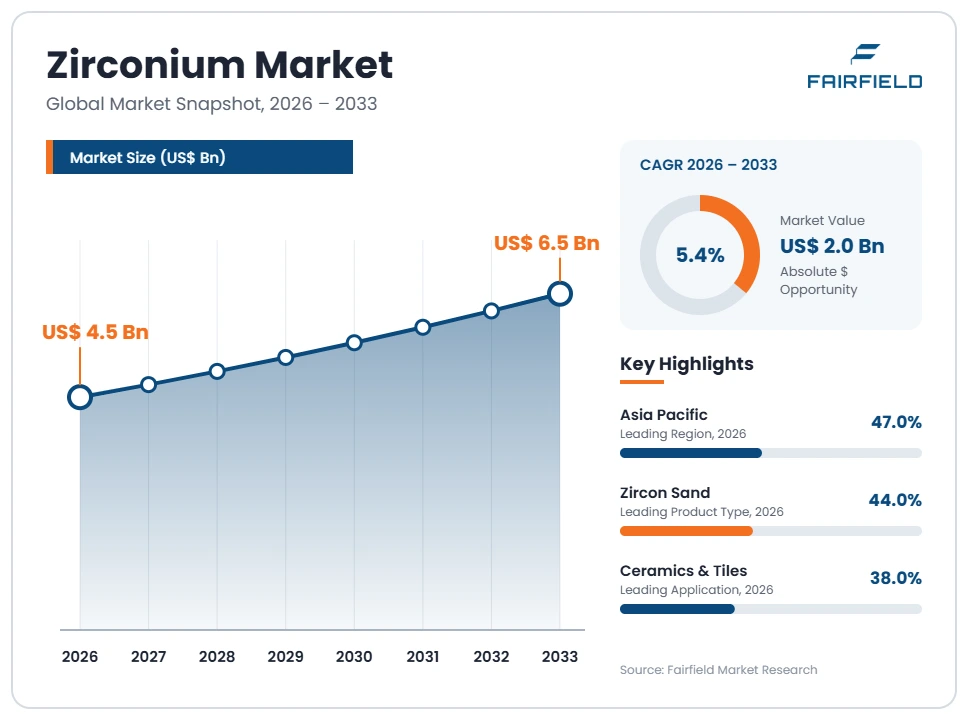
The global Zirconium market size is expected to be valued at US$ 4.5 billion in 2026 and projected to reach US$ 6.5 billion by 2033, growing at a CAGR of 5.4% between 2026 and 2033.
Value rose from roughly US$ 3.42 billion in 2020 to about US$ 4.26 billion in 2025, a historical CAGR of 4.5%. The 2026 estimate of US$ 4,520 million covers the full chain: zircon sand, zirconium chemicals, fused and chemical zirconia, zirconium metal and alloys, and hafnium recovered as a co-product. Pricing, rather than volume, has carried most of the increase. Ore grades at mature mineral sands operations have declined, few large new deposits have reached production, and zircon is a by-product of titanium feedstock mining, so supply responds slowly to demand. Nuclear construction supplies the clearest growth pull.
Key Report Takeaways
- By Product Type: Zircon Sand held 44% share in 2026, while Zirconium Metal & Alloys are projected to expand at a 7.6% CAGR through 2033, because reactor cladding is a qualified material served by a very narrow supply base.
- By Application: Ceramics & Tiles held 38% share in 2026, while Electronics & Advanced Ceramics are projected to expand at a 7.8% CAGR through 2033, driven by zirconia components in sensors, fibre connectors and solid oxide cells.
- By Grade: Standard Grade held 45% share in 2026, while Nuclear Grade is projected to expand at an 8.5% CAGR through 2033, reflecting hafnium-free specifications that only a handful of plants can produce.
- By End Use Industry: Construction held 35% share in 2026, while Healthcare is projected to expand at a 7.4% CAGR through 2033, supported by zirconia dental restorations and orthopaedic bearing surfaces replacing metal.
- By Geography: Asia Pacific held 47% share in 2026, while Middle East & Africa is projected to expand at a 7.1% CAGR through 2033, as new mineral sands capacity and regional tile production both expand.
Global Zirconium Market Trends and Insights
Drivers Impact Analysis
Two forces, one on the demand side and one on the supply side, account for most forecast value growth.
| Driver | Impact on CAGR Forecast | Geographic Relevance | Impact Timeline |
| Nuclear new build and small modular reactor programmes | High | North America, Europe, Asia Pacific | Long term (≥4 years) |
| Declining zircon ore grades and slow new mine supply | High | Global | Medium term (2–4 years) |
Nuclear Construction and Small Modular Reactor Programmes Lift Zirconium Alloy Demand
Nuclear power is the clearest source of incremental zirconium demand, because fuel cladding has no accepted substitute. Zirconium alloys combine low neutron absorption with adequate corrosion resistance in hot water, a combination no other structural metal matches at reactor conditions. Every reactor under construction, and every unit whose life is extended, commits an operator to recurring cladding tube purchases for decades.
The mechanism is policy converting into fuel fabrication orders. More than 20 countries endorsed a declaration at COP28 to triple global nuclear capacity by 2050, and the United States has legislated to accelerate advanced reactor licensing. The European Commission included nuclear energy in its sustainable finance taxonomy under conditions, improving access to capital. Small modular reactor designs multiply the number of fuel assemblies per unit of output, which raises cladding demand per installed megawatt relative to large reactors.
Falling Zircon Ore Grades and Limited New Mine Supply Hold Prices Firm
Supply constraint, not demand strength, has driven most of the value growth in this market. Zircon is produced as a by-product of mineral sands mining aimed primarily at titanium feedstocks, so producers cannot raise zircon output independently when prices rise. Mature deposits in the main producing countries have seen heavy mineral grades decline, which lowers recovered tonnes per tonne of ore moved.
The underlying cause is project economics and geology. Mineral sands discoveries of commercial scale are rare, permitting and community agreements take years, and the capital required for dredging, separation and milling is substantial. Operations in Australia, South Africa, Mozambique and Senegal supply the bulk of traded zircon, and several long-running mines are approaching the end of their reserve lives. Consumers therefore compete for a slowly shrinking pool of premium-grade material, which sustains pricing across chemicals and zirconia.
Restraints Impact Analysis
Two constraints limit volume growth and raise the cost of handling zirconium-bearing materials.
| Restraint | Impact on CAGR Forecast | Geographic Relevance | Impact Timeline |
| Opacifier thrifting and substitution in ceramic tile bodies | High | Asia Pacific, Europe | Medium term (2–4 years) |
| Radioactivity content of zircon raising handling and milling costs | Medium | Europe, North America | Long term (≥4 years) |
Opacifier Thrifting in Ceramic Tiles Caps Zircon Sand Volume Growth
Tile manufacturers have steadily reduced the zircon content of their glazes, and that thrifting puts a ceiling on the largest single application for zircon sand. Every price spike has prompted formulators to test finer milling, alternative whitening agents and thinner glaze layers that deliver acceptable opacity with less material. Once a reformulated body passes quality testing, the reduction is permanent rather than cyclical.
The cost source is the zircon price itself relative to substitutes. Finely milled zircon flour improves opacity per kilogram, letting producers cut dosage by a meaningful margin without visible change. Titanium dioxide, alumina and calcined kaolin partially replace zircon in some formulations. Large-format thin panels, now a growing share of tile output, use less glaze per square metre by design. Each of these shifts reduces zircon intensity even as global tile production continues to rise.
Naturally Occurring Radioactivity in Zircon Raises Handling, Transport and Milling Costs
The uranium and thorium content of zircon makes it a regulated material in several jurisdictions, and that classification adds cost at every point between the mine and the customer. Milling zircon into flour generates dust containing radionuclides, so plants need enclosed grinding, extraction and monitoring. Some processors have chosen not to handle the material at all rather than accept the oversight.
The specific cost drivers are worker dose monitoring, licensed storage and residue disposal. Council Directive 2013/59/Euratom brought naturally occurring radioactive material industries under formal radiation protection requirements in the European Union, obliging operators to assess exposure and justify practices. Transport is governed by dangerous goods rules once activity thresholds are exceeded, which restricts shipping options and raises freight rates. Milling residues and filter dusts concentrate radioactivity further, creating a disposal stream with limited licensed outlets and high per-tonne charges.
Market Opportunities
Two revenue pools sit outside the traditional zircon sand and ceramic opacifier trade.
Hafnium Recovery From Nuclear-Grade Separation Opens a High-Value Co-Product Stream
Hafnium separated during nuclear-grade zirconium production is a small-volume, high-value stream that can materially improve the economics of a sponge plant. The two elements occur together in zircon and must be separated to make cladding, so hafnium is recovered whether or not it is sold. Because global output is measured in low hundreds of tonnes, modest demand growth moves prices sharply.
Producers already operating zirconium separation and sponge capacity are the only parties able to capture this, which is a strong barrier. Demand comes from superalloy producers using hafnium in single-crystal turbine blades, from semiconductor manufacturers using hafnium compounds in high-dielectric gate layers, and from plasma cutting electrode makers. Growth in advanced reactor programmes raises separation throughput, and hafnium also serves as a control rod material in several reactor designs.
Dental and Orthopaedic Zirconia Builds a High-Margin Medical Ceramics Revenue Pool
Medical and dental zirconia is the highest value per kilogram application in the entire zirconium chain, and it continues to displace metal. Yttria-stabilised zirconia crowns, bridges and implant abutments combine tooth-like appearance with fracture toughness that earlier all-ceramic materials lacked. Prices per kilogram of finished medical-grade powder sit orders of magnitude above zircon sand, so modest tonnage carries substantial revenue.
Advanced ceramic powder producers and medical device manufacturers capture this pool rather than mineral sands miners. Demand comes from dental laboratories adopting digital scanning and milling workflows, which favour machinable ceramic blanks over cast metal, and from orthopaedic suppliers using zirconia-toughened bearing surfaces in joint replacements. Ageing populations in developed markets sustain procedure volumes, while private dental spending in emerging economies is expanding quickly from a low base.
Segment Analysis
- By Product Type: Zircon Sand Dominates Volume While Metal and Alloys Grow Fastest
Zircon Sand held 44% share in 2026, the largest product position, because it is the feedstock for every downstream route and is consumed directly as an opacifier, foundry sand and refractory raw material. Zirconium Chemicals, led by zirconium oxychloride and basic sulphate, form the intermediate step toward most engineered products. Zirconia, both fused and chemically precipitated, serves refractories, abrasives, pigments and technical ceramics. Zirconium Metal & Alloys are the fastest-growing product type at a 7.6% CAGR through 2033, driven by nuclear cladding tube demand against a supply base of very few qualified sponge plants worldwide. Hafnium & Co-Products contribute small tonnage but disproportionate value. The implication is that value is migrating downstream, while the upstream mineral remains the constraint that governs availability for every other segment.
- By Application: Ceramics and Tiles Lead Consumption While Advanced Ceramics Expand Quickest
Ceramics & Tiles held 38% share in 2026, the leading application, since milled zircon remains the most effective opacifier for white glazes and ceramic sanitaryware. Refractories follow, using zirconia and zircon in glass furnace blocks, continuous casting components and other linings exposed to molten material. Foundry Sand exploits zircon’s low thermal expansion and resistance to metal penetration in precision castings. Chemicals & Catalysts cover zirconium compounds used in paper coatings, tanning, catalyst supports and water treatment. Nuclear Fuel Cladding consumes the metal route. Electronics & Advanced Ceramics is the fastest-growing application at a 7.8% CAGR to 2033, driven by zirconia in oxygen sensors, optical fibre ferrules, solid oxide fuel cells and cutting tools. The business implication is that tonnage and margin now sit in clearly separate applications.
- By Grade: Standard Material Carries Volume While Nuclear Grade Commands Fastest Growth
Standard Grade accounted for 45% of the market in 2026, the largest grade position, because bulk ceramic, refractory and foundry buyers tolerate the iron, titanium and alumina levels found in ordinary zircon concentrate. Premium Grade, with tighter impurity limits, supplies demanding glaze, frit and chemical conversion customers and attracts a consistent price premium as mature mines yield less of it. Chemical Grade feeds oxychloride and sulphate production where consistent chemistry matters more than particle characteristics. Nuclear Grade is the fastest-growing grade at an 8.5% CAGR through 2033, because reactor cladding requires hafnium removed to a few parts per million, a separation performed at only a handful of plants globally. For buyers, the practical conclusion is that grade availability, not headline tonnage, determines whether a project can be supplied.
- By End Use Industry: Construction Consumes the Most While Healthcare Rises Fastest
Construction represented 35% of demand in 2026, the dominant end use, because ceramic tiles and sanitaryware absorb more zircon than any other outlet and building activity governs their output. Power Generation follows, driven entirely by nuclear fuel cladding and reactor internals. Metallurgy & Foundry uses zircon sand and zirconia refractories across steel, glass and investment casting operations. Chemicals & Petrochemicals employ zirconium compounds as catalyst supports and corrosion-resistant process equipment. Electronics & Semiconductors consume technical zirconia and hafnium compounds in small but growing quantities. Healthcare is the fastest-growing end use at a 7.4% CAGR through 2033, as zirconia dental restorations and orthopaedic bearing surfaces replace metal alternatives. The implication is that producers reliant on construction cycles face volatility that downstream specialists largely avoid.
Geography Analysis
- North America Concentrates Zirconium Value in Nuclear Fuel and Technical Ceramics
North America holds 15% share in 2026 and grows at a 5.6% CAGR, with demand concentrated in the United States and Canada. The region mines little zircon and imports most of its feedstock, so its position rests on downstream conversion rather than mineral supply. Zirconium sponge and alloy production for reactor cladding is the highest value activity, serving a large installed reactor fleet, life-extension programmes and an active pipeline of advanced reactor designs. Legislation directing the Nuclear Regulatory Commission to streamline advanced reactor licensing supports that pipeline. Foundry, refractory and investment casting users form a steady industrial base, while technical ceramics demand comes from medical, sensor and semiconductor manufacturers. The main vulnerability is feedstock dependence on distant suppliers, which the clearest opportunity, recycling and reprocessing of zirconium scrap, only partly addresses.
- Europe Converts Imported Zircon Into Chemicals, Refractories and Reactor Components
Europe accounts for 19% share in 2026 and grows at a 4.3% CAGR, the slowest of the five regions. Spain and Italy are the largest consumers of milled zircon, since both host major ceramic tile and frit industries that supply global markets. France operates significant zirconium metal and alloy capacity tied to its reactor fleet and fuel fabrication, while Germany and the United Kingdom host chemical and advanced ceramic producers. Nearly all feedstock is imported. Radiation protection rules under Council Directive 2013/59/Euratom impose monitoring and disposal obligations on milling operations, raising conversion costs relative to other locations. High industrial energy prices weigh on fused zirconia and refractory production. Inclusion of nuclear energy in the sustainable finance taxonomy is the clearest positive change for regional alloy demand.
- Which Region Is Leading the Zirconium Market?
Asia Pacific leads the zirconium market with 47% share in 2026, because it combines the largest mine supply with by far the largest consumption. Australia is the single most important producing country, hosting long-established mineral sands operations and the dominant share of traded premium zircon. China consumes more zircon than any other country, converting it into opacifiers for the world’s biggest ceramic tile industry, into zirconium oxychloride and basic sulphate, and into fused zirconia for refractories and abrasives. India and Indonesia add both production and rising tile output. Japan and South Korea specialise in high-purity zirconia powders for electronics, sensors and medical ceramics. The region’s weakness is ore grade decline at mature Australian deposits, which pushes buyers toward longer contracts and more secondary supply.
- Latin America Supplies Little Zircon While Ceramic Tile Output Sustains Demand
Latin America represents 6% share in 2026 and grows at a 4.8% CAGR, with Brazil accounting for most activity. Brazil produces modest quantities of zircon from coastal mineral sands and operates one of the world’s larger ceramic tile industries, which consumes both domestic and imported material. Mexico, Colombia and Argentina add tile, sanitaryware and foundry demand. The barriers are structural: no large-scale premium zircon production exists, downstream chemical conversion capacity is limited, and most value-added zirconia is imported at dollar prices. Currency volatility complicates long-term supply contracts, and port and inland freight costs raise landed prices. Nuclear demand is negligible outside a small fleet. The clearest opportunity is local milling and micronising capacity, which captures margin currently earned by overseas processors.
- Which Region Is Growing Fastest in the Zirconium Market?
Middle East & Africa is growing fastest in the zirconium market, at a 7.1% CAGR between 2026 and 2033 from 13% share in 2026, and supply is the reason. South Africa, Mozambique and Senegal together account for a large share of internationally traded zircon, and mineral sands projects in these countries represent most of the credible new capacity reaching the market this decade. Egypt, Turkey, Saudi Arabia and the United Arab Emirates are expanding ceramic tile and sanitaryware production, adding regional consumption to the export base. The barriers are substantial: power reliability, port and rail capacity, permitting timelines and community agreements all delay projects. Political and fiscal risk raises the cost of capital. The opportunity is downstream milling and chemical conversion built near the mines rather than exporting raw concentrate.
Competitive Landscape
The zirconium market is highly concentrated at the mine and narrows further at each downstream step. A small group of mineral sands producers, including Iluka Resources, Tronox Holdings, Rio Tinto, Chemours, Kenmare Resources, Eramet, Base Resources and Image Resources, account for the majority of internationally traded zircon, and most of them produce it as a co-product of titanium feedstock operations. Nuclear-grade sponge and alloy production is more concentrated still, with ATI Inc., Westinghouse Electric Company and Framatome among the few qualified Western suppliers. Chemical and advanced ceramic conversion is less consolidated, with Saint-Gobain ZirPro, Tosoh Corporation, Daiichi Kigenso Kagaku Kogyo, Sibelco and Guangdong Orient Zirconic Ind Sci-Tech serving different quality tiers.
Competition is based on security of supply and grade consistency rather than price alone. Buyers of premium and chemical grade material sign multi-year offtake agreements because they cannot reformulate quickly around a change in impurity profile. In nuclear applications, qualification is effectively permanent: cladding alloys are approved as part of a fuel design, so switching suppliers requires regulatory review that few utilities will undertake. New entrants appear mainly in milling, micronising and specialty zirconia powders, where capital requirements are far lower than in mining or sponge production.
Strategic behaviour centres on reserve replacement, tailings and by-product recovery, and moving downstream into milled products and chemicals to capture margin beyond concentrate sales. Several producers are also extending mine lives through lower-grade processing rather than relying on new discoveries.
Strategic direction is converging on vertical integration, long-term contracting and secondary recovery, as companies plan around a feedstock base that is not expanding quickly.
Recent Industry Developments
- December 2013: The European Union adopted Council Directive 2013/59/Euratom, the Basic Safety Standards Directive, which brought industries handling naturally occurring radioactive material under formal radiation protection requirements – zircon milling and zirconia production fall within scope, raising compliance costs for European processors.
- February 2022: The European Commission adopted the Complementary Climate Delegated Act, including nuclear energy in the EU Taxonomy under specified conditions – improved access to sustainable finance supports reactor projects that underpin long-term zirconium alloy demand.
- December 2023: At COP28 in Dubai, more than 20 countries endorsed a declaration to triple global nuclear energy capacity by 2050 – a shared political target that gives fuel fabricators and cladding suppliers a longer planning horizon.
- July 2024: The United States enacted the ADVANCE Act, directing the Nuclear Regulatory Commission to streamline licensing for advanced reactors – shortening the regulatory path brings forward nuclear-grade sponge and cladding orders for new designs.
Companies Covered in the Report
- Iluka Resources
- Tronox Holdings
- Rio Tinto
- Chemours
- Kenmare Resources
- Eramet
- Base Resources
- Image Resources
- Sibelco
- ATI Inc.
- Westinghouse Electric Company
- Framatome
- Saint-Gobain ZirPro
- Tosoh Corporation
- Daiichi Kigenso Kagaku Kogyo
- Guangdong Orient Zirconic Ind Sci-Tech
Zirconium Market Report Scope
| Metric | Value |
| Study Period | 2020–2033 |
| Market Size 2026 | US$ 4.5 Billion |
| Market Size 2033 | US$ 6.5 Billion |
| CAGR 2026–2033 | 5.4% |
| Absolute Dollar Opportunity | US$ 2.0 Billion |
| Largest Market | Asia Pacific (47% share in 2026) |
| Fastest-Growing Market | Middle East & Africa (7.1% CAGR) |
| Market Concentration | High |
| Major Players | Iluka Resources, Tronox Holdings, Chemours, Kenmare Resources, ATI Inc. |
Zirconium Market Segmentation
Product Type
- Zircon Sand
- Zirconium Chemicals
- Zirconia (Fused & Chemical)
- Zirconium Metal & Alloys
- Hafnium & Co-Products
Application
- Ceramics & Tiles
- Refractories
- Foundry Sand
- Chemicals & Catalysts
- Nuclear Fuel Cladding
- Electronics & Advanced Ceramics
Grade
- Standard Grade
- Premium Grade
- Chemical Grade
- Nuclear Grade
End Use Industry
- Construction
- Power Generation
- Metallurgy & Foundry
- Chemicals & Petrochemicals
- Electronics & Semiconductors
- Healthcare
Regions
- North America
- Europe
- Asia Pacific
- Latin America
- Middle East & Africa
- Executive Summary
- Global Zirconium Market Snapshot
- Future Projections
- Key Report Takeaways
- Regional Snapshot
- Market Overview
- Market Definition and Report Scope
- Historical Trends 2020–2025
- Market Dynamics
- Drivers
- Nuclear Construction and Small Modular Reactor Programmes Lift Zirconium Alloy Demand
- Falling Zircon Ore Grades and Limited New Mine Supply Hold Prices Firm
- Restraints
- Opacifier Thrifting in Ceramic Tiles Caps Zircon Sand Volume Growth
- Naturally Occurring Radioactivity in Zircon Raises Handling, Transport and Milling Costs
- Market Opportunities
- Hafnium Recovery From Nuclear-Grade Separation Opens a High-Value Co-Product Stream
- Dental and Orthopaedic Zirconia Builds a High-Margin Medical Ceramics Revenue Pool
- Drivers
- Global Zirconium Market Outlook, 2020–2033
- Global Zirconium Market Outlook, by Product Type, Value (US$ Billion), 2020–2033
- Zircon Sand
- Zirconium Chemicals
- Zirconia (Fused & Chemical)
- Zirconium Metal & Alloys
- Hafnium & Co-Products
- Global Zirconium Market Outlook, by Application, Value (US$ Billion), 2020–2033
- Ceramics & Tiles
- Refractories
- Foundry Sand
- Chemicals & Catalysts
- Nuclear Fuel Cladding
- Electronics & Advanced Ceramics
- Global Zirconium Market Outlook, by Grade, Value (US$ Billion), 2020–2033
- Standard Grade
- Premium Grade
- Chemical Grade
- Nuclear Grade
- Global Zirconium Market Outlook, by End Use Industry, Value (US$ Billion), 2020–2033
- Construction
- Power Generation
- Metallurgy & Foundry
- Chemicals & Petrochemicals
- Electronics & Semiconductors
- Healthcare
- Global Zirconium Market Outlook, by Region, Value (US$ Billion), 2020–2033
- North America
- Europe
- Asia Pacific
- Latin America
- Middle East & Africa
- Global Zirconium Market Outlook, by Product Type, Value (US$ Billion), 2020–2033
- North America Zirconium Market Outlook, 2020–2033
- North America Zirconium Market Outlook, by Product Type, Value (US$ Billion), 2020–2033
- Zircon Sand
- Zirconium Chemicals
- Zirconia (Fused & Chemical)
- Zirconium Metal & Alloys
- Hafnium & Co-Products
- North America Zirconium Market Outlook, by Application, Value (US$ Billion), 2020–2033
- Ceramics & Tiles
- Refractories
- Foundry Sand
- Chemicals & Catalysts
- Nuclear Fuel Cladding
- Electronics & Advanced Ceramics
- North America Zirconium Market Outlook, by Grade, Value (US$ Billion), 2020–2033
- Standard Grade
- Premium Grade
- Chemical Grade
- Nuclear Grade
- North America Zirconium Market Outlook, by End Use Industry, Value (US$ Billion), 2020–2033
- Construction
- Power Generation
- Metallurgy & Foundry
- Chemicals & Petrochemicals
- Electronics & Semiconductors
- Healthcare
- North America Zirconium Market Outlook, by Country, Value (US$ Billion), 2020–2033
- United States Zirconium Market Outlook, by Product Type, 2020–2033
- United States Zirconium Market Outlook, by Application, 2020–2033
- United States Zirconium Market Outlook, by Grade, 2020–2033
- United States Zirconium Market Outlook, by End Use Industry, 2020–2033
- Canada Zirconium Market Outlook, by Product Type, 2020–2033
- Canada Zirconium Market Outlook, by Application, 2020–2033
- Canada Zirconium Market Outlook, by Grade, 2020–2033
- Canada Zirconium Market Outlook, by End Use Industry, 2020–2033
- North America Zirconium Market Outlook, by Product Type, Value (US$ Billion), 2020–2033
- Europe Zirconium Market Outlook, 2020–2033
- Europe Zirconium Market Outlook, by Product Type, Value (US$ Billion), 2020–2033
- Zircon Sand
- Zirconium Chemicals
- Zirconia (Fused & Chemical)
- Zirconium Metal & Alloys
- Hafnium & Co-Products
- Europe Zirconium Market Outlook, by Application, Value (US$ Billion), 2020–2033
- Ceramics & Tiles
- Refractories
- Foundry Sand
- Chemicals & Catalysts
- Nuclear Fuel Cladding
- Electronics & Advanced Ceramics
- Europe Zirconium Market Outlook, by Grade, Value (US$ Billion), 2020–2033
- Standard Grade
- Premium Grade
- Chemical Grade
- Nuclear Grade
- Europe Zirconium Market Outlook, by End Use Industry, Value (US$ Billion), 2020–2033
- Construction
- Power Generation
- Metallurgy & Foundry
- Chemicals & Petrochemicals
- Electronics & Semiconductors
- Healthcare
- Europe Zirconium Market Outlook, by Country, Value (US$ Billion), 2020–2033
- Spain Zirconium Market Outlook, by Product Type, 2020–2033
- Spain Zirconium Market Outlook, by Application, 2020–2033
- Spain Zirconium Market Outlook, by Grade, 2020–2033
- Spain Zirconium Market Outlook, by End Use Industry, 2020–2033
- Italy Zirconium Market Outlook, by Product Type, 2020–2033
- Italy Zirconium Market Outlook, by Application, 2020–2033
- Italy Zirconium Market Outlook, by Grade, 2020–2033
- Italy Zirconium Market Outlook, by End Use Industry, 2020–2033
- France Zirconium Market Outlook, by Product Type, 2020–2033
- France Zirconium Market Outlook, by Application, 2020–2033
- France Zirconium Market Outlook, by Grade, 2020–2033
- France Zirconium Market Outlook, by End Use Industry, 2020–2033
- Germany Zirconium Market Outlook, by Product Type, 2020–2033
- Germany Zirconium Market Outlook, by Application, 2020–2033
- Germany Zirconium Market Outlook, by Grade, 2020–2033
- Germany Zirconium Market Outlook, by End Use Industry, 2020–2033
- United Kingdom Zirconium Market Outlook, by Product Type, 2020–2033
- United Kingdom Zirconium Market Outlook, by Application, 2020–2033
- United Kingdom Zirconium Market Outlook, by Grade, 2020–2033
- United Kingdom Zirconium Market Outlook, by End Use Industry, 2020–2033
- Europe Zirconium Market Outlook, by Product Type, Value (US$ Billion), 2020–2033
- Asia Pacific Zirconium Market Outlook, 2020–2033
- Asia Pacific Zirconium Market Outlook, by Product Type, Value (US$ Billion), 2020–2033
- Zircon Sand
- Zirconium Chemicals
- Zirconia (Fused & Chemical)
- Zirconium Metal & Alloys
- Hafnium & Co-Products
- Asia Pacific Zirconium Market Outlook, by Application, Value (US$ Billion), 2020–2033
- Ceramics & Tiles
- Refractories
- Foundry Sand
- Chemicals & Catalysts
- Nuclear Fuel Cladding
- Electronics & Advanced Ceramics
- Asia Pacific Zirconium Market Outlook, by Grade, Value (US$ Billion), 2020–2033
- Standard Grade
- Premium Grade
- Chemical Grade
- Nuclear Grade
- Asia Pacific Zirconium Market Outlook, by End Use Industry, Value (US$ Billion), 2020–2033
- Construction
- Power Generation
- Metallurgy & Foundry
- Chemicals & Petrochemicals
- Electronics & Semiconductors
- Healthcare
- Asia Pacific Zirconium Market Outlook, by Country, Value (US$ Billion), 2020–2033
- Australia Zirconium Market Outlook, by Product Type, 2020–2033
- Australia Zirconium Market Outlook, by Application, 2020–2033
- Australia Zirconium Market Outlook, by Grade, 2020–2033
- Australia Zirconium Market Outlook, by End Use Industry, 2020–2033
- China Zirconium Market Outlook, by Product Type, 2020–2033
- China Zirconium Market Outlook, by Application, 2020–2033
- China Zirconium Market Outlook, by Grade, 2020–2033
- China Zirconium Market Outlook, by End Use Industry, 2020–2033
- India Zirconium Market Outlook, by Product Type, 2020–2033
- India Zirconium Market Outlook, by Application, 2020–2033
- India Zirconium Market Outlook, by Grade, 2020–2033
- India Zirconium Market Outlook, by End Use Industry, 2020–2033
- Indonesia Zirconium Market Outlook, by Product Type, 2020–2033
- Indonesia Zirconium Market Outlook, by Application, 2020–2033
- Indonesia Zirconium Market Outlook, by Grade, 2020–2033
- Indonesia Zirconium Market Outlook, by End Use Industry, 2020–2033
- Japan Zirconium Market Outlook, by Product Type, 2020–2033
- Japan Zirconium Market Outlook, by Application, 2020–2033
- Japan Zirconium Market Outlook, by Grade, 2020–2033
- Japan Zirconium Market Outlook, by End Use Industry, 2020–2033
- South Korea Zirconium Market Outlook, by Product Type, 2020–2033
- South Korea Zirconium Market Outlook, by Application, 2020–2033
- South Korea Zirconium Market Outlook, by Grade, 2020–2033
- South Korea Zirconium Market Outlook, by End Use Industry, 2020–2033
- Asia Pacific Zirconium Market Outlook, by Product Type, Value (US$ Billion), 2020–2033
- Latin America Zirconium Market Outlook, 2020–2033
- Latin America Zirconium Market Outlook, by Product Type, Value (US$ Billion), 2020–2033
- Zircon Sand
- Zirconium Chemicals
- Zirconia (Fused & Chemical)
- Zirconium Metal & Alloys
- Hafnium & Co-Products
- Latin America Zirconium Market Outlook, by Application, Value (US$ Billion), 2020–2033
- Ceramics & Tiles
- Refractories
- Foundry Sand
- Chemicals & Catalysts
- Nuclear Fuel Cladding
- Electronics & Advanced Ceramics
- Latin America Zirconium Market Outlook, by Grade, Value (US$ Billion), 2020–2033
- Standard Grade
- Premium Grade
- Chemical Grade
- Nuclear Grade
- Latin America Zirconium Market Outlook, by End Use Industry, Value (US$ Billion), 2020–2033
- Construction
- Power Generation
- Metallurgy & Foundry
- Chemicals & Petrochemicals
- Electronics & Semiconductors
- Healthcare
- Latin America Zirconium Market Outlook, by Country, Value (US$ Billion), 2020–2033
- Brazil Zirconium Market Outlook, by Product Type, 2020–2033
- Brazil Zirconium Market Outlook, by Application, 2020–2033
- Brazil Zirconium Market Outlook, by Grade, 2020–2033
- Brazil Zirconium Market Outlook, by End Use Industry, 2020–2033
- Mexico Zirconium Market Outlook, by Product Type, 2020–2033
- Mexico Zirconium Market Outlook, by Application, 2020–2033
- Mexico Zirconium Market Outlook, by Grade, 2020–2033
- Mexico Zirconium Market Outlook, by End Use Industry, 2020–2033
- Colombia Zirconium Market Outlook, by Product Type, 2020–2033
- Colombia Zirconium Market Outlook, by Application, 2020–2033
- Colombia Zirconium Market Outlook, by Grade, 2020–2033
- Colombia Zirconium Market Outlook, by End Use Industry, 2020–2033
- Argentina Zirconium Market Outlook, by Product Type, 2020–2033
- Argentina Zirconium Market Outlook, by Application, 2020–2033
- Argentina Zirconium Market Outlook, by Grade, 2020–2033
- Argentina Zirconium Market Outlook, by End Use Industry, 2020–2033
- Latin America Zirconium Market Outlook, by Product Type, Value (US$ Billion), 2020–2033
- Middle East & Africa Zirconium Market Outlook, 2020–2033
- Middle East & Africa Zirconium Market Outlook, by Product Type, Value (US$ Billion), 2020–2033
- Zircon Sand
- Zirconium Chemicals
- Zirconia (Fused & Chemical)
- Zirconium Metal & Alloys
- Hafnium & Co-Products
- Middle East & Africa Zirconium Market Outlook, by Application, Value (US$ Billion), 2020–2033
- Ceramics & Tiles
- Refractories
- Foundry Sand
- Chemicals & Catalysts
- Nuclear Fuel Cladding
- Electronics & Advanced Ceramics
- Middle East & Africa Zirconium Market Outlook, by Grade, Value (US$ Billion), 2020–2033
- Standard Grade
- Premium Grade
- Chemical Grade
- Nuclear Grade
- Middle East & Africa Zirconium Market Outlook, by End Use Industry, Value (US$ Billion), 2020–2033
- Construction
- Power Generation
- Metallurgy & Foundry
- Chemicals & Petrochemicals
- Electronics & Semiconductors
- Healthcare
- Middle East & Africa Zirconium Market Outlook, by Country, Value (US$ Billion), 2020–2033
- South Africa Zirconium Market Outlook, by Product Type, 2020–2033
- South Africa Zirconium Market Outlook, by Application, 2020–2033
- South Africa Zirconium Market Outlook, by Grade, 2020–2033
- South Africa Zirconium Market Outlook, by End Use Industry, 2020–2033
- Mozambique Zirconium Market Outlook, by Product Type, 2020–2033
- Mozambique Zirconium Market Outlook, by Application, 2020–2033
- Mozambique Zirconium Market Outlook, by Grade, 2020–2033
- Mozambique Zirconium Market Outlook, by End Use Industry, 2020–2033
- Senegal Zirconium Market Outlook, by Product Type, 2020–2033
- Senegal Zirconium Market Outlook, by Application, 2020–2033
- Senegal Zirconium Market Outlook, by Grade, 2020–2033
- Senegal Zirconium Market Outlook, by End Use Industry, 2020–2033
- Egypt Zirconium Market Outlook, by Product Type, 2020–2033
- Egypt Zirconium Market Outlook, by Application, 2020–2033
- Egypt Zirconium Market Outlook, by Grade, 2020–2033
- Egypt Zirconium Market Outlook, by End Use Industry, 2020–2033
- Turkey Zirconium Market Outlook, by Product Type, 2020–2033
- Turkey Zirconium Market Outlook, by Application, 2020–2033
- Turkey Zirconium Market Outlook, by Grade, 2020–2033
- Turkey Zirconium Market Outlook, by End Use Industry, 2020–2033
- Saudi Arabia Zirconium Market Outlook, by Product Type, 2020–2033
- Saudi Arabia Zirconium Market Outlook, by Application, 2020–2033
- Saudi Arabia Zirconium Market Outlook, by Grade, 2020–2033
- Saudi Arabia Zirconium Market Outlook, by End Use Industry, 2020–2033
- United Arab Emirates Zirconium Market Outlook, by Product Type, 2020–2033
- United Arab Emirates Zirconium Market Outlook, by Application, 2020–2033
- United Arab Emirates Zirconium Market Outlook, by Grade, 2020–2033
- United Arab Emirates Zirconium Market Outlook, by End Use Industry, 2020–2033
- Middle East & Africa Zirconium Market Outlook, by Product Type, Value (US$ Billion), 2020–2033
- Competitive Landscape
- Market Concentration and Industry Leaders
- Competitive Differentiation
- Strategic Moves and Market Direction
- Recent Industry Developments
- Company Profiles
- Iluka Resources
- Tronox Holdings
- Rio Tinto
- Chemours
- Kenmare Resources
- Eramet
- Base Resources
- Image Resources
- Sibelco
- ATI Inc.
- Westinghouse Electric Company
- Framatome
- Saint-Gobain ZirPro
- Tosoh Corporation
- Daiichi Kigenso Kagaku Kogyo
- Guangdong Orient Zirconic Ind Sci-Tech
- Appendix
- Research Methodology
- Report Assumptions
- Acronyms and Abbreviations
Product Type
- Zircon Sand
- Zirconium Chemicals
- Zirconia (Fused & Chemical)
- Zirconium Metal & Alloys
- Hafnium & Co-Products
Application
- Ceramics & Tiles
- Refractories
- Foundry Sand
- Chemicals & Catalysts
- Nuclear Fuel Cladding
- Electronics & Advanced Ceramics
Grade
- Standard Grade
- Premium Grade
- Chemical Grade
- Nuclear Grade
End Use Industry
- Construction
- Power Generation
- Metallurgy & Foundry
- Chemicals & Petrochemicals
- Electronics & Semiconductors
- Healthcare
Regions
- North America
- Europe
- Asia Pacific
- Latin America
- Middle East & Africa
Our Research Methodology
Considering the volatility of business today, traditional approaches to strategizing a game plan can be unfruitful if not detrimental. True ambiguity is no way to determine a forecast. A myriad of predetermined factors must be accounted for such as the degree of risk involved, the magnitude of circumstances, as well as conditions or consequences that are not known or unpredictable. To circumvent binary views that cast uncertainty, the application of market research intelligence to strategically posture, move, and enable actionable outcomes is necessary.
View Methodology
Quality Assured
Rigorous Validation Process

Confidentiality Assured
End-to-end Data Security

Custom Research Services
Tailored To Your Objectives
FAQs
The market is valued at US$ 4.5 billion in 2026, covering zircon sand, zirconium chemicals, zirconia, metal and alloys, and hafnium co-products.
It is projected to reach US$ 6.5 billion by 2033 at a 5.4% CAGR, representing US$ 2.0 billion of absolute dollar opportunity.
Zircon Sand leads with 44% share in 2026, because it is the feedstock for every downstream route and is consumed directly in ceramics.
Nuclear Grade grows fastest at an 8.5% CAGR, since cladding requires hafnium removed to a few parts per million at very few plants.
Asia Pacific holds 47% share in 2026, combining Australian mine supply with Chinese ceramic, refractory and chemical conversion demand.
Related Reports
Expanded Metal Foils Market Size, Share, Insights, Competitive Landscape, and Forecast 2026 to 2033
The global expanded metal foils market is valued at US$0.5 billion in 2026, reaching US$0.9 billion by 2033, growing at an 8.8% CAGR
Precision Stainless Steel Market Size, Share, Insights, Competitive Landscape, and Forecast 2026 to 2033
The global precision stainless steel market is valued at US$9.8 billion in 2026, reaching US$15.7 billion by 2033, growing at a 6.96% CAGR
Multi-mode Receiver Market Insights, Competitive Landscape, and Market Forecast 2033
Multi-Mode Receiver Market is projected to reach US$2.18 billion by 2033, driven by aircraft modernization, navigation mandates and fleet expansion
Finished Lubricants Market Insights, Competitive Landscape, and Market Forecast 2026–2033
Finished Lubricants Market is projected to reach US$253.02 billion by 2033, driven by automotive growth, industrialization and stricter emissions standards
Discrete Capacitor Market Insights, Competitive Landscape, and Market Forecast 2026–2033
Discrete Capacitor Market is projected to reach US$32.51 billion by 2033, driven by EV production, AI infrastructure, semiconductor manufacturing
Polishing and Finishing Machine Market Insights, Competitive Landscape, and Market Forecast 2033
Polishing and Finishing Machine Market to reach US$7.41 Bn by 2033 at 3.3% CAGR, driven by EVs, semiconductors, automation, and precision manufacturing.