



Affiliate Software Market
Affiliate Software Market Size, Share, Insights, Competitive Landscape, and Forecast 2026 to 2033
Report Overview
Affiliate Software Market Size and Trend Analysis
What Is Driving Demand for Affiliate Software?
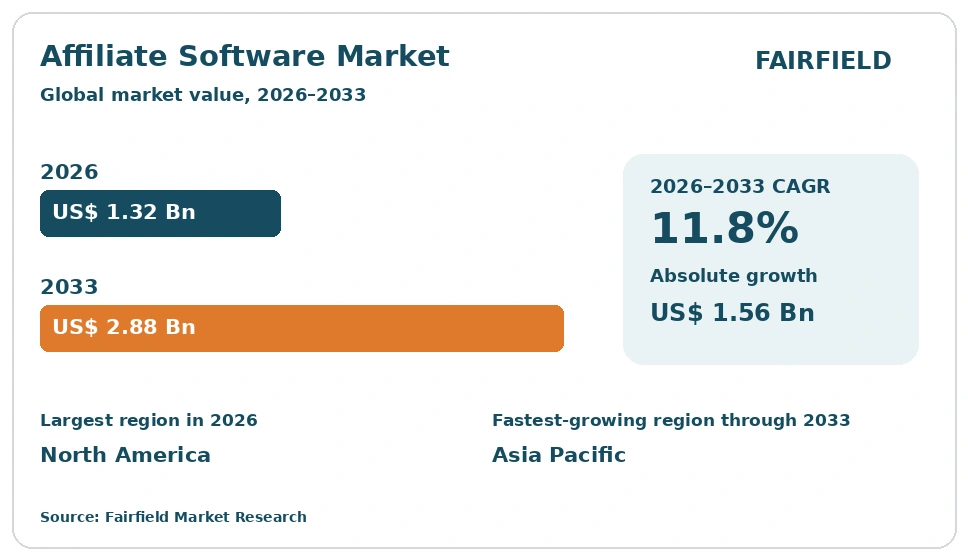
The global Affiliate Software market size is expected to be valued at US$ 1.32 billion in 2026 and projected to reach US$ 2.88 billion by 2033, growing at a CAGR of 11.8% between 2026 and 2033. Growth is tied to the move of advertising budgets into payment models that settle only after a sale, lead or approved application. Brands now run far larger partner rosters, spanning content sites, loyalty apps, creators and business resellers, and need software to track, verify and pay them. Historical expansion was quicker, at a 13.6% CAGR between 2020 and 2025, as online retail scaled. The absolute dollar opportunity over the forecast period stands at US$ 1.56 billion.
Key Report Takeaways
- By Component: Software platforms led with 72.5% share in 2026, while services are projected to expand at a 12.9% CAGR through 2033, driven by brand demand for platform migration, program audits and outsourced partner recruitment as teams move management in-house.
- By Application: Tracking and attribution led with 30.8% share in 2026, while fraud detection and prevention is projected to expand at a 15.2% CAGR through 2033, driven by coupon abuse, cookie stuffing and automated traffic inside high-payout acquisition programs.
- By Enterprise Size: Large enterprises led with 61.3% share in 2026, while small and medium enterprises are projected to expand at a 13.4% CAGR through 2033, driven by low-cost subscription tiers that install directly onto mainstream storefront and subscription billing systems.
- By End User: Retail and e-commerce led with 34.6% share in 2026, while BFSI is projected to expand at a 14.1% CAGR through 2033, driven by card, lending and insurance programs that pay partners only for verified and approved applications.
- By Region: North America led with 38.6% share in 2026, while Asia Pacific is projected to expand at a 15.1% CAGR through 2033; Europe, Latin America and Middle East & Africa add volume as cross-border marketplaces widen their publisher and reseller networks.
Market Trends and Insights
Market Growth Drivers
Performance-Based Budgets Shift Spending Toward Partner Channels
Marketers under pressure to prove return are moving budget out of upfront media buys and into payouts released only after a tracked sale or qualified lead. That shift makes partner tracking software a condition of spending rather than an optional add-on. A brand that once used a handful of coupon publishers may now manage hundreds of partners on separate commission terms. Spreadsheet management breaks at that scale, so retailers and subscription businesses buy platforms that record clicks, match orders and release commissions automatically.
Behind this sits the move of program management from agencies into brand teams. In-house managers ask for partner-level reporting, tiered payout rules and clean handoff into finance and tax systems. Vendors have answered with self-serve partner portals, program templates and interfaces that connect to storefront, billing and customer data systems, shortening the work needed to launch a program.
Creator and Business Partnerships Widen the Addressable Program Base
Affiliate software is no longer bought only by online retailers. Software firms now pay resellers, referral partners and integration partners through the same tracking and commission engines, while creators are recruited on revenue share instead of flat sponsorship fees. Each new partner type adds seats, tracked links and payout volume, which lifts platform spending per customer. The result is a wider buyer base that includes business software vendors, financial services brands, travel suppliers and marketplaces, not just consumer goods sellers.
This broadening is visible in product direction. Platforms have added partner relationship features such as tiered onboarding, deal registration, co-branded assets and training content that suit indirect sales teams. Creator-focused tools handle product gifting, promotion codes and content approvals. Vendors that started in one model are extending into the other, since both rely on the same tracking, attribution and payment core and the same compliance checks.
Restraints Impact Analysis of Market
Attribution Gaps and Signal Loss Undercut Measurement Confidence
Measurement reliability is the most common reason programs stall. Third-party cookie restrictions, mobile tracking limits, ad blockers and privacy rules such as the General Data Protection Regulation have weakened the click-to-conversion link that affiliate billing depends on. When a brand cannot prove which partner influenced a purchase, it disputes invoices, trims payouts or delays renewal of the platform contract. Buyers also hesitate when affiliate reporting conflicts with their web analytics numbers.
Vendors are working around the problem with server-side tracking, first-party domains, coupon and promotion code matching and conversion feeds posted directly from order systems. These methods demand engineering time from the customer, which slows deployment in firms with small technical teams. Multi-touch credit across paid search, email and partner traffic remains contested, and the lack of a shared standard keeps buyers cautious about larger budgets.
Fraud Exposure and Compliance Duties Raise the Cost of Ownership
Partner channels attract abuse because payment follows a measurable action. Cookie stuffing, forced clicks, trademark bidding on brand terms, unauthorised discount codes, fake lead submissions and bot-driven installs all drain budget and damage brand standing. Policing this work requires staff, monitoring tools and partner contracts, which adds cost beyond the software subscription. Firms that have been burned once often cap program spending, and that caution limits seat expansion and feature upsell for platform vendors.
Compliance duties compound the burden. Brands must handle consent collection, data processing terms and disclosure rules covering paid endorsement, and they remain answerable for how partners present offers. Regulated sectors such as lending, insurance and gaming face added review of partner claims and creative assets. Buyers now expect vendors to supply audit trails, partner vetting, takedown workflows and regional data handling options, which lengthens procurement cycles and raises the engineering cost of serving smaller accounts.
Market Opportunities
Payout Automation and Global Settlement Open New Revenue
Paying partners is the part of program operations that most brands still handle manually, and it is where vendors can earn beyond the subscription. Programs that span many countries face varied tax forms, minimum thresholds, currency conversion and local payment methods. Platforms that calculate commissions, collect tax documents, net invoices and release funds in local currency replace finance work the customer dislikes. That service supports usage-based pricing on payout volume, which grows as the program grows rather than at contract renewal.
Adoption is helped by the spread of mass payout infrastructure and faster cross-border settlement rails. Vendors are embedding wallet balances, scheduled payment runs, split commissions for sub-affiliates and self-serve tax onboarding for partners. Finance teams gain reconciliation files that match their ledgers. For smaller merchants, bundled payouts remove the main barrier to recruiting partners abroad and widen the pool of programs a platform can serve.
AI-Assisted Partner Discovery and Fraud Scoring Create Upsell Room
The clearest near-term product opportunity is applying machine learning to partner selection and quality control. Brands struggle to find partners whose audience matches their category, and they struggle to spot the small share of partners responsible for most invalid traffic. Models trained on click patterns, device signals, content relevance and conversion quality can rank prospects, flag suspect activity before payment and recommend commission rates by partner tier. These features sit naturally in a premium plan priced above core tracking.
Supporting activity is already visible in product roadmaps across the sector. Vendors are adding content scanning to check disclosure and brand term compliance, forecasting tools that estimate payout liability, and assistants that draft partner outreach and campaign briefs. Because the same event data feeds both discovery and fraud scoring, vendors can build once and sell twice, improving margins while lowering the manual review load carried by customer program teams.
Category-wise Insights
Software Platforms Anchor Spending While Services Scale Faster
Software platforms accounted for 72.5% of market value in 2026, as the tracking, attribution and commission engine is the irreplaceable part of any program. Subscription licensing, tiered partner seats and payout volume fees keep this share steady. Services are the faster mover, projected to grow at a 12.9% CAGR between 2026 and 2033, because brands bringing programs in-house need migration help, tracking audits and partner recruitment support they cannot staff internally.
The split reflects how programs are bought. Technical teams evaluate tracking accuracy, data residency options and integration depth, while program owners buy onboarding and strategy hours separately. Vendors increasingly package implementation, partner discovery and compliance reviews as repeatable offerings rather than custom consulting. For the wider market, the service attachment lifts revenue per customer and improves retention, since a well-configured program is far less likely to be replaced at renewal.
Which Application Segment Holds the Largest Market Share?
Tracking and attribution holds the largest application share at 30.8% in 2026, because every program must first prove which partner produced the order. Commission and payout management follows at 22.6%, partner recruitment and onboarding at 19.4%, fraud detection and prevention at 14.7%, and reporting and analytics at 12.5%. Fraud detection and prevention is the fastest-growing application, projected at a 15.2% CAGR between 2026 and 2033.
The growth gap comes from where the pain now sits. Tracking is mature and widely available, so it competes on reliability and price. Fraud control is less standardised, harder to build and directly linked to money saved, which supports premium pricing. Server-side conversion feeds and privacy rules have also pushed vendors to rebuild measurement, and quality scoring is being folded into that work. The effect is a market where differentiation moves from counting clicks to validating them.
Large Enterprises Spend More While Smaller Firms Adopt Faster
Large enterprises held 61.3% of spending in 2026, reflecting multi-country programs, large partner rosters, custom integrations and procurement requirements that favour enterprise contracts. These buyers pay for data controls, audit trails, dedicated support and connections into finance and customer data systems. Small and medium enterprises are growing faster, at a 13.4% CAGR between 2026 and 2033, as entry-level plans install directly onto mainstream storefronts and subscription billing tools.
Two product strategies follow from this split. Enterprise vendors invest in governance, partner compliance and global payout coverage, where switching costs are high and deals are large. Self-serve vendors compete on setup time, app marketplace distribution and transparent pricing. For the broader market, the smaller-firm tier matters because it builds the habit of paying partners on performance, creating a steady pipeline of accounts that later need enterprise features.
Retail Leads Adoption as Financial Services Programs Expand
Retail and e-commerce accounted for 34.6% of demand in 2026, the natural home of coupon, cashback, content and comparison partners, with clear order values and simple commission logic. BFSI follows at 15.8%, travel and hospitality at 13.2%, media and entertainment at 12.4%, telecom and IT at 11.5%, healthcare at 6.2%, and other sectors at 6.3%. BFSI is the fastest-growing end user, at a 14.1% CAGR between 2026 and 2033.
Financial services programs pay for approved applications rather than clicks, so they need stronger validation, longer attribution windows and tight control of partner claims. That demand pushes vendors to add lead quality scoring, creative approval and record keeping suited to regulated selling. Travel and subscription media follow similar paths with delayed or recurring payouts. The shift widens the market beyond consumer goods and raises the technical bar for every vendor serving these accounts.
Geography Analysis
Which Region Is Leading the Affiliate Software Market?
North America leads the market with 38.6% share in 2026, supported by the United States and Canada. The region hosts the deepest publisher ecosystem, including cashback, loyalty, coupon and large editorial commerce operations, which gives brands a ready supply of partners. Mature online retail, high card penetration and established subscription businesses make performance payouts routine budget items. Growth is steadier at a 10.0% CAGR between 2026 and 2033, reflecting an installed base that is replacing or consolidating platforms rather than starting first programs. Disclosure rules covering paid endorsement and state privacy statutes have pushed buyers toward vendors with audit trails, consent handling and partner compliance monitoring, which favours established platforms over basic tracking tools.
Privacy Rules and Cross-Border Retail Shape European Demand
Europe holds 27.4% share in 2026 and is set to grow at a 10.8% CAGR through 2033, led by the United Kingdom, Germany, France, the Netherlands and the Nordic markets. The region’s strength comes from long-established publisher networks and heavy cross-border selling inside the single market, which requires multi-currency commissions and local payment handling. The General Data Protection Regulation and consent requirements have made server-side tracking and clear data processing terms a purchase condition, lifting demand for platforms with regional hosting. Retail media growth and the spread of marketplace selling are pulling more mid-sized brands into managed programs, while advertising standards bodies keep pressure on disclosure practices across publisher and creator partners.
Which Region Is Growing Fastest in the Affiliate Software Market?
Asia Pacific is the fastest-growing region, projected at a 15.1% CAGR between 2026 and 2033 from 23.1% share in 2026. Growth is driven by China, India, Japan, South Korea, Australia and the ASEAN markets, where mobile commerce, social selling and super-app ecosystems create large partner populations outside traditional web publishing. Rapid smartphone adoption and fast digital payment rails make small, frequent payouts practical. Local marketplaces and travel platforms run reseller and referral schemes at scale, while regional brands expanding across borders need multi-currency, multi-language program tools. Rising data protection rules in several economies are pushing buyers toward platforms offering in-region hosting and documented consent handling.
Marketplace and Fintech Growth Lift Adoption Across Latin America
Latin America accounts for 6.2% share in 2026 and is projected to grow at a 12.6% CAGR through 2033, with Brazil and Mexico contributing most of the activity. Marketplace-led online retail, strong creator culture and the spread of instant payment systems have made commission-based promotion practical for mid-sized sellers. Fintech brands use partner programs to acquire card and credit customers at controlled cost. Adoption is helped by regional payout coverage and Portuguese and Spanish partner portals, which lower the barrier for local publishers. Currency volatility and uneven logistics still cap program budgets, so buyers favour self-serve pricing over long enterprise commitments.
E-Commerce Build-Out Supports Early Adoption in Middle East and Africa
Middle East & Africa holds 4.7% share in 2026 with a projected 11.8% CAGR through 2033, concentrated in the United Arab Emirates, Saudi Arabia, Egypt, Nigeria and South Africa. National digital economy programs and heavy investment in logistics and payment infrastructure are moving retail online, which creates the order volume that partner programs need. Travel, telecom and fintech brands are early adopters, using publishers and creators to reach young, mobile-first audiences. Mobile money and card-on-delivery practices shape how conversions are confirmed and paid. Data protection laws introduced across several markets are raising interest in platforms with documented consent and hosting options.
Competitive Landscape
The market is moderately fragmented. A group of established networks and platforms serves global brands, while dozens of specialist vendors target single niches such as subscription commerce, mobile apps, business software resellers or regional publisher networks. Buyers can choose a managed network with an attached publisher base or licence software and recruit partners themselves, and that choice keeps pricing competitive. Consolidation has gradually pulled tracking, partner management and payouts under single owners, which signals a shift from point tools toward program operating systems.
Product competition centres on measurement integrity, integration depth and payout reach. Vendors differentiate through server-side and first-party tracking, promotion code attribution, flexible commission rules, partner portals and the breadth of connectors into commerce, billing and customer data systems. Global payout coverage, tax document collection and multi-currency settlement have become strong selling points. Newer entrants compete on setup speed and app marketplace distribution, pressuring incumbents on both price and time to value, particularly among smaller merchants.
Strategic activity concentrates on filling capability gaps rather than buying scale alone. Vendors extend from affiliate tracking into partner relationship management to reach business software sellers, add fraud scoring to protect payout budgets, and build creator tools to capture social commerce spending. Investment in application programming interfaces matters competitively because it determines how easily a platform embeds in a customer’s existing systems, which in turn raises switching costs and supports renewals.
The direction of competition is toward unified partner operations covering discovery, contracting, tracking, compliance and payment in one workflow, with machine learning applied to quality control. Data residency choices, documented consent handling and transparent reporting are becoming baseline expectations rather than premium features across every vendor tier.
Industry Leaders
- impact.com
- Awin AG
- Rakuten Advertising
- CJ Affiliate
- Partnerize
- PartnerStack
- Impartner
Companies Covered in the Report
- impact.com
- Awin AG
- Rakuten Advertising
- CJ Affiliate
- Partnerize
- PartnerStack
- Impartner
- ZINFI Technologies
- Everflow
- TUNE
- Affise
- Trackier
- Refersion
- Tapfiliate
- Post Affiliate Pro
Affiliate Software Market Report Scope
The market is segmented by component, application, enterprise size, end user and region.
| By Component | Software, Services |
| By Application | Tracking and Attribution, Commission and Payout Management, Partner Recruitment and Onboarding, Fraud Detection and Prevention, Reporting and Analytics |
| By Enterprise Size | Large Enterprises, Small and Medium Enterprises |
| By End User | Retail and E-commerce, BFSI, Travel and Hospitality, Media and Entertainment, Telecom and IT, Healthcare, Others |
| By Region | North America, Europe, Asia Pacific, Latin America, Middle East & Africa |
1. Executive Summary
1.1 Affiliate Software Market Snapshot
1.2 Future Projections
1.3 Key Industry Highlights
1.4 Geographical Snapshot
2. Market Overview
2.1 Market Definition and Segmentation
2.2 Historical Market Trends
2.3 Market Dynamics
2.3.1 Drivers
2.3.1.1 Performance-Based Budgets Shift Spending Toward Partner Channels
2.3.1.2 Creator and Business Partnerships Widen the Addressable Program Base
2.3.2 Restraints
2.3.2.1 Attribution Gaps and Signal Loss Undercut Measurement Confidence
2.3.2.2 Fraud Exposure and Compliance Duties Raise the Cost of Ownership
2.3.3 Market Opportunities
2.3.3.1 Payout Automation and Global Settlement Open New Revenue
2.3.3.2 AI-Assisted Partner Discovery and Fraud Scoring Create Upsell Room
3. Global Affiliate Software Market Outlook, 2026–2033
3.1 Global Affiliate Software Market Outlook, by Component, Value (US$ Billion), 2026–2033
3.1.1 Software
3.1.2 Services
3.2 Global Affiliate Software Market Outlook, by Application, Value (US$ Billion), 2026–2033
3.2.1 Tracking and Attribution
3.2.2 Commission and Payout Management
3.2.3 Partner Recruitment and Onboarding
3.2.4 Fraud Detection and Prevention
3.2.5 Reporting and Analytics
3.3 Global Affiliate Software Market Outlook, by Enterprise Size, Value (US$ Billion), 2026–2033
3.3.1 Large Enterprises
3.3.2 Small and Medium Enterprises
3.4 Global Affiliate Software Market Outlook, by End User, Value (US$ Billion), 2026–2033
3.4.1 Retail and E-commerce
3.4.2 BFSI
3.4.3 Travel and Hospitality
3.4.4 Media and Entertainment
3.4.5 Telecom and IT
3.4.6 Healthcare
3.4.7 Others
3.5 Global Affiliate Software Market Outlook, by Region, Value (US$ Billion), 2026–2033
3.5.1 North America
3.5.2 Europe
3.5.3 Asia Pacific
3.5.4 Latin America
3.5.5 Middle East & Africa
4. North America Affiliate Software Market Outlook, 2026–2033
4.1 North America Affiliate Software Market Outlook, by Component, Value (US$ Billion), 2026–2033
4.1.1 Software
4.1.2 Services
4.2 North America Affiliate Software Market Outlook, by Application, Value (US$ Billion), 2026–2033
4.2.1 Tracking and Attribution
4.2.2 Commission and Payout Management
4.2.3 Partner Recruitment and Onboarding
4.2.4 Fraud Detection and Prevention
4.2.5 Reporting and Analytics
4.3 North America Affiliate Software Market Outlook, by Enterprise Size, Value (US$ Billion), 2026–2033
4.3.1 Large Enterprises
4.3.2 Small and Medium Enterprises
4.4 North America Affiliate Software Market Outlook, by End User, Value (US$ Billion), 2026–2033
4.4.1 Retail and E-commerce
4.4.2 BFSI
4.4.3 Travel and Hospitality
4.4.4 Media and Entertainment
4.4.5 Telecom and IT
4.4.6 Healthcare
4.4.7 Others
4.5 North America Affiliate Software Market Outlook, by Country, Value (US$ Billion), 2026–2033
4.5.1 United States Affiliate Software Market Outlook, by Component, 2026–2033
4.5.2 United States Affiliate Software Market Outlook, by Application, 2026–2033
4.5.3 United States Affiliate Software Market Outlook, by Enterprise Size, 2026–2033
4.5.4 United States Affiliate Software Market Outlook, by End User, 2026–2033
4.5.5 Canada Affiliate Software Market Outlook, by Component, 2026–2033
4.5.6 Canada Affiliate Software Market Outlook, by Application, 2026–2033
4.5.7 Canada Affiliate Software Market Outlook, by Enterprise Size, 2026–2033
4.5.8 Canada Affiliate Software Market Outlook, by End User, 2026–2033
5. Europe Affiliate Software Market Outlook, 2026–2033
5.1 Europe Affiliate Software Market Outlook, by Component, Value (US$ Billion), 2026–2033
5.1.1 Software
5.1.2 Services
5.2 Europe Affiliate Software Market Outlook, by Application, Value (US$ Billion), 2026–2033
5.2.1 Tracking and Attribution
5.2.2 Commission and Payout Management
5.2.3 Partner Recruitment and Onboarding
5.2.4 Fraud Detection and Prevention
5.2.5 Reporting and Analytics
5.3 Europe Affiliate Software Market Outlook, by Enterprise Size, Value (US$ Billion), 2026–2033
5.3.1 Large Enterprises
5.3.2 Small and Medium Enterprises
5.4 Europe Affiliate Software Market Outlook, by End User, Value (US$ Billion), 2026–2033
5.4.1 Retail and E-commerce
5.4.2 BFSI
5.4.3 Travel and Hospitality
5.4.4 Media and Entertainment
5.4.5 Telecom and IT
5.4.6 Healthcare
5.4.7 Others
5.5 Europe Affiliate Software Market Outlook, by Country, Value (US$ Billion), 2026–2033
5.5.1 United Kingdom Affiliate Software Market Outlook, by Component, 2026–2033
5.5.2 United Kingdom Affiliate Software Market Outlook, by Application, 2026–2033
5.5.3 United Kingdom Affiliate Software Market Outlook, by Enterprise Size, 2026–2033
5.5.4 United Kingdom Affiliate Software Market Outlook, by End User, 2026–2033
5.5.5 Germany Affiliate Software Market Outlook, by Component, 2026–2033
5.5.6 Germany Affiliate Software Market Outlook, by Application, 2026–2033
5.5.7 Germany Affiliate Software Market Outlook, by Enterprise Size, 2026–2033
5.5.8 Germany Affiliate Software Market Outlook, by End User, 2026–2033
5.5.9 France Affiliate Software Market Outlook, by Component, 2026–2033
5.5.10 France Affiliate Software Market Outlook, by Application, 2026–2033
5.5.11 France Affiliate Software Market Outlook, by Enterprise Size, 2026–2033
5.5.12 France Affiliate Software Market Outlook, by End User, 2026–2033
5.5.13 Netherlands Affiliate Software Market Outlook, by Component, 2026–2033
5.5.14 Netherlands Affiliate Software Market Outlook, by Application, 2026–2033
5.5.15 Netherlands Affiliate Software Market Outlook, by Enterprise Size, 2026–2033
5.5.16 Netherlands Affiliate Software Market Outlook, by End User, 2026–2033
6. Asia Pacific Affiliate Software Market Outlook, 2026–2033
6.1 Asia Pacific Affiliate Software Market Outlook, by Component, Value (US$ Billion), 2026–2033
6.1.1 Software
6.1.2 Services
6.2 Asia Pacific Affiliate Software Market Outlook, by Application, Value (US$ Billion), 2026–2033
6.2.1 Tracking and Attribution
6.2.2 Commission and Payout Management
6.2.3 Partner Recruitment and Onboarding
6.2.4 Fraud Detection and Prevention
6.2.5 Reporting and Analytics
6.3 Asia Pacific Affiliate Software Market Outlook, by Enterprise Size, Value (US$ Billion), 2026–2033
6.3.1 Large Enterprises
6.3.2 Small and Medium Enterprises
6.4 Asia Pacific Affiliate Software Market Outlook, by End User, Value (US$ Billion), 2026–2033
6.4.1 Retail and E-commerce
6.4.2 BFSI
6.4.3 Travel and Hospitality
6.4.4 Media and Entertainment
6.4.5 Telecom and IT
6.4.6 Healthcare
6.4.7 Others
6.5 Asia Pacific Affiliate Software Market Outlook, by Country, Value (US$ Billion), 2026–2033
6.5.1 China Affiliate Software Market Outlook, by Component, 2026–2033
6.5.2 China Affiliate Software Market Outlook, by Application, 2026–2033
6.5.3 China Affiliate Software Market Outlook, by Enterprise Size, 2026–2033
6.5.4 China Affiliate Software Market Outlook, by End User, 2026–2033
6.5.5 India Affiliate Software Market Outlook, by Component, 2026–2033
6.5.6 India Affiliate Software Market Outlook, by Application, 2026–2033
6.5.7 India Affiliate Software Market Outlook, by Enterprise Size, 2026–2033
6.5.8 India Affiliate Software Market Outlook, by End User, 2026–2033
6.5.9 Japan Affiliate Software Market Outlook, by Component, 2026–2033
6.5.10 Japan Affiliate Software Market Outlook, by Application, 2026–2033
6.5.11 Japan Affiliate Software Market Outlook, by Enterprise Size, 2026–2033
6.5.12 Japan Affiliate Software Market Outlook, by End User, 2026–2033
6.5.13 South Korea Affiliate Software Market Outlook, by Component, 2026–2033
6.5.14 South Korea Affiliate Software Market Outlook, by Application, 2026–2033
6.5.15 South Korea Affiliate Software Market Outlook, by Enterprise Size, 2026–2033
6.5.16 South Korea Affiliate Software Market Outlook, by End User, 2026–2033
6.5.17 Australia Affiliate Software Market Outlook, by Component, 2026–2033
6.5.18 Australia Affiliate Software Market Outlook, by Application, 2026–2033
6.5.19 Australia Affiliate Software Market Outlook, by Enterprise Size, 2026–2033
6.5.20 Australia Affiliate Software Market Outlook, by End User, 2026–2033
7. Latin America Affiliate Software Market Outlook, 2026–2033
7.1 Latin America Affiliate Software Market Outlook, by Component, Value (US$ Billion), 2026–2033
7.1.1 Software
7.1.2 Services
7.2 Latin America Affiliate Software Market Outlook, by Application, Value (US$ Billion), 2026–2033
7.2.1 Tracking and Attribution
7.2.2 Commission and Payout Management
7.2.3 Partner Recruitment and Onboarding
7.2.4 Fraud Detection and Prevention
7.2.5 Reporting and Analytics
7.3 Latin America Affiliate Software Market Outlook, by Enterprise Size, Value (US$ Billion), 2026–2033
7.3.1 Large Enterprises
7.3.2 Small and Medium Enterprises
7.4 Latin America Affiliate Software Market Outlook, by End User, Value (US$ Billion), 2026–2033
7.4.1 Retail and E-commerce
7.4.2 BFSI
7.4.3 Travel and Hospitality
7.4.4 Media and Entertainment
7.4.5 Telecom and IT
7.4.6 Healthcare
7.4.7 Others
7.5 Latin America Affiliate Software Market Outlook, by Country, Value (US$ Billion), 2026–2033
7.5.1 Brazil Affiliate Software Market Outlook, by Component, 2026–2033
7.5.2 Brazil Affiliate Software Market Outlook, by Application, 2026–2033
7.5.3 Brazil Affiliate Software Market Outlook, by Enterprise Size, 2026–2033
7.5.4 Brazil Affiliate Software Market Outlook, by End User, 2026–2033
7.5.5 Mexico Affiliate Software Market Outlook, by Component, 2026–2033
7.5.6 Mexico Affiliate Software Market Outlook, by Application, 2026–2033
7.5.7 Mexico Affiliate Software Market Outlook, by Enterprise Size, 2026–2033
7.5.8 Mexico Affiliate Software Market Outlook, by End User, 2026–2033
8. Middle East & Africa Affiliate Software Market Outlook, 2026–2033
8.1 Middle East & Africa Affiliate Software Market Outlook, by Component, Value (US$ Billion), 2026–2033
8.1.1 Software
8.1.2 Services
8.2 Middle East & Africa Affiliate Software Market Outlook, by Application, Value (US$ Billion), 2026–2033
8.2.1 Tracking and Attribution
8.2.2 Commission and Payout Management
8.2.3 Partner Recruitment and Onboarding
8.2.4 Fraud Detection and Prevention
8.2.5 Reporting and Analytics
8.3 Middle East & Africa Affiliate Software Market Outlook, by Enterprise Size, Value (US$ Billion), 2026–2033
8.3.1 Large Enterprises
8.3.2 Small and Medium Enterprises
8.4 Middle East & Africa Affiliate Software Market Outlook, by End User, Value (US$ Billion), 2026–2033
8.4.1 Retail and E-commerce
8.4.2 BFSI
8.4.3 Travel and Hospitality
8.4.4 Media and Entertainment
8.4.5 Telecom and IT
8.4.6 Healthcare
8.4.7 Others
8.5 Middle East & Africa Affiliate Software Market Outlook, by Country, Value (US$ Billion), 2026–2033
8.5.1 United Arab Emirates Affiliate Software Market Outlook, by Component, 2026–2033
8.5.2 United Arab Emirates Affiliate Software Market Outlook, by Application, 2026–2033
8.5.3 United Arab Emirates Affiliate Software Market Outlook, by Enterprise Size, 2026–2033
8.5.4 United Arab Emirates Affiliate Software Market Outlook, by End User, 2026–2033
8.5.5 Saudi Arabia Affiliate Software Market Outlook, by Component, 2026–2033
8.5.6 Saudi Arabia Affiliate Software Market Outlook, by Application, 2026–2033
8.5.7 Saudi Arabia Affiliate Software Market Outlook, by Enterprise Size, 2026–2033
8.5.8 Saudi Arabia Affiliate Software Market Outlook, by End User, 2026–2033
8.5.9 Egypt Affiliate Software Market Outlook, by Component, 2026–2033
8.5.10 Egypt Affiliate Software Market Outlook, by Application, 2026–2033
8.5.11 Egypt Affiliate Software Market Outlook, by Enterprise Size, 2026–2033
8.5.12 Egypt Affiliate Software Market Outlook, by End User, 2026–2033
8.5.13 Nigeria Affiliate Software Market Outlook, by Component, 2026–2033
8.5.14 Nigeria Affiliate Software Market Outlook, by Application, 2026–2033
8.5.15 Nigeria Affiliate Software Market Outlook, by Enterprise Size, 2026–2033
8.5.16 Nigeria Affiliate Software Market Outlook, by End User, 2026–2033
8.5.17 South Africa Affiliate Software Market Outlook, by Component, 2026–2033
8.5.18 South Africa Affiliate Software Market Outlook, by Application, 2026–2033
8.5.19 South Africa Affiliate Software Market Outlook, by Enterprise Size, 2026–2033
8.5.20 South Africa Affiliate Software Market Outlook, by End User, 2026–2033
9. Competitive Landscape
9.1 Industry Leaders
9.2 Company Profiles
9.2.1 impact.com
9.2.2 Awin AG
9.2.3 Rakuten Advertising
9.2.4 CJ Affiliate
9.2.5 Partnerize
9.2.6 PartnerStack
9.2.7 Impartner
9.2.8 ZINFI Technologies
9.2.9 Everflow
9.2.10 TUNE
9.2.11 Affise
9.2.12 Trackier
9.2.13 Refersion
9.2.14 Tapfiliate
9.2.15 Post Affiliate Pro
10. Appendix
10.1 Research Methodology
10.2 Report Assumptions
10.3 Acronyms and Abbreviations
| By Component | Software, Services |
| By Application | Tracking and Attribution, Commission and Payout Management, Partner Recruitment and Onboarding, Fraud Detection and Prevention, Reporting and Analytics |
| By Enterprise Size | Large Enterprises, Small and Medium Enterprises |
| By End User | Retail and E-commerce, BFSI, Travel and Hospitality, Media and Entertainment, Telecom and IT, Healthcare, Others |
| By Region | North America, Europe, Asia Pacific, Latin America, Middle East & Africa |
Our Research Methodology
Considering the volatility of business today, traditional approaches to strategizing a game plan can be unfruitful if not detrimental. True ambiguity is no way to determine a forecast. A myriad of predetermined factors must be accounted for such as the degree of risk involved, the magnitude of circumstances, as well as conditions or consequences that are not known or unpredictable. To circumvent binary views that cast uncertainty, the application of market research intelligence to strategically posture, move, and enable actionable outcomes is necessary.
View Methodology
Quality Assured
Rigorous Validation Process

Confidentiality Assured
End-to-end Data Security

Custom Research Services
Tailored To Your Objectives
FAQs
The market is valued at US$ 1.32 billion in 2026, supported by brand spending on partner tracking, commission management and payout tools across retail programs.
The market is projected to reach US$ 2.88 billion by 2033, growing at an 11.8% CAGR and adding US$ 1.56 billion in absolute dollar opportunity.
Tracking and attribution leads with 30.8% share in 2026, while fraud detection and prevention grows fastest at a 15.2% CAGR through 2033.
North America holds 38.6% share in 2026, helped by its deep publisher base, while Asia Pacific grows fastest at a 15.1% CAGR through 2033.
Key vendors include impact.com, Awin AG, Rakuten Advertising, CJ Affiliate, Partnerize, PartnerStack and Impartner, competing on tracking accuracy, integrations and payout reach.
Related Reports
Contact Center as a Service Market Size, Share, Insights, Competitive Landscape, and Forecast 2026 to 2033
Explore the contact center as a service market outlook for 2026–2033, including cloud deployment, AI tooling, regional trends, and competitive insights.
Mobile Wallet Market Size, Share, Insights, Competitive Landscape, and Forecast 2026 to 2033
The global mobile wallet market is valued at US$8.3 billion in 2026, reaching US$38.5 billion by 2033, growing at a 24.5% CAGR
Microwave Devices Market Size, Share, Insights, Competitive Landscape, and Forecast 2026 to 2033
The global microwave devices market is valued at US$8.4 billion in 2026, reaching US$14.2 billion by 2033, growing at a 7.8% CAGR
LED Drivers and Power Supplies for Horticulture Market Size, Share, Insights, Competitive Landscape, and Forecast 2026 to 2033
The global LED drivers and power supplies for horticulture market is valued at US$1.15 billion in 2026, reaching US$2.51 billion by 2033, growing at an 11.8% CAGR
Inkjet Printers Market Size, Share, Insights, Competitive Landscape, and Forecast 2026 to 2033
The global inkjet printers market is valued at US$50.4 billion in 2026, reaching US$58.8 billion by 2033, growing at a 2.2% CAGR
LED Lighting Market Size, Share, Insights, Competitive Landscape, and Forecast 2026 to 2033
The LED lighting market is projected to grow from US$84.0 billion in 2026 to US$112.0 billion by 2033 at a 4.2% CAGR. Explore segments and trends.