



Contact Center as a Service Market
Contact Center as a Service Market Size, Share, Insights, Competitive Landscape, and Forecast 2026 to 2033
Report Overview
Contact Center as a Service Market Size and Trend Analysis
What Is Driving Contact Center as a Service Market Growth?
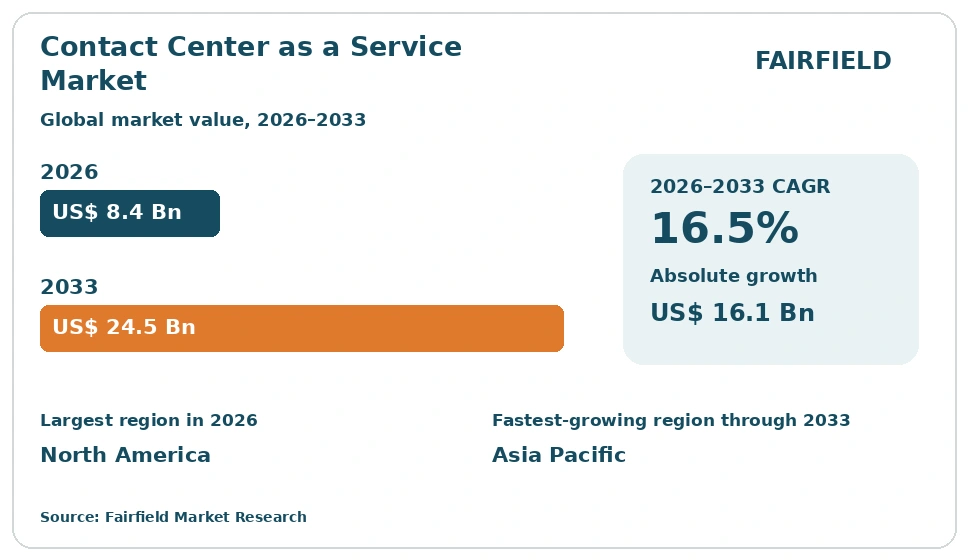
The global Contact Center as a Service market size is expected to be valued at US$ 8.4 billion in 2026 and projected to reach US$ 24.5 billion by 2033, growing at a CAGR of 16.5% between 2026 and 2033. Growth tracks a steady move away from premise switch hardware toward subscription seats that scale with contact volume. Demand is strongest in banking, retail, telecom and public services, where queues spike without warning. Buyers now want voice, chat, messaging and email on one routing engine. Between 2020 and 2025 the market grew at a CAGR of 19.8%, and the absolute dollar opportunity to 2033 is US$ 16.1 billion.
Key Report Takeaways
- By Component: Omnichannel routing led with 28.4% share in 2026, while AI-assisted agent tooling is projected to expand at a 21.3% CAGR through 2033, driven by enterprise demand for live call summarization and guided responses inside the agent desktop.
- By Deployment: Public cloud led with 58.6% share in 2026, while hybrid cloud is projected to expand at an 18.7% CAGR through 2033, driven by regulated buyers that must keep call recordings and payment data inside a national border.
- By Enterprise Size: Large enterprises led with 62.4% share in 2026, while small and medium enterprises are projected to expand at an 18.9% CAGR through 2033, driven by per-seat monthly pricing that removes the upfront build cost.
- By End Use: BFSI led with 24.7% share in 2026, while healthcare and life sciences are projected to expand at a 19.6% CAGR through 2033, driven by patient scheduling, benefit verification and triage lines moving onto cloud platforms.
- By Region: North America led with 41.8% share in 2026, ahead of Europe, Asia Pacific, Latin America and Middle East & Africa, while Asia Pacific is projected to expand at a 20.2% CAGR through 2033, driven by large outsourced service hubs.
Market Trends and Insights
Market Growth Drivers
Omnichannel Contact Volume Is Outgrowing Premise-Based Systems
Enterprises are retiring premise contact center switches because customer conversations no longer stay in one channel. A shopper may open a web chat, switch to messaging, then call the same day. Queue-based legacy systems treat each contact as separate work, so context is lost and handling time climbs. Cloud platforms route every channel through a single engine and carry conversation history with the customer, which cuts repeated effort and lifts paid seat demand.
The trend behind this is the ordinary refresh cycle. Depreciated hardware in banking, retail and telecom service desks reaches end of support, and buyers choose between fresh capital equipment and a provider contract. Most pick the provider, since capacity can be added for seasonal peaks and released afterwards. Wider use of messaging apps and in-app support has stretched the channel mix further, making single-channel estates difficult to defend at renewal.
Distributed Agent Models Favor Subscription Platforms
Hybrid and home-based agent staffing has made browser-delivered contact center software the practical default. Supervisors need one place to see queue health, adherence and quality scores for agents sitting in different cities and time zones. Premise systems tied to a building cannot do that without heavy network work. Subscription platforms deliver the same desktop anywhere with a login, so service operations can hire where labor is available rather than where a switch is installed.
Outsourced service providers have pushed this further. Business process firms run campaigns for many clients at once and need tenant separation, fast onboarding and per-seat billing that matches contract length. Cloud delivery supports all three. Workforce engagement tools built into the same platform handle forecasting, scheduling and call quality review for scattered teams. That combination turns a staffing decision into a software decision, which widens the addressable base for platform vendors.
Restraints Impact Analysis of Market
Voice Quality and Service Continuity Concerns Slow Migration
Voice remains the channel that enterprises judge a platform by, and it limits adoption when quality is uncertain. Packet loss, jitter and network congestion produce audible faults that customers notice immediately. Contact centers handling emergency calls, dispatch or high-value transactions treat any outage as a business risk, not a technical one. Those buyers delay migration, keep a premise fallback running, or move only non-voice channels first, which holds back full platform spending.
The practical issue sits in the connection between the customer site and the provider. Branch offices on shared broadband, agents on home networks and carrier handoffs across borders all add variability that a vendor cannot fully control. Providers answer with regional media points, dedicated network links and published availability commitments. Procurement teams still ask for proof during peak trading periods, and that evidence takes time to gather, which stretches sales cycles in regulated sectors.
Data Residency and Call Recording Rules Complicate Deployment
Recorded calls, transcripts and payment details make contact center data sensitive, and the rules around it restrict where workloads can run. Banks, insurers, hospitals and government bodies often must keep recordings inside a national border and control who may replay them. A single shared cloud region does not satisfy that requirement. Deals then stall while the buyer checks storage location, retention periods and access logging, which delays revenue recognition for vendors.
Consent handling adds a second layer. Many jurisdictions require callers to be told that a conversation is recorded, and some require consent before voice analysis begins. Service teams must build those prompts into call flows and prove the setting was active. Vendors respond by opening in-country data regions, offering customer-managed encryption keys and separating recording storage from the routing service. Each of those options raises implementation cost, which smaller buyers find difficult to absorb.
Market Opportunities
AI-Assisted Agent Tooling Opens a New Software Layer
Artificial intelligence inside the agent desktop creates a chargeable layer above basic routing, and that is where new revenue is forming. Vendors now offer live transcription, suggested replies, knowledge retrieval and automatic call summaries as separately licensed capability. Because these sit on conversation data the platform already holds, the incremental delivery cost is modest while the price point is higher than a standard seat. Adoption is broadening across service teams that run large contact volumes.
The enabling trend is cheaper speech recognition and language models that run at conversation speed. Quality monitoring that once sampled a small share of calls can now review every interaction and flag compliance gaps. Self-service containment improves as virtual agents understand intent rather than menu keys. Buyers still test accuracy in their own accents and vocabulary before scaling, so vendors compete on tuning tools and clear controls over model behavior.
Small and Mid-Sized Enterprises Remain Largely Unconverted
Smaller businesses still run customer contact on basic phone systems and shared mailboxes, which leaves a large untapped base for platform vendors. These firms were never served well by premise contact center products, since the license, hardware and integration cost sat far above their budget. Subscription pricing removes that barrier by charging per agent per month with no upfront build. Each conversion is small in value, but the volume of candidates is considerable.
Reaching this group calls for a different route to market. Vendors package preset call flows, templated reports and ready-made connectors to common sales and helpdesk tools so a team can go live without consultants. Telecom carriers, unified communications resellers and software marketplaces carry the product to buyers who never meet an enterprise sales team. Self-service trials and monthly contracts lower the commitment further, turning a long procurement cycle into a short sign-up.
Category-wise Insights
Which Component Segment Leads the Contact Center as a Service Market?
Omnichannel routing leads the component mix with a 28.4% share in 2026, because no deployment works without it. Every call, chat, message and email has to reach a qualified agent with history attached, so routing is bought first and replaced rarely. AI-assisted agent tooling is the growth leader, set to expand at a 21.3% CAGR between 2026 and 2033. Live transcription, suggested responses and automatic summaries attach to conversations the platform already handles, so they add license value without new infrastructure. Workforce engagement and analytics modules sell alongside both, since supervisors need forecasting and quality review in the same place. Market leadership and growth leadership sit in different layers of the stack, and vendors that own the routing engine have the shortest path to selling the newer tooling.
Public Cloud Carries Volume While Hybrid Deployments Absorb Regulated Work
Public cloud accounts for 58.6% of deployments in 2026, since shared multi-tenant delivery gives the fastest activation and the lowest entry price. Most retail, telecom and consumer service operations have no reason to hold infrastructure of their own. Hybrid cloud is the fastest-growing model at an 18.7% CAGR between 2026 and 2033, because regulated buyers split the workload. They keep routing, scheduling and analytics in the provider cloud while holding recordings, transcripts and payment data in a controlled local store. Private cloud retains a narrow role in defense, central banking and some national health systems. The practical effect is that vendors must now sell one platform in several delivery shapes, and the ability to prove data location has become a feature that closes deals.
Large Enterprises Hold the Spending While Smaller Firms Convert Faster
Large enterprises generate 62.4% of market value in 2026, against 37.6% for small and medium enterprises. Scale explains the gap. A single bank or carrier may run thousands of seats across several countries, each needing workforce management, quality review and deep integration with core systems. Small and medium enterprises are the growth leader at an 18.9% CAGR between 2026 and 2033, as per-seat monthly pricing brings contact center capability within reach of teams that previously used a business phone line and a shared inbox. Packaged call flows and prebuilt connectors to common sales and helpdesk tools remove the need for consultants. That shift changes vendor economics, pushing more revenue through carriers, resellers and online marketplaces rather than direct enterprise sales.
BFSI Sets the Service Standard That Healthcare Is Now Matching
BFSI leads end use with 24.7% share in 2026, because banks, insurers and payment firms run continuous, high-volume contact with strict identity and audit requirements. Their platforms must verify callers, record every interaction and feed case systems without manual rekeying. Healthcare and life sciences is the fastest-growing end use at a 19.6% CAGR between 2026 and 2033, as appointment scheduling, benefit verification, prescription lines and nurse triage move onto cloud platforms with controlled access to patient records. Retail and e-commerce remain large through seasonal peaks, telecom through service and billing queues, and government through citizen service lines. The common thread is regulated, auditable conversation handling, which rewards vendors able to show detailed access control and clear retention settings. Compliance depth, rather than feature count, decides most competitive evaluations in these verticals.
Geography Analysis
Which Region Is Leading the Contact Center as a Service Market?
North America leads with 41.8% share in 2026 and expands at a 14.6% CAGR to 2033. The United States contributes most of that value, with Canada adding bilingual service operations. Early cloud communications adoption, dense enterprise software spending and a deep base of outsourced service providers all support the position. Banking, insurance, telecom and large retail chains replaced premise switches ahead of other regions, so the installed base is now mature and much of the growth comes from added capability rather than first-time migration. Carrier-grade network coverage and established payment card security practice reduce the technical objections that slow deals elsewhere, and buyers add AI-assisted tooling to seats they already license.
Europe Balances Multilingual Service With Strict Data Handling Rules
Europe holds 26.3% share in 2026 and grows at a 15.8% CAGR to 2033. The United Kingdom, Germany, France, the Netherlands and Spain account for most spending. Cross-border trading means a single service desk often answers in five or more languages, which favors platforms with language-aware routing and translation support. Growth runs slightly behind North America because data protection and employee consultation requirements lengthen procurement. Buyers ask where recordings sit, who holds encryption keys and how long transcripts are retained before signing. Vendors answering with in-country data regions and clear retention controls win the regulated accounts in banking, insurance and public administration, while retail and travel operators move faster on seasonal capacity.
Which Region Is Growing Fastest in the Contact Center as a Service Market?
Asia Pacific is growing fastest at a 20.2% CAGR between 2026 and 2033, from 20.4% share in 2026. India and the Philippines host very large outsourced service operations that add cloud seats as client contracts renew. China, Japan and Australia contribute strong domestic demand from banking, telecom and digital commerce. Mobile-first customer behavior pushes messaging and in-app support volumes higher than voice in several markets, which suits platforms built around a single routing engine. Expanding data center capacity across the region lets providers place media and storage locally, answering latency and residency concerns at the same time. Rising wage costs also make self-service and automation attractive to operators.
Latin America Builds on Nearshore Service Delivery Capacity
Latin America holds 6.4% share in 2026 and grows at a 17.2% CAGR to 2033. Brazil, Mexico and Colombia lead, supported by nearshore delivery centers serving North American clients in English and Spanish. Shared time zones and lower labor cost keep those operations competitive, and cloud platforms let providers open sites quickly without local switch investment. Domestic demand is rising too, as regional banks, fintech firms, retailers and utilities move customer service away from aging equipment. Currency movement and import cost make capital purchases unattractive, which pushes buyers toward monthly subscription contracts. Improving fixed and mobile broadband quality in major cities has removed much of the earlier voice reliability objection.
Middle East & Africa Advances Through Digital Government Programs
Middle East & Africa accounts for 5.1% share in 2026 and grows at a 16.4% CAGR to 2033. The United Arab Emirates and Saudi Arabia lead spending, where national digital service programs put citizen contact lines, utilities and banking support onto modern platforms. South Africa anchors demand further south and hosts outsourced delivery work for European clients. Arabic and multilingual routing, along with local data hosting, are decisive in public sector tenders. New cloud regions opened by hyperscale operators in the Gulf have made in-country deployment practical for banks and government bodies. Elsewhere on the continent, mobile money and telecom support queues drive the first wave of cloud contact center adoption.
Competitive Landscape
The market is moderately concentrated. A small group of specialist platform vendors holds the large multinational deployments, while a wider field of unified communications providers, cloud operators and regional specialists competes below that tier. Positions are not fixed. Established suppliers with premise heritage are converting their installed base to subscription, cloud infrastructure operators are selling contact center services directly to their existing customers, and communications platform firms are moving up from programmable voice into complete agent desktops. Consolidation continues as larger vendors buy workforce engagement, analytics and speech capability rather than build it, which signals a market shifting from telephony replacement toward customer operations software.
Competition now turns on four things. The first is routing depth, meaning how well one engine handles voice, chat, messaging, email and social contacts with shared context. The second is integration breadth, since buyers judge platforms by how cleanly they connect to CRM, helpdesk, billing and identity systems. The third is embedded automation, covering virtual agents, live transcription, agent assistance and automated quality review. The fourth is compliance posture, including data residency options, encryption key control and recording retention settings. New entrants built around conversational automation matter because they attack the self-service layer where contact volume is removed before an agent is involved.
Strategic activity follows those pressures. Vendors extend regional data center coverage to win regulated accounts, acquire adjacent capability to close functional gaps, and build partner programs with carriers and resellers to reach smaller buyers at lower cost. Open application interfaces and prebuilt connector catalogs are treated as competitive assets, because they shorten implementation and raise switching cost. Fairfield Market Research observes that vendor strategy is converging on a single theme: owning the full customer conversation, from first self-service contact through agent handling to post-call analysis, rather than selling routing alone.
Industry Leaders
- Genesys
- NICE Ltd.
- Five9
- Talkdesk
- Amazon Web Services
- Cisco Systems
- Avaya
- 8x8
Companies Covered in the Report
- Genesys
- NICE Ltd.
- Five9
- Talkdesk
- Amazon Web Services
- Cisco Systems
- Avaya
- 8x8
- RingCentral
- Twilio
- Vonage
- Zoom Communications
- Dialpad
- Content Guru
- Verint Systems
Contact Center as a Service Market Report Scope
The market is segmented by component, deployment, enterprise size, end use and region.
| By Component | Omnichannel Routing, Interactive Voice Response and Self-Service, Workforce Engagement Management, Analytics and Reporting, AI-Assisted Agent Tooling, Professional and Managed Services |
| By Deployment | Public Cloud, Private Cloud, Hybrid Cloud |
| By Enterprise Size | Large Enterprises, Small and Medium Enterprises |
| By End Use | BFSI, Retail and E-commerce, Telecom and IT, Healthcare and Life Sciences, Government and Public Sector, Travel and Hospitality, Others |
| By Region | North America, Europe, Asia Pacific, Latin America, Middle East & Africa |
1. Executive Summary
1.1 Contact Center as a Service Market Snapshot
1.2 Future Projections
1.3 Key Industry Highlights
1.4 Geographical Snapshot
2. Market Overview
2.1 Market Definition and Segmentation
2.2 Historical Market Trends
2.3 Market Dynamics
2.3.1 Drivers
2.3.1.1 Omnichannel Contact Volume Is Outgrowing Premise-Based Systems
2.3.1.2 Distributed Agent Models Favor Subscription Platforms
2.3.2 Restraints
2.3.2.1 Voice Quality and Service Continuity Concerns Slow Migration
2.3.2.2 Data Residency and Call Recording Rules Complicate Deployment
2.3.3 Market Opportunities
2.3.3.1 AI-Assisted Agent Tooling Opens a New Software Layer
2.3.3.2 Small and Mid-Sized Enterprises Remain Largely Unconverted
3. Global Contact Center as a Service Market Outlook, 2026–2033
3.1 Global Contact Center as a Service Market Outlook, by Component, Value (US$ Billion), 2026–2033
3.1.1 Omnichannel Routing
3.1.2 Interactive Voice Response and Self-Service
3.1.3 Workforce Engagement Management
3.1.4 Analytics and Reporting
3.1.5 AI-Assisted Agent Tooling
3.1.6 Professional and Managed Services
3.2 Global Contact Center as a Service Market Outlook, by Deployment, Value (US$ Billion), 2026–2033
3.2.1 Public Cloud
3.2.2 Private Cloud
3.2.3 Hybrid Cloud
3.3 Global Contact Center as a Service Market Outlook, by Enterprise Size, Value (US$ Billion), 2026–2033
3.3.1 Large Enterprises
3.3.2 Small and Medium Enterprises
3.4 Global Contact Center as a Service Market Outlook, by End Use, Value (US$ Billion), 2026–2033
3.4.1 BFSI
3.4.2 Retail and E-commerce
3.4.3 Telecom and IT
3.4.4 Healthcare and Life Sciences
3.4.5 Government and Public Sector
3.4.6 Travel and Hospitality
3.4.7 Others
3.5 Global Contact Center as a Service Market Outlook, by Region, Value (US$ Billion), 2026–2033
3.5.1 North America
3.5.2 Europe
3.5.3 Asia Pacific
3.5.4 Latin America
3.5.5 Middle East & Africa
4. North America Contact Center as a Service Market Outlook, 2026–2033
4.1 North America Contact Center as a Service Market Outlook, by Component, Value (US$ Billion), 2026–2033
4.1.1 Omnichannel Routing
4.1.2 Interactive Voice Response and Self-Service
4.1.3 Workforce Engagement Management
4.1.4 Analytics and Reporting
4.1.5 AI-Assisted Agent Tooling
4.1.6 Professional and Managed Services
4.2 North America Contact Center as a Service Market Outlook, by Deployment, Value (US$ Billion), 2026–2033
4.2.1 Public Cloud
4.2.2 Private Cloud
4.2.3 Hybrid Cloud
4.3 North America Contact Center as a Service Market Outlook, by Enterprise Size, Value (US$ Billion), 2026–2033
4.3.1 Large Enterprises
4.3.2 Small and Medium Enterprises
4.4 North America Contact Center as a Service Market Outlook, by End Use, Value (US$ Billion), 2026–2033
4.4.1 BFSI
4.4.2 Retail and E-commerce
4.4.3 Telecom and IT
4.4.4 Healthcare and Life Sciences
4.4.5 Government and Public Sector
4.4.6 Travel and Hospitality
4.4.7 Others
4.5 North America Contact Center as a Service Market Outlook, by Country, Value (US$ Billion), 2026–2033
4.5.1 United States Contact Center as a Service Market Outlook, by Component, 2026–2033
4.5.2 United States Contact Center as a Service Market Outlook, by Deployment, 2026–2033
4.5.3 United States Contact Center as a Service Market Outlook, by Enterprise Size, 2026–2033
4.5.4 United States Contact Center as a Service Market Outlook, by End Use, 2026–2033
4.5.5 Canada Contact Center as a Service Market Outlook, by Component, 2026–2033
4.5.6 Canada Contact Center as a Service Market Outlook, by Deployment, 2026–2033
4.5.7 Canada Contact Center as a Service Market Outlook, by Enterprise Size, 2026–2033
4.5.8 Canada Contact Center as a Service Market Outlook, by End Use, 2026–2033
5. Europe Contact Center as a Service Market Outlook, 2026–2033
5.1 Europe Contact Center as a Service Market Outlook, by Component, Value (US$ Billion), 2026–2033
5.1.1 Omnichannel Routing
5.1.2 Interactive Voice Response and Self-Service
5.1.3 Workforce Engagement Management
5.1.4 Analytics and Reporting
5.1.5 AI-Assisted Agent Tooling
5.1.6 Professional and Managed Services
5.2 Europe Contact Center as a Service Market Outlook, by Deployment, Value (US$ Billion), 2026–2033
5.2.1 Public Cloud
5.2.2 Private Cloud
5.2.3 Hybrid Cloud
5.3 Europe Contact Center as a Service Market Outlook, by Enterprise Size, Value (US$ Billion), 2026–2033
5.3.1 Large Enterprises
5.3.2 Small and Medium Enterprises
5.4 Europe Contact Center as a Service Market Outlook, by End Use, Value (US$ Billion), 2026–2033
5.4.1 BFSI
5.4.2 Retail and E-commerce
5.4.3 Telecom and IT
5.4.4 Healthcare and Life Sciences
5.4.5 Government and Public Sector
5.4.6 Travel and Hospitality
5.4.7 Others
5.5 Europe Contact Center as a Service Market Outlook, by Country, Value (US$ Billion), 2026–2033
5.5.1 United Kingdom Contact Center as a Service Market Outlook, by Component, 2026–2033
5.5.2 United Kingdom Contact Center as a Service Market Outlook, by Deployment, 2026–2033
5.5.3 United Kingdom Contact Center as a Service Market Outlook, by Enterprise Size, 2026–2033
5.5.4 United Kingdom Contact Center as a Service Market Outlook, by End Use, 2026–2033
5.5.5 Germany Contact Center as a Service Market Outlook, by Component, 2026–2033
5.5.6 Germany Contact Center as a Service Market Outlook, by Deployment, 2026–2033
5.5.7 Germany Contact Center as a Service Market Outlook, by Enterprise Size, 2026–2033
5.5.8 Germany Contact Center as a Service Market Outlook, by End Use, 2026–2033
5.5.9 France Contact Center as a Service Market Outlook, by Component, 2026–2033
5.5.10 France Contact Center as a Service Market Outlook, by Deployment, 2026–2033
5.5.11 France Contact Center as a Service Market Outlook, by Enterprise Size, 2026–2033
5.5.12 France Contact Center as a Service Market Outlook, by End Use, 2026–2033
5.5.13 Netherlands Contact Center as a Service Market Outlook, by Component, 2026–2033
5.5.14 Netherlands Contact Center as a Service Market Outlook, by Deployment, 2026–2033
5.5.15 Netherlands Contact Center as a Service Market Outlook, by Enterprise Size, 2026–2033
5.5.16 Netherlands Contact Center as a Service Market Outlook, by End Use, 2026–2033
5.5.17 Spain Contact Center as a Service Market Outlook, by Component, 2026–2033
5.5.18 Spain Contact Center as a Service Market Outlook, by Deployment, 2026–2033
5.5.19 Spain Contact Center as a Service Market Outlook, by Enterprise Size, 2026–2033
5.5.20 Spain Contact Center as a Service Market Outlook, by End Use, 2026–2033
6. Asia Pacific Contact Center as a Service Market Outlook, 2026–2033
6.1 Asia Pacific Contact Center as a Service Market Outlook, by Component, Value (US$ Billion), 2026–2033
6.1.1 Omnichannel Routing
6.1.2 Interactive Voice Response and Self-Service
6.1.3 Workforce Engagement Management
6.1.4 Analytics and Reporting
6.1.5 AI-Assisted Agent Tooling
6.1.6 Professional and Managed Services
6.2 Asia Pacific Contact Center as a Service Market Outlook, by Deployment, Value (US$ Billion), 2026–2033
6.2.1 Public Cloud
6.2.2 Private Cloud
6.2.3 Hybrid Cloud
6.3 Asia Pacific Contact Center as a Service Market Outlook, by Enterprise Size, Value (US$ Billion), 2026–2033
6.3.1 Large Enterprises
6.3.2 Small and Medium Enterprises
6.4 Asia Pacific Contact Center as a Service Market Outlook, by End Use, Value (US$ Billion), 2026–2033
6.4.1 BFSI
6.4.2 Retail and E-commerce
6.4.3 Telecom and IT
6.4.4 Healthcare and Life Sciences
6.4.5 Government and Public Sector
6.4.6 Travel and Hospitality
6.4.7 Others
6.5 Asia Pacific Contact Center as a Service Market Outlook, by Country, Value (US$ Billion), 2026–2033
6.5.1 India Contact Center as a Service Market Outlook, by Component, 2026–2033
6.5.2 India Contact Center as a Service Market Outlook, by Deployment, 2026–2033
6.5.3 India Contact Center as a Service Market Outlook, by Enterprise Size, 2026–2033
6.5.4 India Contact Center as a Service Market Outlook, by End Use, 2026–2033
6.5.5 Philippines Contact Center as a Service Market Outlook, by Component, 2026–2033
6.5.6 Philippines Contact Center as a Service Market Outlook, by Deployment, 2026–2033
6.5.7 Philippines Contact Center as a Service Market Outlook, by Enterprise Size, 2026–2033
6.5.8 Philippines Contact Center as a Service Market Outlook, by End Use, 2026–2033
6.5.9 China Contact Center as a Service Market Outlook, by Component, 2026–2033
6.5.10 China Contact Center as a Service Market Outlook, by Deployment, 2026–2033
6.5.11 China Contact Center as a Service Market Outlook, by Enterprise Size, 2026–2033
6.5.12 China Contact Center as a Service Market Outlook, by End Use, 2026–2033
6.5.13 Japan Contact Center as a Service Market Outlook, by Component, 2026–2033
6.5.14 Japan Contact Center as a Service Market Outlook, by Deployment, 2026–2033
6.5.15 Japan Contact Center as a Service Market Outlook, by Enterprise Size, 2026–2033
6.5.16 Japan Contact Center as a Service Market Outlook, by End Use, 2026–2033
6.5.17 Australia Contact Center as a Service Market Outlook, by Component, 2026–2033
6.5.18 Australia Contact Center as a Service Market Outlook, by Deployment, 2026–2033
6.5.19 Australia Contact Center as a Service Market Outlook, by Enterprise Size, 2026–2033
6.5.20 Australia Contact Center as a Service Market Outlook, by End Use, 2026–2033
7. Latin America Contact Center as a Service Market Outlook, 2026–2033
7.1 Latin America Contact Center as a Service Market Outlook, by Component, Value (US$ Billion), 2026–2033
7.1.1 Omnichannel Routing
7.1.2 Interactive Voice Response and Self-Service
7.1.3 Workforce Engagement Management
7.1.4 Analytics and Reporting
7.1.5 AI-Assisted Agent Tooling
7.1.6 Professional and Managed Services
7.2 Latin America Contact Center as a Service Market Outlook, by Deployment, Value (US$ Billion), 2026–2033
7.2.1 Public Cloud
7.2.2 Private Cloud
7.2.3 Hybrid Cloud
7.3 Latin America Contact Center as a Service Market Outlook, by Enterprise Size, Value (US$ Billion), 2026–2033
7.3.1 Large Enterprises
7.3.2 Small and Medium Enterprises
7.4 Latin America Contact Center as a Service Market Outlook, by End Use, Value (US$ Billion), 2026–2033
7.4.1 BFSI
7.4.2 Retail and E-commerce
7.4.3 Telecom and IT
7.4.4 Healthcare and Life Sciences
7.4.5 Government and Public Sector
7.4.6 Travel and Hospitality
7.4.7 Others
7.5 Latin America Contact Center as a Service Market Outlook, by Country, Value (US$ Billion), 2026–2033
7.5.1 Brazil Contact Center as a Service Market Outlook, by Component, 2026–2033
7.5.2 Brazil Contact Center as a Service Market Outlook, by Deployment, 2026–2033
7.5.3 Brazil Contact Center as a Service Market Outlook, by Enterprise Size, 2026–2033
7.5.4 Brazil Contact Center as a Service Market Outlook, by End Use, 2026–2033
7.5.5 Mexico Contact Center as a Service Market Outlook, by Component, 2026–2033
7.5.6 Mexico Contact Center as a Service Market Outlook, by Deployment, 2026–2033
7.5.7 Mexico Contact Center as a Service Market Outlook, by Enterprise Size, 2026–2033
7.5.8 Mexico Contact Center as a Service Market Outlook, by End Use, 2026–2033
7.5.9 Colombia Contact Center as a Service Market Outlook, by Component, 2026–2033
7.5.10 Colombia Contact Center as a Service Market Outlook, by Deployment, 2026–2033
7.5.11 Colombia Contact Center as a Service Market Outlook, by Enterprise Size, 2026–2033
7.5.12 Colombia Contact Center as a Service Market Outlook, by End Use, 2026–2033
8. Middle East & Africa Contact Center as a Service Market Outlook, 2026–2033
8.1 Middle East & Africa Contact Center as a Service Market Outlook, by Component, Value (US$ Billion), 2026–2033
8.1.1 Omnichannel Routing
8.1.2 Interactive Voice Response and Self-Service
8.1.3 Workforce Engagement Management
8.1.4 Analytics and Reporting
8.1.5 AI-Assisted Agent Tooling
8.1.6 Professional and Managed Services
8.2 Middle East & Africa Contact Center as a Service Market Outlook, by Deployment, Value (US$ Billion), 2026–2033
8.2.1 Public Cloud
8.2.2 Private Cloud
8.2.3 Hybrid Cloud
8.3 Middle East & Africa Contact Center as a Service Market Outlook, by Enterprise Size, Value (US$ Billion), 2026–2033
8.3.1 Large Enterprises
8.3.2 Small and Medium Enterprises
8.4 Middle East & Africa Contact Center as a Service Market Outlook, by End Use, Value (US$ Billion), 2026–2033
8.4.1 BFSI
8.4.2 Retail and E-commerce
8.4.3 Telecom and IT
8.4.4 Healthcare and Life Sciences
8.4.5 Government and Public Sector
8.4.6 Travel and Hospitality
8.4.7 Others
8.5 Middle East & Africa Contact Center as a Service Market Outlook, by Country, Value (US$ Billion), 2026–2033
8.5.1 United Arab Emirates Contact Center as a Service Market Outlook, by Component, 2026–2033
8.5.2 United Arab Emirates Contact Center as a Service Market Outlook, by Deployment, 2026–2033
8.5.3 United Arab Emirates Contact Center as a Service Market Outlook, by Enterprise Size, 2026–2033
8.5.4 United Arab Emirates Contact Center as a Service Market Outlook, by End Use, 2026–2033
8.5.5 Saudi Arabia Contact Center as a Service Market Outlook, by Component, 2026–2033
8.5.6 Saudi Arabia Contact Center as a Service Market Outlook, by Deployment, 2026–2033
8.5.7 Saudi Arabia Contact Center as a Service Market Outlook, by Enterprise Size, 2026–2033
8.5.8 Saudi Arabia Contact Center as a Service Market Outlook, by End Use, 2026–2033
8.5.9 South Africa Contact Center as a Service Market Outlook, by Component, 2026–2033
8.5.10 South Africa Contact Center as a Service Market Outlook, by Deployment, 2026–2033
8.5.11 South Africa Contact Center as a Service Market Outlook, by Enterprise Size, 2026–2033
8.5.12 South Africa Contact Center as a Service Market Outlook, by End Use, 2026–2033
9. Competitive Landscape
9.1 Industry Leaders
9.2 Company Profiles
9.2.1 Genesys
9.2.2 NICE Ltd.
9.2.3 Five9
9.2.4 Talkdesk
9.2.5 Amazon Web Services
9.2.6 Cisco Systems
9.2.7 Avaya
9.2.8 8x8
9.2.9 RingCentral
9.2.10 Twilio
9.2.11 Vonage
9.2.12 Zoom Communications
9.2.13 Dialpad
9.2.14 Content Guru
9.2.15 Verint Systems
10. Appendix
10.1 Research Methodology
10.2 Report Assumptions
10.3 Acronyms and Abbreviations
| By Component | Omnichannel Routing, Interactive Voice Response and Self-Service, Workforce Engagement Management, Analytics and Reporting, AI-Assisted Agent Tooling, Professional and Managed Services |
| By Deployment | Public Cloud, Private Cloud, Hybrid Cloud |
| By Enterprise Size | Large Enterprises, Small and Medium Enterprises |
| By End Use | BFSI, Retail and E-commerce, Telecom and IT, Healthcare and Life Sciences, Government and Public Sector, Travel and Hospitality, Others |
| By Region | North America, Europe, Asia Pacific, Latin America, Middle East & Africa |
Our Research Methodology
Considering the volatility of business today, traditional approaches to strategizing a game plan can be unfruitful if not detrimental. True ambiguity is no way to determine a forecast. A myriad of predetermined factors must be accounted for such as the degree of risk involved, the magnitude of circumstances, as well as conditions or consequences that are not known or unpredictable. To circumvent binary views that cast uncertainty, the application of market research intelligence to strategically posture, move, and enable actionable outcomes is necessary.
View Methodology
Quality Assured
Rigorous Validation Process

Confidentiality Assured
End-to-end Data Security

Custom Research Services
Tailored To Your Objectives
FAQs
The market is valued at US$ 8.4 billion in 2026 and is projected to reach US$ 24.5 billion by 2033, reflecting steady cloud migration.
The market is forecast to grow at a 16.5% CAGR between 2026 and 2033, adding an absolute dollar opportunity of US$ 16.1 billion.
Omnichannel routing holds the largest component share at 28.4% in 2026, while AI-assisted agent tooling grows fastest at a 21.3% CAGR.
North America leads with 41.8% share in 2026, and Asia Pacific grows fastest at a 20.2% CAGR through 2033 on rapid service digitization.
The market is moderately concentrated, with established platform vendors, communications providers and cloud operators competing on routing depth, integration breadth and embedded automation.
Related Reports
SiC GaN Power Semiconductor Market Size, Share, Insights, Competitive Landscape, and Forecast 2026 to 2033
Explore the SiC GaN power semiconductor market outlook for 2026–2033, covering products, power ranges, applications, regions, and key companies.
Serverless Architecture Market Size, Share, Insights, Competitive Landscape, and Forecast 2026 to 2033
Explore the serverless architecture market outlook for 2026–2033, covering services, deployment models, industries, regional trends, and key companies.
Network Sandboxing Market Size, Share, Insights, Competitive Landscape, and Forecast 2026 to 2033
The global network sandboxing market is valued at US$5.8 billion in 2026, reaching US$14.7 billion by 2033, growing at a 14.2% CAGR
Location of Things Market Size, Share, Insights, Competitive Landscape, and Forecast 2026 to 2033
The global location of things market is valued at US$52.31 billion in 2026, reaching US$297.93 billion by 2033, growing at a 28.2% CAGR
Chemical Mechanical Planarization Market Size, Share, Insights, Competitive Landscape, and Forecast 2026 to 2033
The global chemical mechanical planarization market is valued at US$7.2 billion in 2026, reaching US$11.95 billion by 2033, growing at a 7.5% CAGR
Affiliate Software Market Size, Share, Insights, Competitive Landscape, and Forecast 2026 to 2033
Explore the affiliate software market outlook for 2026–2033, including tracking tools, payout trends, regional insights, and competitive analysis.