



Network Sandboxing Market
Network Sandboxing Market Size, Share, Insights, Competitive Landscape, and Forecast 2026 to 2033
Network Sandboxing Market Size and Trend Analysis
What Is Driving Network Sandboxing Growth Through 2033?
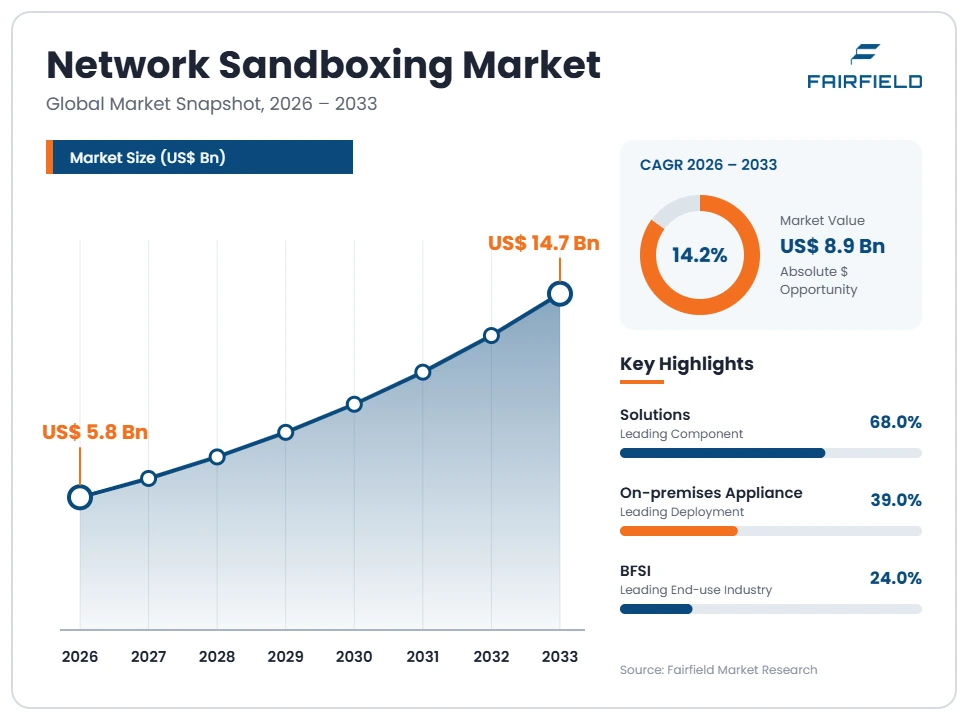
The global Network Sandboxing market size is expected to be valued at US$ 5.8 billion in 2026 and projected to reach US$ 14.7 billion by 2033, growing at a CAGR of 14.2% between 2026 and 2033. Growth reflects a shift from signature matching toward behavioural inspection of unknown files and web links. Buyers fold detonation capacity into email gateways, web proxies and detection platforms instead of buying isolated appliances. Cloud delivery has cut the cost of adding analysis capacity, pulling mid-sized firms into a segment once reserved for large enterprises. Historical growth of 11.6% between 2020 and 2025 is set to quicken as regulated sectors formalise inspection duties. The absolute dollar opportunity stands at US$ 8.9 billion.
Key Report Takeaways
- By Component: Solutions led with 68% share in 2026, while services are projected to expand at a 15.8% CAGR through 2033, driven by buyers who lack in-house analysts and prefer vendor-run triage of suspicious samples.
- By Deployment: On-premises appliances led with 39% share in 2026, while cloud-delivered sandboxing is projected to expand at a 17.1% CAGR through 2033, driven by distributed workforces whose traffic never reaches a corporate data centre.
- By End-use Industry: BFSI led with 24% share in 2026, while healthcare is projected to expand at a 16.9% CAGR through 2033, driven by connected clinical systems that cannot tolerate disruption from an unverified attachment.
- By Region: North America led with 38% share in 2026, while Asia Pacific is projected to expand at a 17.3% CAGR through 2033; Europe, Latin America and Middle East & Africa add steady demand as data-protection enforcement widens.
Global Network Sandboxing Market Trends and Insights
Market Growth Drivers
Rising Volume of Unknown Files Entering Enterprise Networks
Demand rises because organisations receive far more unfamiliar files and links than analysts can review by hand. Every attachment, shared document and download that no reputation service recognises becomes a decision the security team must make quickly. Sandboxing gives buyers a way to automate that decision at the point of entry, so email, web and file-transfer paths each carry an inspection step. Procurement teams treat this as throughput capacity rather than a discretionary tool.
The underlying trend is the expansion of the file paths an enterprise has to watch. Collaboration suites, managed file transfer, software supply chains and partner portals all deliver content from outside the perimeter. Security architecture teams respond by placing analysis close to each path instead of a single choke point. Vendors have answered with licensing based on submission volume, which matches how buyers now budget for inspection.
Regulatory and Insurance Pressure on Pre-Delivery Inspection
Spending grows because auditors and insurers increasingly expect documented inspection of incoming content before users receive it. Financial regulators, health data rules and public-sector procurement frameworks all push organisations to show that unknown files were examined. Cyber insurers ask similar questions during underwriting, and favourable terms often depend on demonstrable controls. Sandboxing produces verdict records and timestamps that satisfy those questions, which turns a technical control into a compliance artefact.
Behind this sits the steady formalisation of security baselines across regulated industries. National cyber agencies publish control catalogues that reference automated analysis of untrusted content, and large buyers pass those requirements down to suppliers. Contractual flow-down means mid-sized vendors serving regulated clients adopt inspection to stay eligible. Audit reporting has accordingly become a purchasing criterion, and vendors now compete on evidence export as much as on detection itself.
Market Restraints
Contested Detection Efficacy and Buyer Scepticism
Growth is held back because buyers question how much a sandbox adds once other controls are in place. Security teams know that some threats are built to behave differently under analysis, so verdicts are treated as one signal rather than a verdict of record. That scepticism lengthens evaluation cycles and pushes purchasers toward bundled pricing instead of premium standalone licensing. Vendors face pressure to prove incremental value against tools the customer already owns.
The wider trend is a market-level debate about measurable efficacy rather than any particular technique. Independent testing programmes publish comparative results, and buyers increasingly run their own trials using their real mail and web traffic. Procurement teams ask for outcome data, not feature lists, and some reduce renewal scope when results look thin. The effect is slower revenue per seat and heavier pre-sales cost for suppliers in competitive accounts.
Analysis Latency and Security Team Workload
Adoption is limited because inspection adds delay and generates alerts that already stretched teams must handle. Holding a message or download while analysis completes frustrates users, and business units push back when routine files are delayed. Each verdict that needs human review consumes analyst time that smaller organisations simply do not have. These operational costs often outweigh licence price in the decision, and some buyers narrow deployment to high-risk paths only.
The industry trend behind this is the persistent shortage of trained security staff across most regions. Organisations running lean operations centres prefer controls that close cases automatically rather than open them. Vendors have responded with tiered inspection, selective submission policies and verdict automation that feeds blocking decisions directly. Managed service options exist for the same reason, yet the underlying constraint still shapes how widely buyers deploy inspection internally.
Market Opportunities
Consolidation into Platform and Managed Detection Offerings
New revenue comes from packaging sandboxing inside broader security platforms rather than selling it alone. Buyers consolidating vendors want inspection bundled with email security, secure web access, firewalls and endpoint detection under one agreement. That shift raises contract value for suppliers with a full portfolio and opens renewal conversations that a point product could never reach. Service providers gain a parallel opportunity delivering analysis as part of managed detection contracts.
The supporting trend is enterprise vendor rationalisation across security budgets. Organisations running dozens of tools are cutting the count to simplify operations and integration work. Platform suppliers have built shared verdict stores so a file judged once informs mail, web and endpoint enforcement together. Channel partners and managed providers package the same capability for mid-market clients, extending reach into accounts that would never staff an analysis function.
Sandboxing for Operational Technology and Industrial Networks
An emerging revenue pool sits in industrial and operational technology environments that have only recently connected to corporate networks. Manufacturing plants, utilities, transport operators and healthcare estates receive firmware updates, engineering files and vendor software that nobody inspects today. Suppliers able to analyse these formats safely, without disturbing production systems, can open accounts that traditional information technology products never served. Pricing in these environments tends to follow site or asset models.
The trend driving this is the convergence of plant networks with enterprise architecture under common security governance. Industrial operators now appoint security leaders with authority across both estates, and regulators in energy and transport are tightening expectations for supply chain software. Vendors have begun supporting industrial file types and offline analysis for air-gapped sites. Adoption remains early, which leaves room for specialists alongside established network security suppliers.
Segment Analysis
- Why Do Solutions Still Hold the Largest Sandboxing Budget?
Solutions hold the largest share because buyers purchase inspection capacity as licensed software or appliances they control. The component commanded 68% of the market in 2026, covering analysis engines, management consoles and the integrations that connect verdicts to enforcement points. Services are the faster mover, projected to grow at a 15.8% CAGR between 2026 and 2033, as organisations without analysts hand triage and tuning to providers. Solution leadership rests on the fact that inspection must sit inline with mail and web traffic, which makes it an architecture decision rather than an outsourced task. Service growth reflects a different reality, where skills shortages make continuous operation harder than initial purchase. For the wider market, the split signals that revenue will increasingly carry a recurring operational component alongside licence renewals, changing how suppliers forecast and staff their delivery organisations.
- Cloud Delivery Is Overtaking the Appliance Installed Base
On-premises appliances remain the largest deployment model, holding 39% share in 2026, because regulated buyers keep analysis inside networks they own. Virtual sandboxes held 24%, while cloud-delivered inspection accounted for 37% and is the fastest-growing option at a 17.1% CAGR through 2033. Appliance leadership persists in banking, defence and critical infrastructure, where data residency rules and sensitive document handling discourage external submission. Cloud growth comes from distributed workforces whose traffic reaches software-as-a-service applications directly, bypassing any corporate data centre where an appliance could sit. Capacity economics reinforce the shift, since shared infrastructure absorbs submission spikes that fixed hardware cannot. The broader implication is that suppliers must sustain two delivery models at once, and that hardware refresh cycles will matter less to revenue than subscription retention over the forecast period.
- Large Enterprises Anchor Spending While Smaller Firms Scale Faster
Large enterprises accounted for 71% of spending in 2026, reflecting bigger attack surfaces, formal security functions and the budget to run dedicated analysis. Small and medium enterprises are growing faster, at a 16.4% CAGR through 2033, as subscription pricing and bundled offerings remove the capital barrier. Enterprise leadership follows from compliance obligations, large mail volumes and the internal staff needed to act on verdicts. Smaller organisations historically skipped inspection because it demanded hardware and expertise they lacked, a constraint that cloud delivery and managed services have largely removed. Supply chain requirements add further pull, since enterprise customers increasingly ask suppliers to evidence their own controls. For the market, this widening base means unit volumes will rise faster than average contract value, pushing vendors toward channel distribution and simplified configuration rather than bespoke enterprise engagements.
- BFSI Leads Adoption as Healthcare Accelerates Fastest
BFSI led end-use demand with 24% share in 2026, driven by high-value transactions, heavy regulatory supervision and constant document exchange with clients and counterparties. Government and defence followed at 19%, with IT and telecom at 17%, manufacturing at 12%, healthcare at 11%, retail and e-commerce at 9%, and other industries at 8%. Healthcare is the fastest-growing vertical at a 16.9% CAGR through 2033, as hospital networks connect clinical devices, imaging systems and partner portals that cannot tolerate disruption. Banking leadership rests on mature security budgets and examiner expectations that controls be documented. Healthcare acceleration reflects both rising incident costs and data protection enforcement around patient records. The pattern tells suppliers that vertical packaging matters, since clinical and financial buyers assess integration, file format coverage and audit reporting against very different operating requirements.
Geography Analysis
- Which Region Is Leading the Network Sandboxing Market?
North America leads the market with 38% share in 2026, supported by the United States and Canada. Concentration of financial services, technology firms and federal agencies creates dense demand for inspection of incoming files and links. Federal procurement frameworks reference automated analysis of untrusted content, which pushes agencies and their contractors toward documented controls. Most major network and email security suppliers are headquartered in the region, shortening sales cycles and supporting early access to new delivery models. Cyber insurance penetration is also higher, and underwriting questions have made inspection a practical requirement for mid-sized firms. State-level data breach notification rules add further pressure, since disclosure costs give boards a direct financial reason to fund preventive analysis across mail and web paths.
- Europe Converts Data Protection Rules into Inspection Budgets
Europe holds 27% share in 2026, with Germany, the United Kingdom and France contributing most demand. Data protection enforcement and sector-specific network security rules have made documented handling of untrusted content a board-level obligation. Public administrations and banks across the region are modernising gateway infrastructure, often specifying that analysis occur within national or regional boundaries. That requirement sustains demand for on-premises and sovereign cloud deployments rather than cross-border submission. Industrial buyers in manufacturing-heavy economies are extending inspection into engineering and supplier file exchanges. National cyber agencies publish baseline control guidance that smaller organisations adopt directly, which spreads demand beyond large enterprises. Procurement in the region weighs residency, reporting and supplier transparency heavily, shaping which delivery models vendors can realistically offer.
- Which Region Is Growing Fastest in the Network Sandboxing Market?
Asia Pacific is growing fastest, at a 17.3% CAGR between 2026 and 2033, from 22% share in 2026. China, India, Japan, Australia and South Korea supply most of that momentum. Rapid digitisation of banking, government services and retail has multiplied the volume of files entering networks that were lightly defended a few years ago. Several national governments have introduced cyber security and data localisation rules that require local analysis and reporting. Cloud infrastructure build-out across the region makes subscription inspection practical for organisations that never operated security hardware. Manufacturing and logistics operators are extending controls into plant networks as production systems connect to enterprise architecture. A growing managed security provider base helps smaller firms adopt inspection without hiring specialist analysts.
- Latin America Builds Capacity Around Banking and Public Services
Latin America accounts for 7% share in 2026, led by Brazil and Mexico. Banking modernisation and instant payment systems have raised the stakes around document fraud and malicious attachments reaching customer-facing staff. National data protection laws now carry enforcement powers, prompting larger institutions to formalise inspection and retain evidence of verdicts. Budget constraints keep many organisations on bundled or managed options rather than dedicated platforms, so growth concentrates in subscription delivery. Regional cloud availability has improved, reducing the latency concerns that previously discouraged external analysis. Public sector digitisation programmes add demand as agencies move citizen services online. Adoption remains uneven outside the largest economies, where limited security staffing continues to favour provider-operated services over in-house deployment.
- Middle East and Africa Follow Government Digital Programmes
Middle East & Africa holds 6% share in 2026, with the United Arab Emirates, Saudi Arabia and South Africa leading adoption. Large government digital transformation programmes in the Gulf have funded modern security architecture, often specifying inspection within national infrastructure. Energy operators and sovereign financial institutions drive demand for analysis that covers both corporate and industrial file flows. Regional regulators have issued cyber security frameworks that reference automated handling of untrusted content, giving buyers a clear mandate. In Africa, growth concentrates in financial services and telecommunications, where mobile money platforms raise exposure. Skills shortages across much of the region steer buyers toward managed delivery, and regional provider capacity has expanded to meet that preference.
Competitive Landscape
The market is moderately concentrated, with a group of established network and email security suppliers holding most enterprise revenue alongside a smaller set of analysis specialists. Positioning has shifted away from standalone detonation products toward sandboxing as a capability inside broader platforms. Buyers consolidating vendors now evaluate inspection as one line in a firewall, email security or extended detection agreement rather than a separate purchase. That change favours suppliers with wide portfolios and puts pressure on independent specialists to prove depth that platform bundles cannot match. Partnerships with managed service providers have become an important route into mid-market accounts.
Competition centres on integration, verdict quality and operational cost rather than feature counts. Vendors differentiate on how quickly a verdict reaches enforcement points across mail, web, network and endpoint controls, and on how much analyst work each verdict creates. File format coverage, support for scripted content and the ability to analyse archives and installers all matter in evaluations. Deployment flexibility is a further battleground, since regulated buyers need on-premises or sovereign options while distributed organisations want cloud delivery. Specialist entrants compete on analysis depth and reporting detail, which appeals to incident response teams and threat intelligence functions.
Strategic activity concentrates on portfolio consolidation, cloud delivery and service expansion. Acquisitions that add analysis capability to platform vendors matter because they remove a reason for customers to keep a separate supplier. Investment in shared verdict infrastructure matters competitively, since a file judged once can inform every control a customer owns. Channel and managed service partnerships extend reach into organisations without security staff.
Competitive direction points toward measurable outcomes, tighter platform integration and service-led delivery, with efficacy evidence increasingly decisive in renewals.
Industry Leaders
- Palo Alto Networks, Inc.
- Fortinet, Inc.
- Check Point Software Technologies Ltd.
- Cisco Systems, Inc.
- Trend Micro Incorporated
- Proofpoint, Inc.
- Zscaler, Inc.
- Trellix
Companies Covered in the Report
- Palo Alto Networks, Inc.
- Fortinet, Inc.
- Check Point Software Technologies Ltd.
- Cisco Systems, Inc.
- Trend Micro Incorporated
- Proofpoint, Inc.
- Zscaler, Inc.
- Trellix
- Broadcom Inc.
- Sophos Ltd.
- Forcepoint LLC
- Juniper Networks, Inc.
- Akamai Technologies, Inc.
- Barracuda Networks, Inc.
- VMRay GmbH
Network Sandboxing Market Report Scope
| Metric | Value |
| Study Period | 2020–2033 |
| Market Size 2026 | US$ 5.8 Billion |
| Market Size 2033 | US$ 14.7 Billion |
| CAGR 2026–2033 | 14.2% |
| Absolute Dollar Opportunity | US$ 8.9 Billion |
| Largest Market | North America (38% share in 2026) |
| Fastest-Growing Market | Asia Pacific (17.3% CAGR 2026–2033) |
| Market Concentration | Moderately Concentrated |
| Major Players | Palo Alto Networks, Inc., Fortinet, Inc., Check Point Software Technologies Ltd., Cisco Systems, Inc., Trend Micro Incorporated |
Network Sandboxing Market Segmentation
- Executive Summary
- Network Sandboxing Market Snapshot
- Future Projections
- Key Market Trends
- Regional Snapshot
- Market Overview
- Market Definition and Report Scope
- Historical Market Trends
- Market Dynamics
- Drivers
- Restraints
- Market Opportunities
- Global Network Sandboxing Market Outlook, 2026–2033
- Global Network Sandboxing Market Outlook, by Component, Value (US$ Billion), 2026–2033
- Solutions
- Services
- Global Network Sandboxing Market Outlook, by Deployment, Value (US$ Billion), 2026–2033
- On-premises Appliance
- Virtual Sandbox
- Cloud-delivered Sandbox
- Global Network Sandboxing Market Outlook, by Organisation Size, Value (US$ Billion), 2026–2033
- Large Enterprises
- Small and Medium Enterprises
- Global Network Sandboxing Market Outlook, by End-use Industry, Value (US$ Billion), 2026–2033
- BFSI
- Government and Defence
- IT and Telecom
- Manufacturing
- Healthcare
- Retail and E-commerce
- Others
- Global Network Sandboxing Market Outlook, by Region, Value (US$ Billion), 2026–2033
- North America
- Europe
- Asia Pacific
- Latin America
- Middle East & Africa
- Global Network Sandboxing Market Outlook, by Component, Value (US$ Billion), 2026–2033
- North America Network Sandboxing Market Outlook, 2026–2033
- North America Network Sandboxing Market Outlook, by Component, Value (US$ Billion), 2026–2033
- Solutions
- Services
- North America Network Sandboxing Market Outlook, by Deployment, Value (US$ Billion), 2026–2033
- On-premises Appliance
- Virtual Sandbox
- Cloud-delivered Sandbox
- North America Network Sandboxing Market Outlook, by Organisation Size, Value (US$ Billion), 2026–2033
- Large Enterprises
- Small and Medium Enterprises
- North America Network Sandboxing Market Outlook, by End-use Industry, Value (US$ Billion), 2026–2033
- BFSI
- Government and Defence
- IT and Telecom
- Manufacturing
- Healthcare
- Retail and E-commerce
- Others
- North America Network Sandboxing Market Outlook, by Country, Value (US$ Billion), 2026–2033
- United States Network Sandboxing Market Outlook, by Component, 2026–2033
- United States Network Sandboxing Market Outlook, by Deployment, 2026–2033
- United States Network Sandboxing Market Outlook, by Organisation Size, 2026–2033
- United States Network Sandboxing Market Outlook, by End-use Industry, 2026–2033
- Canada Network Sandboxing Market Outlook, by Component, 2026–2033
- Canada Network Sandboxing Market Outlook, by Deployment, 2026–2033
- Canada Network Sandboxing Market Outlook, by Organisation Size, 2026–2033
- Canada Network Sandboxing Market Outlook, by End-use Industry, 2026–2033
- North America Network Sandboxing Market Outlook, by Component, Value (US$ Billion), 2026–2033
- Europe Network Sandboxing Market Outlook, 2026–2033
- Europe Network Sandboxing Market Outlook, by Component, Value (US$ Billion), 2026–2033
- Solutions
- Services
- Europe Network Sandboxing Market Outlook, by Deployment, Value (US$ Billion), 2026–2033
- On-premises Appliance
- Virtual Sandbox
- Cloud-delivered Sandbox
- Europe Network Sandboxing Market Outlook, by Organisation Size, Value (US$ Billion), 2026–2033
- Large Enterprises
- Small and Medium Enterprises
- Europe Network Sandboxing Market Outlook, by End-use Industry, Value (US$ Billion), 2026–2033
- BFSI
- Government and Defence
- IT and Telecom
- Manufacturing
- Healthcare
- Retail and E-commerce
- Others
- Europe Network Sandboxing Market Outlook, by Country, Value (US$ Billion), 2026–2033
- Germany Network Sandboxing Market Outlook, by Component, 2026–2033
- Germany Network Sandboxing Market Outlook, by Deployment, 2026–2033
- Germany Network Sandboxing Market Outlook, by Organisation Size, 2026–2033
- Germany Network Sandboxing Market Outlook, by End-use Industry, 2026–2033
- United Kingdom Network Sandboxing Market Outlook, by Component, 2026–2033
- United Kingdom Network Sandboxing Market Outlook, by Deployment, 2026–2033
- United Kingdom Network Sandboxing Market Outlook, by Organisation Size, 2026–2033
- United Kingdom Network Sandboxing Market Outlook, by End-use Industry, 2026–2033
- France Network Sandboxing Market Outlook, by Component, 2026–2033
- France Network Sandboxing Market Outlook, by Deployment, 2026–2033
- France Network Sandboxing Market Outlook, by Organisation Size, 2026–2033
- France Network Sandboxing Market Outlook, by End-use Industry, 2026–2033
- Europe Network Sandboxing Market Outlook, by Component, Value (US$ Billion), 2026–2033
- Asia Pacific Network Sandboxing Market Outlook, 2026–2033
- Asia Pacific Network Sandboxing Market Outlook, by Component, Value (US$ Billion), 2026–2033
- Solutions
- Services
- Asia Pacific Network Sandboxing Market Outlook, by Deployment, Value (US$ Billion), 2026–2033
- On-premises Appliance
- Virtual Sandbox
- Cloud-delivered Sandbox
- Asia Pacific Network Sandboxing Market Outlook, by Organisation Size, Value (US$ Billion), 2026–2033
- Large Enterprises
- Small and Medium Enterprises
- Asia Pacific Network Sandboxing Market Outlook, by End-use Industry, Value (US$ Billion), 2026–2033
- BFSI
- Government and Defence
- IT and Telecom
- Manufacturing
- Healthcare
- Retail and E-commerce
- Others
- Asia Pacific Network Sandboxing Market Outlook, by Country, Value (US$ Billion), 2026–2033
- China Network Sandboxing Market Outlook, by Component, 2026–2033
- China Network Sandboxing Market Outlook, by Deployment, 2026–2033
- China Network Sandboxing Market Outlook, by Organisation Size, 2026–2033
- China Network Sandboxing Market Outlook, by End-use Industry, 2026–2033
- India Network Sandboxing Market Outlook, by Component, 2026–2033
- India Network Sandboxing Market Outlook, by Deployment, 2026–2033
- India Network Sandboxing Market Outlook, by Organisation Size, 2026–2033
- India Network Sandboxing Market Outlook, by End-use Industry, 2026–2033
- Japan Network Sandboxing Market Outlook, by Component, 2026–2033
- Japan Network Sandboxing Market Outlook, by Deployment, 2026–2033
- Japan Network Sandboxing Market Outlook, by Organisation Size, 2026–2033
- Japan Network Sandboxing Market Outlook, by End-use Industry, 2026–2033
- Australia Network Sandboxing Market Outlook, by Component, 2026–2033
- Australia Network Sandboxing Market Outlook, by Deployment, 2026–2033
- Australia Network Sandboxing Market Outlook, by Organisation Size, 2026–2033
- Australia Network Sandboxing Market Outlook, by End-use Industry, 2026–2033
- South Korea Network Sandboxing Market Outlook, by Component, 2026–2033
- South Korea Network Sandboxing Market Outlook, by Deployment, 2026–2033
- South Korea Network Sandboxing Market Outlook, by Organisation Size, 2026–2033
- South Korea Network Sandboxing Market Outlook, by End-use Industry, 2026–2033
- Asia Pacific Network Sandboxing Market Outlook, by Component, Value (US$ Billion), 2026–2033
- Latin America Network Sandboxing Market Outlook, 2026–2033
- Latin America Network Sandboxing Market Outlook, by Component, Value (US$ Billion), 2026–2033
- Solutions
- Services
- Latin America Network Sandboxing Market Outlook, by Deployment, Value (US$ Billion), 2026–2033
- On-premises Appliance
- Virtual Sandbox
- Cloud-delivered Sandbox
- Latin America Network Sandboxing Market Outlook, by Organisation Size, Value (US$ Billion), 2026–2033
- Large Enterprises
- Small and Medium Enterprises
- Latin America Network Sandboxing Market Outlook, by End-use Industry, Value (US$ Billion), 2026–2033
- BFSI
- Government and Defence
- IT and Telecom
- Manufacturing
- Healthcare
- Retail and E-commerce
- Others
- Latin America Network Sandboxing Market Outlook, by Country, Value (US$ Billion), 2026–2033
- Brazil Network Sandboxing Market Outlook, by Component, 2026–2033
- Brazil Network Sandboxing Market Outlook, by Deployment, 2026–2033
- Brazil Network Sandboxing Market Outlook, by Organisation Size, 2026–2033
- Brazil Network Sandboxing Market Outlook, by End-use Industry, 2026–2033
- Mexico Network Sandboxing Market Outlook, by Component, 2026–2033
- Mexico Network Sandboxing Market Outlook, by Deployment, 2026–2033
- Mexico Network Sandboxing Market Outlook, by Organisation Size, 2026–2033
- Mexico Network Sandboxing Market Outlook, by End-use Industry, 2026–2033
- Latin America Network Sandboxing Market Outlook, by Component, Value (US$ Billion), 2026–2033
- Middle East & Africa Network Sandboxing Market Outlook, 2026–2033
- Middle East & Africa Network Sandboxing Market Outlook, by Component, Value (US$ Billion), 2026–2033
- Solutions
- Services
- Middle East & Africa Network Sandboxing Market Outlook, by Deployment, Value (US$ Billion), 2026–2033
- On-premises Appliance
- Virtual Sandbox
- Cloud-delivered Sandbox
- Middle East & Africa Network Sandboxing Market Outlook, by Organisation Size, Value (US$ Billion), 2026–2033
- Large Enterprises
- Small and Medium Enterprises
- Middle East & Africa Network Sandboxing Market Outlook, by End-use Industry, Value (US$ Billion), 2026–2033
- BFSI
- Government and Defence
- IT and Telecom
- Manufacturing
- Healthcare
- Retail and E-commerce
- Others
- Middle East & Africa Network Sandboxing Market Outlook, by Country, Value (US$ Billion), 2026–2033
- United Arab Emirates Network Sandboxing Market Outlook, by Component, 2026–2033
- United Arab Emirates Network Sandboxing Market Outlook, by Deployment, 2026–2033
- United Arab Emirates Network Sandboxing Market Outlook, by Organisation Size, 2026–2033
- United Arab Emirates Network Sandboxing Market Outlook, by End-use Industry, 2026–2033
- Saudi Arabia Network Sandboxing Market Outlook, by Component, 2026–2033
- Saudi Arabia Network Sandboxing Market Outlook, by Deployment, 2026–2033
- Saudi Arabia Network Sandboxing Market Outlook, by Organisation Size, 2026–2033
- Saudi Arabia Network Sandboxing Market Outlook, by End-use Industry, 2026–2033
- South Africa Network Sandboxing Market Outlook, by Component, 2026–2033
- South Africa Network Sandboxing Market Outlook, by Deployment, 2026–2033
- South Africa Network Sandboxing Market Outlook, by Organisation Size, 2026–2033
- South Africa Network Sandboxing Market Outlook, by End-use Industry, 2026–2033
- Middle East & Africa Network Sandboxing Market Outlook, by Component, Value (US$ Billion), 2026–2033
- Competitive Landscape
- Industry Leaders
- Company Profiles
- Palo Alto Networks, Inc.
- Fortinet, Inc.
- Check Point Software Technologies Ltd.
- Cisco Systems, Inc.
- Trend Micro Incorporated
- Proofpoint, Inc.
- Zscaler, Inc.
- Trellix
- Broadcom Inc.
- Sophos Ltd.
- Forcepoint LLC
- Juniper Networks, Inc.
- Akamai Technologies, Inc.
- Barracuda Networks, Inc.
- VMRay GmbH
- Appendix
- Research Methodology
- Report Assumptions
- Acronyms and Abbreviations
Component
- Solutions
- Services
Deployment
- On-premises Appliance
- Virtual Sandbox
- Cloud-delivered Sandbox
Organisation Size
- Large Enterprises
- Small and Medium Enterprises
End-use Industry
- BFSI
- Government and Defence
- IT and Telecom
- Manufacturing
- Healthcare
- Retail and E-commerce
- Others
Region
- North America
- Europe
- Asia Pacific
- Latin America
- Middle East & Africa
Our Research Methodology
Considering the volatility of business today, traditional approaches to strategizing a game plan can be unfruitful if not detrimental. True ambiguity is no way to determine a forecast. A myriad of predetermined factors must be accounted for such as the degree of risk involved, the magnitude of circumstances, as well as conditions or consequences that are not known or unpredictable. To circumvent binary views that cast uncertainty, the application of market research intelligence to strategically posture, move, and enable actionable outcomes is necessary.
View Methodology
Quality Assured
Rigorous Validation Process

Confidentiality Assured
End-to-end Data Security

Custom Research Services
Tailored To Your Objectives
FAQs
The market is valued at US$ 5.8 billion in 2026, supported by wider inspection of unknown files and links entering enterprise networks.
The market is projected to reach US$ 14.7 billion by 2033, expanding at a 14.2% CAGR as inspection becomes a standard control.
Cloud-delivered sandboxing is growing fastest, at a 17.1% CAGR through 2033, because distributed users reach cloud applications without passing through corporate data centres.
BFSI leads with 24% share in 2026, reflecting high transaction values, heavy regulatory supervision and constant document exchange with clients and counterparties.
Related Reports
SiC GaN Power Semiconductor Market Size, Share, Insights, Competitive Landscape, and Forecast 2026 to 2033
Explore the SiC GaN power semiconductor market outlook for 2026–2033, covering products, power ranges, applications, regions, and key companies.
Serverless Architecture Market Size, Share, Insights, Competitive Landscape, and Forecast 2026 to 2033
Explore the serverless architecture market outlook for 2026–2033, covering services, deployment models, industries, regional trends, and key companies.
Location of Things Market Size, Share, Insights, Competitive Landscape, and Forecast 2026 to 2033
The global location of things market is valued at US$52.31 billion in 2026, reaching US$297.93 billion by 2033, growing at a 28.2% CAGR
Chemical Mechanical Planarization Market Size, Share, Insights, Competitive Landscape, and Forecast 2026 to 2033
The global chemical mechanical planarization market is valued at US$7.2 billion in 2026, reaching US$11.95 billion by 2033, growing at a 7.5% CAGR
Contact Center as a Service Market Size, Share, Insights, Competitive Landscape, and Forecast 2026 to 2033
Explore the contact center as a service market outlook for 2026–2033, including cloud deployment, AI tooling, regional trends, and competitive insights.
Affiliate Software Market Size, Share, Insights, Competitive Landscape, and Forecast 2026 to 2033
Explore the affiliate software market outlook for 2026–2033, including tracking tools, payout trends, regional insights, and competitive analysis.