



Serverless Architecture Market
Serverless Architecture Market Size, Share, Insights, Competitive Landscape, and Forecast 2026 to 2033
Report Overview
Serverless Architecture Market Size and Trend Analysis
How Fast Is the Serverless Architecture Market Growing?
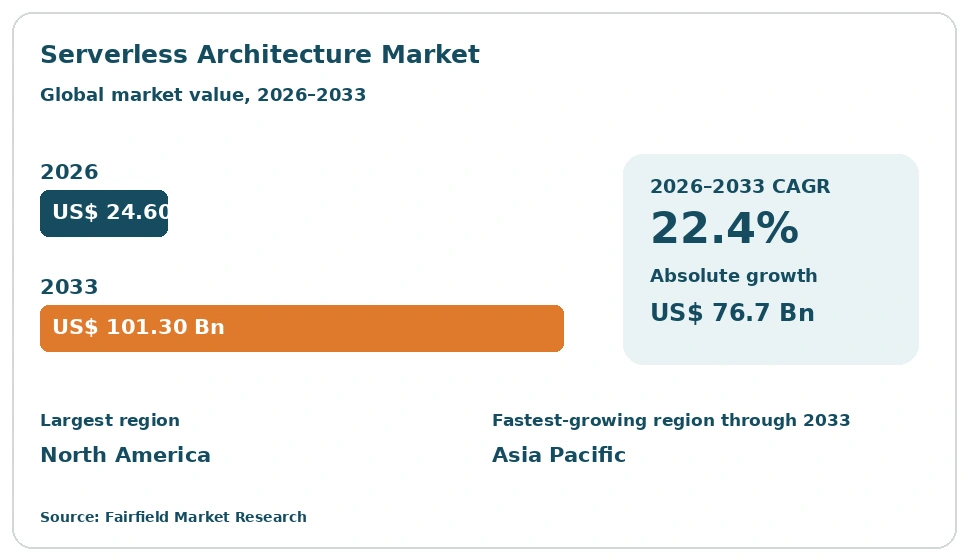
The global Serverless Architecture market size is expected to be valued at US$ 24.6 billion in 2026 and projected to reach US$ 101.3 billion by 2033, growing at a CAGR of 22.4% between 2026 and 2033. Growth is led by the shift from always-on servers to event-driven compute that bills only for execution time. Enterprises are rebuilding customer-facing applications around managed functions, managed databases and streaming pipelines. Demand is further supported by uneven artificial intelligence inference traffic, which suits on-demand execution. Between 2020 and 2025 the market expanded at a historical CAGR of 24.8%, and the forecast period adds an absolute dollar opportunity of US$ 76.7 billion.
Key Report Takeaways
- By Service Type: Function as a Service led with 38.4% share in 2026, while serverless databases are projected to expand at a 26.1% CAGR through 2033, driven by demand for storage that scales to zero between traffic bursts.
- By Deployment Model: Public cloud led with 61.5% share in 2026, while hybrid cloud is projected to expand at a 24.6% CAGR through 2033, driven by data residency rules that keep regulated workloads inside national borders.
- By Organisation Size: Large enterprises led with 64.8% share in 2026, while small and medium enterprises are projected to expand at a 24.9% CAGR through 2033, driven by the ability to run production systems without a platform engineering team.
- By End-use Industry: BFSI led with 23.6% share in 2026, while healthcare and life sciences is projected to expand at a 25.8% CAGR through 2033, driven by interoperability mandates that push clinical data exchange onto managed APIs.
- By Region: North America led with 41.8% share in 2026, while Asia Pacific is projected to expand at a 26.4% CAGR through 2033; Europe, Latin America and Middle East & Africa follow, driven by new sovereign cloud regions.
Market Trends and Insights
Market Growth Drivers
Consumption-Based Economics Replace Idle Server Capacity
Serverless adoption is rising because compute cost moves in step with actual usage. Traditional always-on infrastructure leaves capacity idle between traffic peaks, and finance teams increasingly refuse to fund that waste. Functions that start on an event and stop when the work ends turn fixed infrastructure spending into a variable line item. The appeal is strongest for businesses with spiky or seasonal workloads, including retail checkout, ticketing, media streaming and payment processing.
The shift is reinforced by a wider move toward event-driven design across enterprise IT. Message queues, streaming pipelines and managed APIs now connect applications that once ran as single large systems. Cloud providers have extended their platforms with managed triggers, workflow orchestration and native service integrations, so teams can connect components without operating middleware themselves. Regulated sectors also value the detailed execution records these managed services produce, because they simplify internal governance reporting.
Faster Release Cycles Lift Developer Productivity
Serverless platforms raise demand by removing the operational work that slows software delivery. Teams no longer patch operating systems, size clusters or plan capacity before a launch. Engineers spend more time on business logic, so release cycles shorten and new features reach customers sooner. For companies competing on digital experience, that speed is a commercial advantage rather than a technical preference. Smaller firms benefit most, because they can run production workloads without hiring dedicated infrastructure staff.
Supporting this trend is the steady maturing of tooling around managed functions. Infrastructure-as-code frameworks, local emulators and managed deployment pipelines make serverless projects repeatable across environments. Managed authentication, object storage and database services let a small team assemble complete applications from standard building blocks. Generative artificial intelligence workloads add further pull, because inference requests arrive unevenly and map naturally onto on-demand execution models.
Restraints Impact Analysis of Market
Vendor Lock-In Limits Workload Portability
Vendor lock-in is a genuine brake on serverless spending, and it slows large migrations. Function runtimes, event formats, identity models and managed data services differ sharply between providers. Once an application depends on a specific trigger system and permission model, moving it means rewriting rather than relocating. Procurement teams in banking, government and healthcare treat that dependency as a strategic risk, so they cap the share of critical systems placed on any single platform.
The concern is practical rather than theoretical. Portability projects often stall because managed services have no exact equivalent elsewhere, and open runtimes still require significant integration work. Some organisations respond by keeping an orchestration layer or container platform alongside functions, which adds cost and complexity. Others restrict serverless to peripheral workloads such as scheduled jobs and media processing. Both responses reduce the addressable spend that providers can capture from core enterprise systems.
Cold-Start Latency and Observability Gaps Slow Adoption
Cold-start latency and weak observability remain real constraints on where serverless can be used. When a function has been idle, the platform must initialise a runtime before executing code, which adds delay to the first request. Interactive applications with strict response budgets, including trading systems, telephony and some clinical workflows, cannot absorb that variability. Architects therefore keep latency-sensitive paths on provisioned capacity and route only tolerant workloads to functions.
Debugging compounds the problem. A single transaction may cross many short-lived functions, queues and managed services, so failures are hard to reproduce after the compute has disappeared. Traditional agent-based monitoring assumes a long-running host and fits poorly. Distributed tracing, structured logging and provisioned warm capacity all help, but they demand new skills and raise the effective cost. Until these gaps narrow further, serverless penetration of mission-critical systems will stay uneven.
Market Opportunities
Serverless Databases and Edge Execution Open New Revenue
The largest near-term opportunity sits in data services and execution at the network edge. Serverless databases that scale capacity to zero between bursts remove the last always-on component from many architectures. That makes the consumption model coherent across the whole application rather than only the compute layer. Providers that pair elastic storage with familiar query interfaces can win workloads that previously stayed on provisioned clusters.
Edge execution extends the same idea geographically. Running functions in points of presence close to users cuts round-trip time and reduces the cold-start penalty that limits interactive use cases. Content personalisation, authentication, fraud screening and request routing are natural early candidates. Content delivery networks and developer platforms are building function runtimes directly into their edge footprints, while database vendors add replicated read capacity nearby. The combination creates a credible path into latency-sensitive applications.
Regulated and Hybrid Deployments Create Fresh Demand
Regulated industries represent a sizeable pool of workloads that serverless has barely touched. Banks, insurers, hospitals and public agencies hold large estates of batch jobs, document processing and integration logic that fit event-driven execution well. These buyers have been cautious because of residency rules, audit requirements and concerns about dependency on a single provider. Platforms that address those concerns directly can convert cautious pilots into production commitments.
Hybrid and sovereign deployment options are the practical unlock. Function platforms that run on customer-controlled infrastructure, in national cloud regions or on open container runtimes let organisations keep sensitive data in place while using the same programming model elsewhere. Clear execution logs, fine-grained permissions and supply chain controls support compliance reviews. Systems integrators and software vendors serving these sectors gain a reason to package serverless into their own regulated offerings.
Category-wise Insights
Why Does Function as a Service Lead the Market?
Function as a Service leads because it is the entry point for almost every serverless project, holding 38.4% share in 2026. Teams typically start with event handlers, scheduled jobs and API backends before adopting deeper managed services. Backend as a Service follows at 23.7%, supported by packaged authentication, storage and push messaging. Serverless databases hold 14.9% but grow fastest at a 26.1% CAGR through 2033, because elastic storage removes the last always-on cost in an application. Event streaming and messaging accounts for 13.2%, while serverless tooling covering observability, security and deployment takes 9.8%. The split matters strategically: compute attracts the first commitment, yet data and tooling determine how deeply a provider is embedded. Vendors competing only on function execution face thinner margins than those selling the surrounding data and governance layers.
Public Cloud Keeps the Largest Share of Deployments
Public cloud dominates serverless deployment with 61.5% share in 2026, because the model depends on pooled capacity that only hyperscale operators can supply economically. Elastic scaling, global regions and deep service catalogues all favour shared infrastructure. Hybrid cloud holds 24.3% and grows fastest at a 24.6% CAGR through 2033, as residency rules and latency requirements keep selected workloads near existing systems. Private cloud retains 14.2%, concentrated in defence, central government and large financial institutions running open function runtimes on their own hardware. Open container-based platforms have made this practical by offering a consistent programming model across environments. For buyers, the direction of travel is clear: public cloud remains the default for new applications, while hybrid patterns decide whether regulated estates ever move. Providers now compete on how well their control planes span both.
Which Organisations Are Adopting Serverless Fastest?
Small and medium enterprises are adopting fastest, expanding at a 24.9% CAGR through 2033 from a 35.2% share in 2026, while large enterprises still hold 64.8%. Large organisations lead on spending because they run the biggest application estates and the highest transaction volumes. They also fund migration programmes, internal developer platforms and specialist teams that smaller firms cannot staff. Smaller companies grow faster for a different reason: serverless removes the need for that staffing altogether. A modest engineering team can run production systems using managed functions, databases and authentication without any infrastructure specialists. Lower entry costs and generous free usage tiers also reduce the risk of experimenting. The result is a widening base of smaller customers whose individual spend is low but whose aggregate growth outpaces the enterprise segment, pushing vendors toward simpler onboarding and clearer pricing.
BFSI Anchors Demand While Healthcare Accelerates
BFSI is the largest end-use industry with 23.6% share in 2026, driven by payment authorisation, fraud screening and open banking APIs that face highly variable traffic. IT and telecom follows at 19.4%, with retail and e-commerce at 16.2%, where seasonal peaks make elastic compute valuable. Healthcare and life sciences holds 10.1% but grows fastest at a 25.8% CAGR through 2033, as interoperability mandates push clinical data exchange onto managed APIs and event pipelines. Media and entertainment accounts for 11.3%, manufacturing for 8.7%, government and public sector for 5.4%, and other industries for 5.3%. The pattern shows serverless moving from web-facing workloads into regulated record systems. That transition raises the bar on auditability and residency, and rewards providers whose compliance tooling is as strong as their runtime performance.
Geography Analysis
Which Region Is Leading the Serverless Architecture Market?
North America leads the serverless architecture market with 41.8% share in 2026, supported by the deepest concentration of cloud capacity and software engineering talent. The United States contributes most regional revenue, with Canada adding public sector and financial services demand. Major platform providers are headquartered here, so new function runtimes, managed databases and observability services reach the region first. Enterprise buyers in banking, insurance, media and retail completed earlier migration waves, which makes event-driven redesign the logical next step. Venture-funded software companies build on managed services by default rather than operating their own infrastructure. Sector rules in finance and healthcare shape controls rather than restricting cloud use outright. Continued investment in data centre capacity and artificial intelligence inference infrastructure keeps the lead intact.
Europe Builds Serverless on Sovereignty and Compliance Rules
Europe holds 25.3% share in 2026, and its adoption pattern is shaped more by regulation than by cost. Germany, the United Kingdom, France and the Nordic countries account for most demand. Data protection requirements and financial sector resilience rules push organisations toward deployments where processing location and audit evidence can be demonstrated. Providers have responded by opening additional in-region zones and offering sovereign controls over operations and encryption keys. Manufacturing groups use event-driven services to connect factory telemetry with enterprise systems, while public agencies modernise citizen services on managed platforms. Concentration risk guidance makes multi-provider strategies common, which sustains interest in open function runtimes. Growth is steady rather than rapid, because procurement and compliance review lengthen deployment timelines.
Which Region Is Growing Fastest in the Serverless Architecture Market?
Asia Pacific is growing fastest, expanding at a 26.4% CAGR through 2033 from 23.1% share in 2026. The pace reflects rapid construction of new cloud regions across India, Japan, Australia, Singapore, South Korea and Southeast Asia, which brings low-latency capacity near local users. Mobile-first platforms in commerce, ride hailing, gaming and digital payments handle extreme traffic swings that suit event-driven execution. National digital identity and payment systems have created a wide developer base familiar with API-centric design. China supports substantial domestic demand served by local providers. Government digitalisation programmes and data localisation rules both encourage in-country cloud deployment rather than discouraging adoption, while a young developer population keeps the cost of building new serverless applications low.
Latin America Adopts Serverless Through Digital Payments Growth
Latin America accounts for 5.6% share in 2026, with Brazil and Mexico generating most activity. Instant payment systems and a fast-growing financial technology sector produce workloads with sharp, unpredictable transaction peaks that fit on-demand compute well. Retail and logistics firms use managed functions to connect marketplaces, delivery tracking and customer messaging without operating middleware. Additional in-region cloud zones have reduced latency and eased earlier concerns about keeping data in country. Currency volatility makes consumption-based billing attractive, because capacity need not be purchased ahead of uncertain demand. Constraints remain, including a limited pool of experienced cloud engineers and uneven network quality outside major cities.
Middle East & Africa Scales Serverless on New Cloud Regions
Middle East & Africa holds 4.2% share in 2026, the smallest base but a rapidly improving one. The United Arab Emirates, Saudi Arabia, Qatar, Israel and South Africa account for most demand. National transformation programmes in the Gulf states fund large government digital services that rely on managed cloud platforms rather than owned data centres. New in-country cloud regions, often paired with sovereignty commitments, have removed a long-standing barrier for banks and public agencies. In Africa, mobile money and digital lending services generate event-driven workloads that scale unpredictably with subscriber activity. Skills availability is the main constraint, so providers and local integrators invest in training and certification programmes.
Competitive Landscape
The serverless architecture market is moderately concentrated at the platform layer and fragmented around it. A small group of global cloud providers supplies the function runtimes, managed databases and event services on which most workloads run, and their scale advantages in capacity and regional coverage are difficult to match. Around that core sits a wide field of specialists in edge execution, developer experience, observability, security and data services. These companies rarely compete head-on with the hyperscalers. Instead they attach to the major platforms, improve a weak point, and build durable positions in that niche. Consolidation tends to follow the same logic, with capability gaps closed through acquisition rather than broad platform mergers.
Competition is fought mainly on developer experience, latency behaviour, data service breadth and governance tooling. Cold-start performance, concurrency limits and pricing transparency are compared closely during evaluation. Providers also differentiate on how far their runtimes support open standards and container-based packaging, because buyers use portability as leverage in negotiation. Newer entrants from the content delivery and developer platform world matter because they attack the latency constraint directly, placing execution close to users. Database vendors matter for a different reason: elastic data services determine whether an entire application can follow the consumption model.
Strategic activity concentrates on regional capacity, sovereign and hybrid options, and integration with artificial intelligence workloads. Vendors extend managed services so teams can assemble applications without custom infrastructure, and they invest in tracing and security tooling to answer long-standing observability complaints. Partnerships with systems integrators and independent software vendors are used to reach regulated buyers. The overall direction is toward platforms that combine elastic compute, elastic data and credible compliance evidence in one operating model.
Industry Leaders
- Amazon Web Services
- Microsoft Corporation
- Google LLC
- IBM Corporation
- Oracle Corporation
- Alibaba Cloud
- Cloudflare, Inc.
- Red Hat, Inc.
Companies Covered in the Report
- Amazon Web Services
- Microsoft Corporation
- Google LLC
- IBM Corporation
- Oracle Corporation
- Alibaba Cloud
- Tencent Cloud
- Huawei Technologies Co., Ltd.
- Cloudflare, Inc.
- Red Hat, Inc.
- MongoDB, Inc.
- Datadog, Inc.
- Elastic N.V.
- HashiCorp, Inc.
- Fastly, Inc.
- Akamai Technologies, Inc.
- Vercel Inc.
- Netlify, Inc.
- Twilio Inc.
- DigitalOcean Holdings, Inc.
- Salesforce, Inc.
- SAP SE
Serverless Architecture Market Report Scope
The market is segmented by service type, deployment model, organisation size, end-use industry and region.
| By Service Type | Function as a Service, Backend as a Service, Serverless Databases, Event Streaming and Messaging, Serverless Tooling (Observability, Security and Deployment) |
| By Deployment Model | Public Cloud, Hybrid Cloud, Private Cloud |
| By Organisation Size | Large Enterprises, Small and Medium Enterprises |
| By End-use Industry | BFSI, IT and Telecom, Retail and E-commerce, Media and Entertainment, Healthcare and Life Sciences, Manufacturing, Government and Public Sector, Others |
| By Region | North America, Europe, Asia Pacific, Latin America, Middle East & Africa |
1. Executive Summary
1.1 Serverless Architecture Market Snapshot
1.2 Future Projections
1.3 Key Market Trends
1.4 Regional Snapshot
2. Market Overview
2.1 Market Definition and Report Scope
2.2 Historical Market Trends
2.3 Market Dynamics
2.3.1 Drivers
2.3.1.1 Consumption-Based Economics Replace Idle Server Capacity
2.3.1.2 Faster Release Cycles Lift Developer Productivity
2.3.2 Restraints
2.3.2.1 Vendor Lock-In Limits Workload Portability
2.3.2.2 Cold-Start Latency and Observability Gaps Slow Adoption
2.3.3 Market Opportunities
2.3.3.1 Serverless Databases and Edge Execution Open New Revenue
2.3.3.2 Regulated and Hybrid Deployments Create Fresh Demand
3. Global Serverless Architecture Market Outlook, 2026–2033
3.1 Global Serverless Architecture Market Outlook, by Service Type, Value (US$ Billion), 2026–2033
3.1.1 Function as a Service
3.1.2 Backend as a Service
3.1.3 Serverless Databases
3.1.4 Event Streaming and Messaging
3.1.5 Serverless Tooling (Observability, Security and Deployment)
3.2 Global Serverless Architecture Market Outlook, by Deployment Model, Value (US$ Billion), 2026–2033
3.2.1 Public Cloud
3.2.2 Hybrid Cloud
3.2.3 Private Cloud
3.3 Global Serverless Architecture Market Outlook, by Organisation Size, Value (US$ Billion), 2026–2033
3.3.1 Large Enterprises
3.3.2 Small and Medium Enterprises
3.4 Global Serverless Architecture Market Outlook, by End-use Industry, Value (US$ Billion), 2026–2033
3.4.1 BFSI
3.4.2 IT and Telecom
3.4.3 Retail and E-commerce
3.4.4 Media and Entertainment
3.4.5 Healthcare and Life Sciences
3.4.6 Manufacturing
3.4.7 Government and Public Sector
3.4.8 Others
3.5 Global Serverless Architecture Market Outlook, by Region, Value (US$ Billion), 2026–2033
3.5.1 North America
3.5.2 Europe
3.5.3 Asia Pacific
3.5.4 Latin America
3.5.5 Middle East & Africa
4. North America Serverless Architecture Market Outlook, 2026–2033
4.1 North America Serverless Architecture Market Outlook, by Service Type, Value (US$ Billion), 2026–2033
4.1.1 Function as a Service
4.1.2 Backend as a Service
4.1.3 Serverless Databases
4.1.4 Event Streaming and Messaging
4.1.5 Serverless Tooling (Observability, Security and Deployment)
4.2 North America Serverless Architecture Market Outlook, by Deployment Model, Value (US$ Billion), 2026–2033
4.2.1 Public Cloud
4.2.2 Hybrid Cloud
4.2.3 Private Cloud
4.3 North America Serverless Architecture Market Outlook, by Organisation Size, Value (US$ Billion), 2026–2033
4.3.1 Large Enterprises
4.3.2 Small and Medium Enterprises
4.4 North America Serverless Architecture Market Outlook, by End-use Industry, Value (US$ Billion), 2026–2033
4.4.1 BFSI
4.4.2 IT and Telecom
4.4.3 Retail and E-commerce
4.4.4 Media and Entertainment
4.4.5 Healthcare and Life Sciences
4.4.6 Manufacturing
4.4.7 Government and Public Sector
4.4.8 Others
4.5 North America Serverless Architecture Market Outlook, by Country, Value (US$ Billion), 2026–2033
4.5.1 United States Serverless Architecture Market Outlook, by Service Type, 2026–2033
4.5.2 United States Serverless Architecture Market Outlook, by Deployment Model, 2026–2033
4.5.3 United States Serverless Architecture Market Outlook, by Organisation Size, 2026–2033
4.5.4 United States Serverless Architecture Market Outlook, by End-use Industry, 2026–2033
4.5.5 Canada Serverless Architecture Market Outlook, by Service Type, 2026–2033
4.5.6 Canada Serverless Architecture Market Outlook, by Deployment Model, 2026–2033
4.5.7 Canada Serverless Architecture Market Outlook, by Organisation Size, 2026–2033
4.5.8 Canada Serverless Architecture Market Outlook, by End-use Industry, 2026–2033
5. Europe Serverless Architecture Market Outlook, 2026–2033
5.1 Europe Serverless Architecture Market Outlook, by Service Type, Value (US$ Billion), 2026–2033
5.1.1 Function as a Service
5.1.2 Backend as a Service
5.1.3 Serverless Databases
5.1.4 Event Streaming and Messaging
5.1.5 Serverless Tooling (Observability, Security and Deployment)
5.2 Europe Serverless Architecture Market Outlook, by Deployment Model, Value (US$ Billion), 2026–2033
5.2.1 Public Cloud
5.2.2 Hybrid Cloud
5.2.3 Private Cloud
5.3 Europe Serverless Architecture Market Outlook, by Organisation Size, Value (US$ Billion), 2026–2033
5.3.1 Large Enterprises
5.3.2 Small and Medium Enterprises
5.4 Europe Serverless Architecture Market Outlook, by End-use Industry, Value (US$ Billion), 2026–2033
5.4.1 BFSI
5.4.2 IT and Telecom
5.4.3 Retail and E-commerce
5.4.4 Media and Entertainment
5.4.5 Healthcare and Life Sciences
5.4.6 Manufacturing
5.4.7 Government and Public Sector
5.4.8 Others
5.5 Europe Serverless Architecture Market Outlook, by Country and Subregion, Value (US$ Billion), 2026–2033
5.5.1 Germany Serverless Architecture Market Outlook, by Service Type, 2026–2033
5.5.2 Germany Serverless Architecture Market Outlook, by Deployment Model, 2026–2033
5.5.3 Germany Serverless Architecture Market Outlook, by Organisation Size, 2026–2033
5.5.4 Germany Serverless Architecture Market Outlook, by End-use Industry, 2026–2033
5.5.5 United Kingdom Serverless Architecture Market Outlook, by Service Type, 2026–2033
5.5.6 United Kingdom Serverless Architecture Market Outlook, by Deployment Model, 2026–2033
5.5.7 United Kingdom Serverless Architecture Market Outlook, by Organisation Size, 2026–2033
5.5.8 United Kingdom Serverless Architecture Market Outlook, by End-use Industry, 2026–2033
5.5.9 France Serverless Architecture Market Outlook, by Service Type, 2026–2033
5.5.10 France Serverless Architecture Market Outlook, by Deployment Model, 2026–2033
5.5.11 France Serverless Architecture Market Outlook, by Organisation Size, 2026–2033
5.5.12 France Serverless Architecture Market Outlook, by End-use Industry, 2026–2033
5.5.13 Nordic countries Serverless Architecture Market Outlook, by Service Type, 2026–2033
5.5.14 Nordic countries Serverless Architecture Market Outlook, by Deployment Model, 2026–2033
5.5.15 Nordic countries Serverless Architecture Market Outlook, by Organisation Size, 2026–2033
5.5.16 Nordic countries Serverless Architecture Market Outlook, by End-use Industry, 2026–2033
6. Asia Pacific Serverless Architecture Market Outlook, 2026–2033
6.1 Asia Pacific Serverless Architecture Market Outlook, by Service Type, Value (US$ Billion), 2026–2033
6.1.1 Function as a Service
6.1.2 Backend as a Service
6.1.3 Serverless Databases
6.1.4 Event Streaming and Messaging
6.1.5 Serverless Tooling (Observability, Security and Deployment)
6.2 Asia Pacific Serverless Architecture Market Outlook, by Deployment Model, Value (US$ Billion), 2026–2033
6.2.1 Public Cloud
6.2.2 Hybrid Cloud
6.2.3 Private Cloud
6.3 Asia Pacific Serverless Architecture Market Outlook, by Organisation Size, Value (US$ Billion), 2026–2033
6.3.1 Large Enterprises
6.3.2 Small and Medium Enterprises
6.4 Asia Pacific Serverless Architecture Market Outlook, by End-use Industry, Value (US$ Billion), 2026–2033
6.4.1 BFSI
6.4.2 IT and Telecom
6.4.3 Retail and E-commerce
6.4.4 Media and Entertainment
6.4.5 Healthcare and Life Sciences
6.4.6 Manufacturing
6.4.7 Government and Public Sector
6.4.8 Others
6.5 Asia Pacific Serverless Architecture Market Outlook, by Country, Value (US$ Billion), 2026–2033
6.5.1 India Serverless Architecture Market Outlook, by Service Type, 2026–2033
6.5.2 India Serverless Architecture Market Outlook, by Deployment Model, 2026–2033
6.5.3 India Serverless Architecture Market Outlook, by Organisation Size, 2026–2033
6.5.4 India Serverless Architecture Market Outlook, by End-use Industry, 2026–2033
6.5.5 Japan Serverless Architecture Market Outlook, by Service Type, 2026–2033
6.5.6 Japan Serverless Architecture Market Outlook, by Deployment Model, 2026–2033
6.5.7 Japan Serverless Architecture Market Outlook, by Organisation Size, 2026–2033
6.5.8 Japan Serverless Architecture Market Outlook, by End-use Industry, 2026–2033
6.5.9 Australia Serverless Architecture Market Outlook, by Service Type, 2026–2033
6.5.10 Australia Serverless Architecture Market Outlook, by Deployment Model, 2026–2033
6.5.11 Australia Serverless Architecture Market Outlook, by Organisation Size, 2026–2033
6.5.12 Australia Serverless Architecture Market Outlook, by End-use Industry, 2026–2033
6.5.13 Singapore Serverless Architecture Market Outlook, by Service Type, 2026–2033
6.5.14 Singapore Serverless Architecture Market Outlook, by Deployment Model, 2026–2033
6.5.15 Singapore Serverless Architecture Market Outlook, by Organisation Size, 2026–2033
6.5.16 Singapore Serverless Architecture Market Outlook, by End-use Industry, 2026–2033
6.5.17 South Korea Serverless Architecture Market Outlook, by Service Type, 2026–2033
6.5.18 South Korea Serverless Architecture Market Outlook, by Deployment Model, 2026–2033
6.5.19 South Korea Serverless Architecture Market Outlook, by Organisation Size, 2026–2033
6.5.20 South Korea Serverless Architecture Market Outlook, by End-use Industry, 2026–2033
6.5.21 China Serverless Architecture Market Outlook, by Service Type, 2026–2033
6.5.22 China Serverless Architecture Market Outlook, by Deployment Model, 2026–2033
6.5.23 China Serverless Architecture Market Outlook, by Organisation Size, 2026–2033
6.5.24 China Serverless Architecture Market Outlook, by End-use Industry, 2026–2033
7. Latin America Serverless Architecture Market Outlook, 2026–2033
7.1 Latin America Serverless Architecture Market Outlook, by Service Type, Value (US$ Billion), 2026–2033
7.1.1 Function as a Service
7.1.2 Backend as a Service
7.1.3 Serverless Databases
7.1.4 Event Streaming and Messaging
7.1.5 Serverless Tooling (Observability, Security and Deployment)
7.2 Latin America Serverless Architecture Market Outlook, by Deployment Model, Value (US$ Billion), 2026–2033
7.2.1 Public Cloud
7.2.2 Hybrid Cloud
7.2.3 Private Cloud
7.3 Latin America Serverless Architecture Market Outlook, by Organisation Size, Value (US$ Billion), 2026–2033
7.3.1 Large Enterprises
7.3.2 Small and Medium Enterprises
7.4 Latin America Serverless Architecture Market Outlook, by End-use Industry, Value (US$ Billion), 2026–2033
7.4.1 BFSI
7.4.2 IT and Telecom
7.4.3 Retail and E-commerce
7.4.4 Media and Entertainment
7.4.5 Healthcare and Life Sciences
7.4.6 Manufacturing
7.4.7 Government and Public Sector
7.4.8 Others
7.5 Latin America Serverless Architecture Market Outlook, by Country, Value (US$ Billion), 2026–2033
7.5.1 Brazil Serverless Architecture Market Outlook, by Service Type, 2026–2033
7.5.2 Brazil Serverless Architecture Market Outlook, by Deployment Model, 2026–2033
7.5.3 Brazil Serverless Architecture Market Outlook, by Organisation Size, 2026–2033
7.5.4 Brazil Serverless Architecture Market Outlook, by End-use Industry, 2026–2033
7.5.5 Mexico Serverless Architecture Market Outlook, by Service Type, 2026–2033
7.5.6 Mexico Serverless Architecture Market Outlook, by Deployment Model, 2026–2033
7.5.7 Mexico Serverless Architecture Market Outlook, by Organisation Size, 2026–2033
7.5.8 Mexico Serverless Architecture Market Outlook, by End-use Industry, 2026–2033
8. Middle East & Africa Serverless Architecture Market Outlook, 2026–2033
8.1 Middle East & Africa Serverless Architecture Market Outlook, by Service Type, Value (US$ Billion), 2026–2033
8.1.1 Function as a Service
8.1.2 Backend as a Service
8.1.3 Serverless Databases
8.1.4 Event Streaming and Messaging
8.1.5 Serverless Tooling (Observability, Security and Deployment)
8.2 Middle East & Africa Serverless Architecture Market Outlook, by Deployment Model, Value (US$ Billion), 2026–2033
8.2.1 Public Cloud
8.2.2 Hybrid Cloud
8.2.3 Private Cloud
8.3 Middle East & Africa Serverless Architecture Market Outlook, by Organisation Size, Value (US$ Billion), 2026–2033
8.3.1 Large Enterprises
8.3.2 Small and Medium Enterprises
8.4 Middle East & Africa Serverless Architecture Market Outlook, by End-use Industry, Value (US$ Billion), 2026–2033
8.4.1 BFSI
8.4.2 IT and Telecom
8.4.3 Retail and E-commerce
8.4.4 Media and Entertainment
8.4.5 Healthcare and Life Sciences
8.4.6 Manufacturing
8.4.7 Government and Public Sector
8.4.8 Others
8.5 Middle East & Africa Serverless Architecture Market Outlook, by Country and Subregion, Value (US$ Billion), 2026–2033
8.5.1 United Arab Emirates Serverless Architecture Market Outlook, by Service Type, 2026–2033
8.5.2 United Arab Emirates Serverless Architecture Market Outlook, by Deployment Model, 2026–2033
8.5.3 United Arab Emirates Serverless Architecture Market Outlook, by Organisation Size, 2026–2033
8.5.4 United Arab Emirates Serverless Architecture Market Outlook, by End-use Industry, 2026–2033
8.5.5 Saudi Arabia Serverless Architecture Market Outlook, by Service Type, 2026–2033
8.5.6 Saudi Arabia Serverless Architecture Market Outlook, by Deployment Model, 2026–2033
8.5.7 Saudi Arabia Serverless Architecture Market Outlook, by Organisation Size, 2026–2033
8.5.8 Saudi Arabia Serverless Architecture Market Outlook, by End-use Industry, 2026–2033
8.5.9 Qatar Serverless Architecture Market Outlook, by Service Type, 2026–2033
8.5.10 Qatar Serverless Architecture Market Outlook, by Deployment Model, 2026–2033
8.5.11 Qatar Serverless Architecture Market Outlook, by Organisation Size, 2026–2033
8.5.12 Qatar Serverless Architecture Market Outlook, by End-use Industry, 2026–2033
8.5.13 Israel Serverless Architecture Market Outlook, by Service Type, 2026–2033
8.5.14 Israel Serverless Architecture Market Outlook, by Deployment Model, 2026–2033
8.5.15 Israel Serverless Architecture Market Outlook, by Organisation Size, 2026–2033
8.5.16 Israel Serverless Architecture Market Outlook, by End-use Industry, 2026–2033
8.5.17 South Africa Serverless Architecture Market Outlook, by Service Type, 2026–2033
8.5.18 South Africa Serverless Architecture Market Outlook, by Deployment Model, 2026–2033
8.5.19 South Africa Serverless Architecture Market Outlook, by Organisation Size, 2026–2033
8.5.20 South Africa Serverless Architecture Market Outlook, by End-use Industry, 2026–2033
8.5.21 Gulf states Serverless Architecture Market Outlook, by Service Type, 2026–2033
8.5.22 Gulf states Serverless Architecture Market Outlook, by Deployment Model, 2026–2033
8.5.23 Gulf states Serverless Architecture Market Outlook, by Organisation Size, 2026–2033
8.5.24 Gulf states Serverless Architecture Market Outlook, by End-use Industry, 2026–2033
9. Competitive Landscape
9.1 Industry Leaders
9.2 Company Profiles
9.2.1 Amazon Web Services
9.2.2 Microsoft Corporation
9.2.3 Google LLC
9.2.4 IBM Corporation
9.2.5 Oracle Corporation
9.2.6 Alibaba Cloud
9.2.7 Tencent Cloud
9.2.8 Huawei Technologies Co., Ltd.
9.2.9 Cloudflare, Inc.
9.2.10 Red Hat, Inc.
9.2.11 MongoDB, Inc.
9.2.12 Datadog, Inc.
9.2.13 Elastic N.V.
9.2.14 HashiCorp, Inc.
9.2.15 Fastly, Inc.
9.2.16 Akamai Technologies, Inc.
9.2.17 Vercel Inc.
9.2.18 Netlify, Inc.
9.2.19 Twilio Inc.
9.2.20 DigitalOcean Holdings, Inc.
9.2.21 Salesforce, Inc.
9.2.22 SAP SE
10. Appendix
10.1 Research Methodology
10.2 Report Assumptions
10.3 Acronyms and Abbreviations
| By Service Type | Function as a Service, Backend as a Service, Serverless Databases, Event Streaming and Messaging, Serverless Tooling (Observability, Security and Deployment) |
| By Deployment Model | Public Cloud, Hybrid Cloud, Private Cloud |
| By Organisation Size | Large Enterprises, Small and Medium Enterprises |
| By End-use Industry | BFSI, IT and Telecom, Retail and E-commerce, Media and Entertainment, Healthcare and Life Sciences, Manufacturing, Government and Public Sector, Others |
| By Region | North America, Europe, Asia Pacific, Latin America, Middle East & Africa |
Our Research Methodology
Considering the volatility of business today, traditional approaches to strategizing a game plan can be unfruitful if not detrimental. True ambiguity is no way to determine a forecast. A myriad of predetermined factors must be accounted for such as the degree of risk involved, the magnitude of circumstances, as well as conditions or consequences that are not known or unpredictable. To circumvent binary views that cast uncertainty, the application of market research intelligence to strategically posture, move, and enable actionable outcomes is necessary.
View Methodology
Quality Assured
Rigorous Validation Process

Confidentiality Assured
End-to-end Data Security

Custom Research Services
Tailored To Your Objectives
FAQs
The global serverless architecture market is valued at US$ 24.6 billion in 2026, supported by event-driven application modernisation and consumption-based cloud pricing across industries.
The market is projected to reach US$ 101.3 billion by 2033, growing at a 22.4% CAGR and adding US$ 76.7 billion in absolute opportunity.
Function as a Service leads with a 38.4% share in 2026, while serverless databases grow fastest at a 26.1% CAGR through 2033.
North America holds 41.8% share in 2026, while Asia Pacific grows fastest at a 26.4% CAGR, supported by rapid cloud region expansion.
Amazon Web Services, Microsoft, Google, IBM, Oracle, Alibaba Cloud, Cloudflare and Red Hat are among the principal vendors competing across serverless platforms and tooling.
Related Reports
SiC GaN Power Semiconductor Market Size, Share, Insights, Competitive Landscape, and Forecast 2026 to 2033
Explore the SiC GaN power semiconductor market outlook for 2026–2033, covering products, power ranges, applications, regions, and key companies.
Network Sandboxing Market Size, Share, Insights, Competitive Landscape, and Forecast 2026 to 2033
The global network sandboxing market is valued at US$5.8 billion in 2026, reaching US$14.7 billion by 2033, growing at a 14.2% CAGR
Location of Things Market Size, Share, Insights, Competitive Landscape, and Forecast 2026 to 2033
The global location of things market is valued at US$52.31 billion in 2026, reaching US$297.93 billion by 2033, growing at a 28.2% CAGR
Chemical Mechanical Planarization Market Size, Share, Insights, Competitive Landscape, and Forecast 2026 to 2033
The global chemical mechanical planarization market is valued at US$7.2 billion in 2026, reaching US$11.95 billion by 2033, growing at a 7.5% CAGR
Contact Center as a Service Market Size, Share, Insights, Competitive Landscape, and Forecast 2026 to 2033
Explore the contact center as a service market outlook for 2026–2033, including cloud deployment, AI tooling, regional trends, and competitive insights.
Affiliate Software Market Size, Share, Insights, Competitive Landscape, and Forecast 2026 to 2033
Explore the affiliate software market outlook for 2026–2033, including tracking tools, payout trends, regional insights, and competitive analysis.