



Chemical Mechanical Planarization Market
Chemical Mechanical Planarization Market Size, Share, Insights, Competitive Landscape, and Forecast 2026 to 2033
Chemical Mechanical Planarization Market Size and Trend Analysis
What Is Driving CMP Market Growth Through 2033?
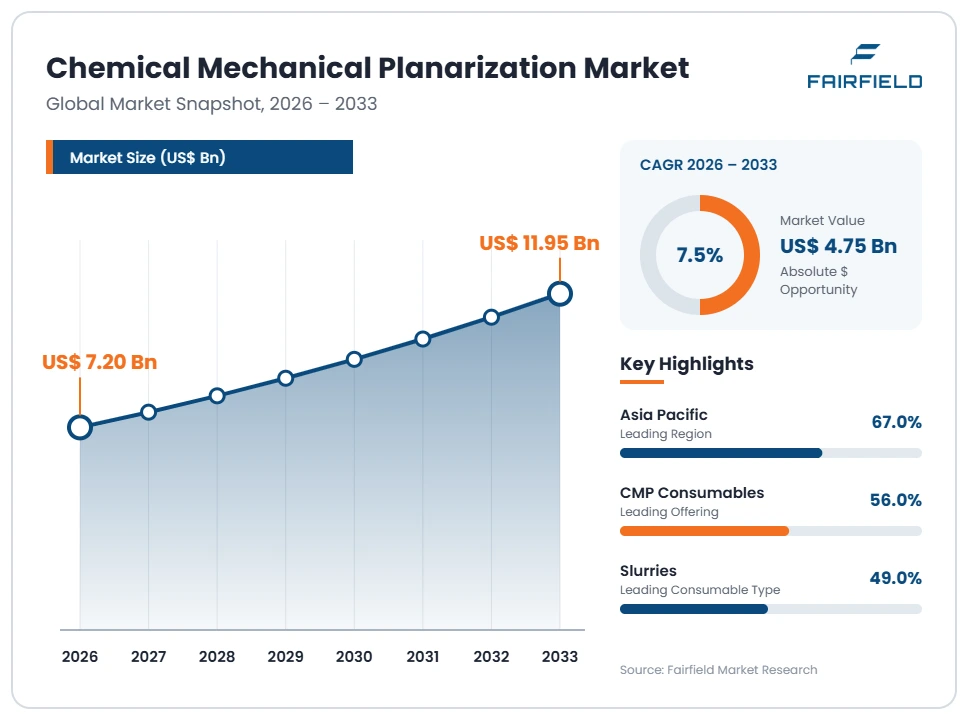
The global Chemical Mechanical Planarization market size is expected to be valued at US$ 7.2 billion in 2026 and projected to reach US$ 11.95 billion by 2033, growing at a CAGR of 7.5% between 2026 and 2033. Growth tracks the rising number of polishing steps required at advanced logic and memory nodes. Each added metal level and each additional 3D NAND tier increases planarization passes per wafer, lifting both tool demand and consumable consumption. New fab capacity across several regions adds a second growth layer, since greenfield lines buy polishing systems before they reach volume output. Advanced packaging adds a third, as hybrid bonding and interposer flows bring planarization into back-end operations.
Key Report Takeaways
- By Offering: CMP consumables led with 56% share in 2026, while CMP equipment is projected to expand at an 8.0% CAGR through 2033, driven by greenfield fab construction that front-loads polishing tool purchases ahead of volume production ramps.
- By Consumable Type: Slurries led with 49% share in 2026, while post-CMP cleaning chemistries are projected to expand at an 8.6% CAGR through 2033, driven by tighter defect budgets at advanced nodes that demand residue-free surfaces.
- By Application: Logic devices led with 44% share in 2026, while advanced packaging is projected to expand at a 10.2% CAGR through 2033, driven by chiplet architectures that require planar bonding surfaces across stacked dies.
- By End User: Foundries led with 46% share in 2026, while OSAT providers are projected to expand at a 9.4% CAGR through 2033, driven by the migration of wafer-level packaging work into outsourced assembly and test facilities.
- By Region: Asia Pacific led with 67% share in 2026, while North America is projected to expand at an 8.4% CAGR through 2033, driven by new domestic wafer fabrication capacity entering tool installation and qualification phases.
Global Chemical Mechanical Planarization Market Trends and Insights
Market Growth Drivers
Advanced Node Transitions Multiply Planarization Steps per Wafer
Each advance in logic node design adds planarization work to the wafer flow. Modern devices stack more metal interconnect levels, and every level needs a flat surface before lithography can resolve the next pattern. Fabs therefore run more polishing passes per wafer than they did a generation earlier. That raises tool hours, consumable volumes and the share of cycle time spent on planarization, which lifts supplier revenue even when wafer starts stay flat.
The shift is reinforced by gate-all-around transistor structures and new interconnect materials entering high-volume manufacturing. These structures leave less tolerance for thickness variation across the wafer, so fabs tighten uniformity targets and increase in-line measurement. Suppliers respond with closed-loop endpoint control, finer pad grooving and slurries engineered for specific film stacks. Planarization has moved from a supporting operation to a yield-critical one, and that status change supports steady investment through the forecast period.
Memory Capacity Expansion Sustains High Consumable Volumes
Memory manufacturing consumes planarization capacity at scale, and capacity growth keeps consumable demand firm. DRAM makers polish repeatedly during capacitor and interconnect formation, while 3D NAND producers planarize after each deck of stacked layers. As layer counts climb, the number of polishing operations per finished wafer climbs with them. Memory fabs also run very high wafer volumes, so even small increases in step count translate into large absolute increases in slurry, pad and conditioner consumption.
The underlying trend is the build-out of memory capacity to serve data centre servers, high-bandwidth memory stacks and edge devices. High-bandwidth memory in particular combines dense DRAM dies with through-silicon vias, and each stacking step requires a flat, defect-free surface. Memory producers consequently qualify multiple consumable sources and negotiate long supply agreements to protect output. That behaviour gives materials suppliers predictable volume and encourages investment in regional blending and distribution capacity.
Market Restraints
High Tool Costs Limit Adoption Outside Leading-Edge Fabs
Polishing systems carry high purchase, installation and qualification costs, which restricts buying to well-capitalised manufacturers. A single advanced platform requires cleanroom floor space, ultrapure water, waste handling and metrology integration before it produces a saleable wafer. Smaller analog, power and specialty foundries often cannot justify that outlay, so they extend the life of existing tools or outsource planarized substrates. The result is a narrower buyer base than the broad semiconductor equipment market would suggest.
Capital intensity also makes equipment demand cyclical rather than steady. Fab operators defer tool orders when memory pricing weakens or when end demand softens, and planarization purchases are easy to postpone because installed tools can absorb extra load. Used-equipment channels and refurbishment services add further competition for new system sales. Suppliers counter by building recurring revenue through parts, upgrades and service contracts, but the underlying constraint on new tool placements remains through the forecast period.
Long Consumable Qualification Cycles Slow Supplier Switching
Changing a slurry, pad or cleaning chemistry requires months of qualification work, which restrains market fluidity. Fabs must prove that a new consumable holds removal uniformity, defect levels and yield across many lots before releasing it to production. Because planarization affects every subsequent layer, the risk of an unproven change is high. Buyers therefore stay with incumbent suppliers longer than price alone would justify, and new entrants struggle to convert technical merit into orders.
This dynamic reflects how deeply consumables are tied to specific film stacks and tool configurations. A material qualified on one platform at one node often needs revalidation elsewhere, so suppliers carry wide product portfolios and large application engineering teams. Those costs raise the barrier to entry and concentrate share among established materials companies. For fabs, the trade-off is reduced negotiating leverage and exposure to single-source risk when a qualified material faces supply disruption.
Market Opportunities
Advanced Packaging Opens a New Planarization Demand Pool
Advanced packaging creates planarization revenue outside the traditional front-end wafer fab. Hybrid bonding, silicon interposers, through-silicon vias and redistribution layers all require surfaces flat enough to join reliably at the die level. That work was historically minimal in assembly and test operations, so every new packaging line represents incremental tool and consumable demand. Suppliers that can serve both front-end and back-end customers gain access to a second, faster-growing revenue stream.
The opportunity is widening as chiplet architectures replace single large dies in high-performance computing and artificial intelligence hardware. Packaging houses and foundries are both adding bonding capability, which spreads planarization expertise across company types that previously had none. Demand follows for smaller-diameter tools, bonding-grade slurries and cleaning chemistries tuned to copper and dielectric surfaces. Equipment suppliers are also adapting platform footprints and automation to fit packaging cleanrooms rather than full wafer fabs.
Regional Fab Build-Out Favours Localized Supply and Service
New fab construction across multiple regions creates opportunity for localized consumable supply and field service. Slurries have limited shelf life and significant shipping cost, so manufacturers gain an advantage by blending near the customer. Pads, conditioners and cleaning chemistries face similar logistics pressure. Suppliers that establish regional blending, warehousing and application support can win qualification early in a new fab’s life and hold that position for the tool’s service life.
The trend is driven by national programmes encouraging domestic semiconductor manufacturing and by customer pressure for supply chain resilience. Trade policy uncertainty reinforces the same preference, since buyers want alternatives if cross-border flows are disrupted. Equipment makers are responding by expanding regional spare parts depots and training local engineers, because tool uptime depends on fast response. These investments raise fixed costs but secure long-term aftermarket revenue, which is the most stable part of the planarization business.
Segment Analysis
- Why Do Consumables Account for Most CMP Spending?
Consumables accounted for 56% of market value in 2026 because fabs buy them continuously, while tools are bought once. Every polished wafer consumes slurry, wears pad surface and uses conditioner life, so spending scales directly with production volume rather than with capacity additions. CMP equipment held 38% share, and services and support accounted for 6%.
Equipment is the fastest-growing offering at an 8.0% CAGR through 2033, reflecting the wave of new fab construction now reaching the tool installation stage. Greenfield lines order polishing platforms well before they generate output, which front-loads equipment revenue relative to consumable revenue. For suppliers, the practical implication is sequencing: tool placements made during this build-out phase lock in the consumable and service annuity that follows for a decade or more.
- Slurries Anchor Consumable Value as Cleaning Chemistries Accelerate
Slurries led the consumable mix with 49% share in 2026, because abrasive chemistry determines removal behaviour on every film the process touches. Polishing pads followed at 28%, post-CMP cleaning chemistries at 12%, conditioners and diamond discs at 7%, and retaining rings and other parts at 4%. Slurry volume rises with each additional polishing step, which keeps its share stable.
Post-CMP cleaning chemistries are the fastest-growing type at an 8.6% CAGR through 2033. Defect budgets at advanced nodes have tightened to the point where residual particles and metal contamination cause direct yield loss, so fabs now treat cleaning as a distinct engineering problem rather than a rinse step. Suppliers of integrated clean platforms benefit, and the shift raises the value of materials companies that can supply matched slurry and cleaning sets.
- Logic Devices Lead Demand While Advanced Packaging Scales Fastest
Logic and foundry devices led applications with 44% share in 2026, driven by the high metal level counts and tight uniformity requirements of leading-edge processors. Memory followed at 33%, supported by very high wafer volumes in DRAM and 3D NAND. Advanced packaging and interposers held 14%, while analog, MEMS and power devices accounted for 9% of value.
Advanced packaging is the fastest-growing application at a 10.2% CAGR through 2033. Chiplet designs and hybrid bonding require bonding surfaces flat within very narrow tolerances, so planarization is now a gating step in package assembly rather than an optional one. The implication for suppliers is that application engineering capability must extend beyond wafer fabs into packaging environments, where tool footprints, contamination controls and volume economics all differ.
- Foundries Dominate Spending While OSAT Providers Grow Fastest
Foundries led end users with 46% share in 2026, a position that follows from their concentration of leading-edge logic capacity and their high planarization step counts. Integrated device manufacturers held 36%, covering memory, analog and power production. OSAT and packaging houses accounted for 13%, while research institutes and pilot lines represented 5% of value.
OSAT providers are the fastest-growing end user at a 9.4% CAGR through 2033, as wafer-level packaging and bonding work migrates into outsourced assembly and test operations. These customers buy differently from wafer fabs: smaller tool counts, mixed substrate types and shorter qualification windows. Suppliers that adapt commercial models and service coverage to that profile capture a growing share of planarization spending as packaging value rises within the semiconductor supply chain.
Geography Analysis
- Which Region Is Growing Fastest in the Chemical Mechanical Planarization Market?
North America is growing fastest, at an 8.4% CAGR between 2026 and 2033, from a 17% share in 2026. Growth is concentrated in the United States, where large new logic and memory fabs announced over recent years are now moving from construction into tool installation and process qualification. Those phases generate the heaviest equipment ordering of a fab’s life. National policy support for domestic semiconductor manufacturing underpins the build-out, and customer preference for supply chain resilience encourages materials suppliers to add local blending and distribution. Canada contributes through compound semiconductor and research activity, while Mexico adds back-end assembly capacity serving North American device makers.
- Europe Builds CMP Demand Around Specialty and Automotive Chips
Europe held 12% share in 2026 and is expected to grow at a 6.9% CAGR through 2033. Demand centres on Germany, France, Ireland, the Netherlands and Italy, where capacity focuses on automotive microcontrollers, power devices, sensors and mature-node logic rather than the most advanced nodes. These products need planarization, but fewer steps per wafer than leading-edge logic, which moderates consumable intensity. Regional industrial policy supporting semiconductor self-sufficiency has drawn new fab investment, and research institutes in Belgium and Germany keep advanced process development active. Strict chemical handling and waste regulation also raises demand for low-waste slurry delivery and closed-loop filtration systems.
- Which Region Is Leading the Chemical Mechanical Planarization Market?
Asia Pacific leads with 67% share in 2026 and is expected to grow at a 7.6% CAGR through 2033. Leadership follows from where wafers are actually made: Taiwan, South Korea, China and Japan together hold the majority of global foundry, DRAM and NAND capacity, and planarization demand scales with wafer output. Taiwan concentrates leading-edge logic and advanced packaging, South Korea anchors memory production, and China continues adding mature-node and memory capacity. Japan supplies much of the world’s polishing equipment and consumable materials while operating its own fabs. Dense regional supply chains shorten qualification cycles and keep slurry and pad logistics efficient.
- Latin America Depends on Assembly and Test Activity
Latin America held 1.5% share in 2026 and is expected to grow at a 5.4% CAGR through 2033, the slowest among the five regions. The region has limited front-end wafer fabrication, so planarization demand comes mainly from assembly, test and packaging operations in Mexico, Brazil and Costa Rica serving North American electronics customers. Growth depends on nearshoring of electronics manufacturing and on government efforts to attract semiconductor investment. Constraints include ultrapure water and power infrastructure, a thin pool of process engineers and the cost of importing consumables with limited shelf life. Regional service coverage remains the main barrier suppliers must address.
- Middle East & Africa Advances Early Semiconductor Capability
Middle East & Africa held 2.5% share in 2026 and is expected to grow at a 6.2% CAGR through 2033. Activity concentrates in Israel, which has established wafer fabrication and strong design capability, and in Gulf states where sovereign investment programmes are funding technology diversification away from hydrocarbons. South Africa contributes research and specialty device work. Demand is driven by capability building rather than mass production, so purchases skew toward equipment, pilot lines and university cleanrooms rather than high-volume consumable supply. Abundant low-cost energy and new industrial zones support the ambition, while workforce development and utility-grade infrastructure remain the limiting factors.
Competitive Landscape
The chemical mechanical planarization market is moderately concentrated, with distinct structures on the equipment and materials sides. A small number of suppliers account for most polishing system placements, because the installed base, process recipes and service networks required to support a fab take decades to build. Materials competition is somewhat broader, though qualification barriers still limit how quickly share moves. Consolidation has gradually brought slurries, pads, filtration and cleaning chemistries under fewer corporate roofs, reflecting customer preference for suppliers that can support a complete planarization module rather than a single item.
Vendors compete on process performance and on total cost of ownership rather than on unit price. On the equipment side, the differentiators are removal uniformity across the wafer, endpoint detection accuracy, throughput per cleanroom square metre, integration with cleaning and metrology, and the automation that reduces operator handling. On the materials side, competition turns on defect performance, selectivity between films, consistency between production lots and shelf stability. Sustainability has become a real competitive factor, since fabs face pressure to cut water consumption, abrasive waste and chemical discharge. Suppliers offering slurry reclaim, extended pad life and lower-consumption delivery systems gain genuine commercial advantage.
Strategic activity concentrates on capability breadth and regional presence. Suppliers have broadened portfolios so a single vendor can qualify matched slurry, pad and cleaning sets, which shortens customer qualification time and strengthens the relationship. Joint development work with foundries, memory makers and packaging houses is common, because new node and bonding requirements must be solved before volume production begins. Regional blending plants, spare parts depots and local application engineering teams matter because tool uptime and consumable freshness determine fab output.
Competitive direction points toward deeper integration between equipment, consumables and process data, and toward advanced packaging as the main arena where new positions can still be won.
Industry Leaders
- Applied Materials, Inc.
- Ebara Corporation
- Entegris, Inc.
- DuPont de Nemours, Inc.
- Fujimi Incorporated
- Tokyo Seimitsu Co., Ltd.
- Merck KGaA
- Resonac Holdings Corporation
Companies Covered in the Report
- Applied Materials, Inc.
- Ebara Corporation
- Tokyo Seimitsu Co., Ltd.
- SpeedFam Co., Ltd.
- Revasum, Inc.
- Axus Technology, LLC
- ACM Research, Inc.
- Entegris, Inc.
- DuPont de Nemours, Inc.
- Fujimi Incorporated
- Merck KGaA
- Resonac Holdings Corporation
- JSR Corporation
- Soulbrain Co., Ltd.
- KC Tech Co., Ltd.
- Hubei Dinglong Co., Ltd.
- Fujifilm Holdings Corporation
- AGC Inc.
- Saint-Gobain
Chemical Mechanical Planarization Market Report Scope
| Metric | Value |
| Study Period | 2020–2033 |
| Market Size 2026 | US$ 7.20 Billion |
| Market Size 2033 | US$ 11.95 Billion |
| CAGR 2026–2033 | 7.5% |
| Absolute Dollar Opportunity | US$ 4.75 Billion |
| Largest Market | Asia Pacific (67% share in 2026) |
| Fastest-Growing Market | North America (8.4% CAGR 2026–2033) |
| Market Concentration | Moderately Concentrated |
| Major Players | Applied Materials, Inc., Ebara Corporation, Entegris, Inc., DuPont de Nemours, Inc., Fujimi Incorporated |
Chemical Mechanical Planarization Market Segmentation
- Executive Summary
- Chemical Mechanical Planarization Market Snapshot
- Future Projections
- Key Market Trends
- Regional Snapshot
- Market Overview
- Market Definition and Report Scope
- Market Dynamics
- Drivers
- Restraints
- Market Opportunities
- Global Chemical Mechanical Planarization Market Outlook, 2026–2033
- Global Chemical Mechanical Planarization Market Outlook, by Offering, Value (US$ Billion), 2026–2033
- CMP Equipment
- CMP Consumables
- Services and Support
- Global Chemical Mechanical Planarization Market Outlook, by Consumable Type, Value (US$ Billion), 2026–2033
- Slurries
- Polishing Pads
- Post-CMP Cleaning Chemistries
- Conditioners and Diamond Discs
- Retaining Rings and Other Parts
- Global Chemical Mechanical Planarization Market Outlook, by Application, Value (US$ Billion), 2026–2033
- Logic and Foundry Devices
- Memory Devices
- Advanced Packaging and Interposers
- Analog, MEMS and Power Devices
- Global Chemical Mechanical Planarization Market Outlook, by End User, Value (US$ Billion), 2026–2033
- Foundries
- Integrated Device Manufacturers
- OSAT and Packaging Houses
- Research Institutes and Pilot Lines
- Global Chemical Mechanical Planarization Market Outlook, by Region, Value (US$ Billion), 2026–2033
- North America
- Europe
- Asia Pacific
- Latin America
- Middle East & Africa
- Global Chemical Mechanical Planarization Market Outlook, by Offering, Value (US$ Billion), 2026–2033
- North America Chemical Mechanical Planarization Market Outlook, 2026–2033
- North America Chemical Mechanical Planarization Market Outlook, by Offering, Value (US$ Billion), 2026–2033
- CMP Equipment
- CMP Consumables
- Services and Support
- North America Chemical Mechanical Planarization Market Outlook, by Consumable Type, Value (US$ Billion), 2026–2033
- Slurries
- Polishing Pads
- Post-CMP Cleaning Chemistries
- Conditioners and Diamond Discs
- Retaining Rings and Other Parts
- North America Chemical Mechanical Planarization Market Outlook, by Application, Value (US$ Billion), 2026–2033
- Logic and Foundry Devices
- Memory Devices
- Advanced Packaging and Interposers
- Analog, MEMS and Power Devices
- North America Chemical Mechanical Planarization Market Outlook, by End User, Value (US$ Billion), 2026–2033
- Foundries
- Integrated Device Manufacturers
- OSAT and Packaging Houses
- Research Institutes and Pilot Lines
- North America Chemical Mechanical Planarization Market Outlook, by Country, Value (US$ Billion), 2026–2033
- United States Chemical Mechanical Planarization Market Outlook, by Offering, 2026–2033
- United States Chemical Mechanical Planarization Market Outlook, by Consumable Type, 2026–2033
- United States Chemical Mechanical Planarization Market Outlook, by Application, 2026–2033
- United States Chemical Mechanical Planarization Market Outlook, by End User, 2026–2033
- Canada Chemical Mechanical Planarization Market Outlook, by Offering, 2026–2033
- Canada Chemical Mechanical Planarization Market Outlook, by Consumable Type, 2026–2033
- Canada Chemical Mechanical Planarization Market Outlook, by Application, 2026–2033
- Canada Chemical Mechanical Planarization Market Outlook, by End User, 2026–2033
- Mexico Chemical Mechanical Planarization Market Outlook, by Offering, 2026–2033
- Mexico Chemical Mechanical Planarization Market Outlook, by Consumable Type, 2026–2033
- Mexico Chemical Mechanical Planarization Market Outlook, by Application, 2026–2033
- Mexico Chemical Mechanical Planarization Market Outlook, by End User, 2026–2033
- North America Chemical Mechanical Planarization Market Outlook, by Offering, Value (US$ Billion), 2026–2033
- Europe Chemical Mechanical Planarization Market Outlook, 2026–2033
- Europe Chemical Mechanical Planarization Market Outlook, by Offering, Value (US$ Billion), 2026–2033
- CMP Equipment
- CMP Consumables
- Services and Support
- Europe Chemical Mechanical Planarization Market Outlook, by Consumable Type, Value (US$ Billion), 2026–2033
- Slurries
- Polishing Pads
- Post-CMP Cleaning Chemistries
- Conditioners and Diamond Discs
- Retaining Rings and Other Parts
- Europe Chemical Mechanical Planarization Market Outlook, by Application, Value (US$ Billion), 2026–2033
- Logic and Foundry Devices
- Memory Devices
- Advanced Packaging and Interposers
- Analog, MEMS and Power Devices
- Europe Chemical Mechanical Planarization Market Outlook, by End User, Value (US$ Billion), 2026–2033
- Foundries
- Integrated Device Manufacturers
- OSAT and Packaging Houses
- Research Institutes and Pilot Lines
- Europe Chemical Mechanical Planarization Market Outlook, by Country, Value (US$ Billion), 2026–2033
- Germany Chemical Mechanical Planarization Market Outlook, by Offering, 2026–2033
- Germany Chemical Mechanical Planarization Market Outlook, by Consumable Type, 2026–2033
- Germany Chemical Mechanical Planarization Market Outlook, by Application, 2026–2033
- Germany Chemical Mechanical Planarization Market Outlook, by End User, 2026–2033
- France Chemical Mechanical Planarization Market Outlook, by Offering, 2026–2033
- France Chemical Mechanical Planarization Market Outlook, by Consumable Type, 2026–2033
- France Chemical Mechanical Planarization Market Outlook, by Application, 2026–2033
- France Chemical Mechanical Planarization Market Outlook, by End User, 2026–2033
- Ireland Chemical Mechanical Planarization Market Outlook, by Offering, 2026–2033
- Ireland Chemical Mechanical Planarization Market Outlook, by Consumable Type, 2026–2033
- Ireland Chemical Mechanical Planarization Market Outlook, by Application, 2026–2033
- Ireland Chemical Mechanical Planarization Market Outlook, by End User, 2026–2033
- Netherlands Chemical Mechanical Planarization Market Outlook, by Offering, 2026–2033
- Netherlands Chemical Mechanical Planarization Market Outlook, by Consumable Type, 2026–2033
- Netherlands Chemical Mechanical Planarization Market Outlook, by Application, 2026–2033
- Netherlands Chemical Mechanical Planarization Market Outlook, by End User, 2026–2033
- Italy Chemical Mechanical Planarization Market Outlook, by Offering, 2026–2033
- Italy Chemical Mechanical Planarization Market Outlook, by Consumable Type, 2026–2033
- Italy Chemical Mechanical Planarization Market Outlook, by Application, 2026–2033
- Italy Chemical Mechanical Planarization Market Outlook, by End User, 2026–2033
- Belgium Chemical Mechanical Planarization Market Outlook, by Offering, 2026–2033
- Belgium Chemical Mechanical Planarization Market Outlook, by Consumable Type, 2026–2033
- Belgium Chemical Mechanical Planarization Market Outlook, by Application, 2026–2033
- Belgium Chemical Mechanical Planarization Market Outlook, by End User, 2026–2033
- Europe Chemical Mechanical Planarization Market Outlook, by Offering, Value (US$ Billion), 2026–2033
- Asia Pacific Chemical Mechanical Planarization Market Outlook, 2026–2033
- Asia Pacific Chemical Mechanical Planarization Market Outlook, by Offering, Value (US$ Billion), 2026–2033
- CMP Equipment
- CMP Consumables
- Services and Support
- Asia Pacific Chemical Mechanical Planarization Market Outlook, by Consumable Type, Value (US$ Billion), 2026–2033
- Slurries
- Polishing Pads
- Post-CMP Cleaning Chemistries
- Conditioners and Diamond Discs
- Retaining Rings and Other Parts
- Asia Pacific Chemical Mechanical Planarization Market Outlook, by Application, Value (US$ Billion), 2026–2033
- Logic and Foundry Devices
- Memory Devices
- Advanced Packaging and Interposers
- Analog, MEMS and Power Devices
- Asia Pacific Chemical Mechanical Planarization Market Outlook, by End User, Value (US$ Billion), 2026–2033
- Foundries
- Integrated Device Manufacturers
- OSAT and Packaging Houses
- Research Institutes and Pilot Lines
- Asia Pacific Chemical Mechanical Planarization Market Outlook, by Country, Value (US$ Billion), 2026–2033
- Taiwan Chemical Mechanical Planarization Market Outlook, by Offering, 2026–2033
- Taiwan Chemical Mechanical Planarization Market Outlook, by Consumable Type, 2026–2033
- Taiwan Chemical Mechanical Planarization Market Outlook, by Application, 2026–2033
- Taiwan Chemical Mechanical Planarization Market Outlook, by End User, 2026–2033
- South Korea Chemical Mechanical Planarization Market Outlook, by Offering, 2026–2033
- South Korea Chemical Mechanical Planarization Market Outlook, by Consumable Type, 2026–2033
- South Korea Chemical Mechanical Planarization Market Outlook, by Application, 2026–2033
- South Korea Chemical Mechanical Planarization Market Outlook, by End User, 2026–2033
- China Chemical Mechanical Planarization Market Outlook, by Offering, 2026–2033
- China Chemical Mechanical Planarization Market Outlook, by Consumable Type, 2026–2033
- China Chemical Mechanical Planarization Market Outlook, by Application, 2026–2033
- China Chemical Mechanical Planarization Market Outlook, by End User, 2026–2033
- Japan Chemical Mechanical Planarization Market Outlook, by Offering, 2026–2033
- Japan Chemical Mechanical Planarization Market Outlook, by Consumable Type, 2026–2033
- Japan Chemical Mechanical Planarization Market Outlook, by Application, 2026–2033
- Japan Chemical Mechanical Planarization Market Outlook, by End User, 2026–2033
- Asia Pacific Chemical Mechanical Planarization Market Outlook, by Offering, Value (US$ Billion), 2026–2033
- Latin America Chemical Mechanical Planarization Market Outlook, 2026–2033
- Latin America Chemical Mechanical Planarization Market Outlook, by Offering, Value (US$ Billion), 2026–2033
- CMP Equipment
- CMP Consumables
- Services and Support
- Latin America Chemical Mechanical Planarization Market Outlook, by Consumable Type, Value (US$ Billion), 2026–2033
- Slurries
- Polishing Pads
- Post-CMP Cleaning Chemistries
- Conditioners and Diamond Discs
- Retaining Rings and Other Parts
- Latin America Chemical Mechanical Planarization Market Outlook, by Application, Value (US$ Billion), 2026–2033
- Logic and Foundry Devices
- Memory Devices
- Advanced Packaging and Interposers
- Analog, MEMS and Power Devices
- Latin America Chemical Mechanical Planarization Market Outlook, by End User, Value (US$ Billion), 2026–2033
- Foundries
- Integrated Device Manufacturers
- OSAT and Packaging Houses
- Research Institutes and Pilot Lines
- Latin America Chemical Mechanical Planarization Market Outlook, by Country, Value (US$ Billion), 2026–2033
- Mexico Chemical Mechanical Planarization Market Outlook, by Offering, 2026–2033
- Mexico Chemical Mechanical Planarization Market Outlook, by Consumable Type, 2026–2033
- Mexico Chemical Mechanical Planarization Market Outlook, by Application, 2026–2033
- Mexico Chemical Mechanical Planarization Market Outlook, by End User, 2026–2033
- Brazil Chemical Mechanical Planarization Market Outlook, by Offering, 2026–2033
- Brazil Chemical Mechanical Planarization Market Outlook, by Consumable Type, 2026–2033
- Brazil Chemical Mechanical Planarization Market Outlook, by Application, 2026–2033
- Brazil Chemical Mechanical Planarization Market Outlook, by End User, 2026–2033
- Costa Rica Chemical Mechanical Planarization Market Outlook, by Offering, 2026–2033
- Costa Rica Chemical Mechanical Planarization Market Outlook, by Consumable Type, 2026–2033
- Costa Rica Chemical Mechanical Planarization Market Outlook, by Application, 2026–2033
- Costa Rica Chemical Mechanical Planarization Market Outlook, by End User, 2026–2033
- Latin America Chemical Mechanical Planarization Market Outlook, by Offering, Value (US$ Billion), 2026–2033
- Middle East & Africa Chemical Mechanical Planarization Market Outlook, 2026–2033
- Middle East & Africa Chemical Mechanical Planarization Market Outlook, by Offering, Value (US$ Billion), 2026–2033
- CMP Equipment
- CMP Consumables
- Services and Support
- Middle East & Africa Chemical Mechanical Planarization Market Outlook, by Consumable Type, Value (US$ Billion), 2026–2033
- Slurries
- Polishing Pads
- Post-CMP Cleaning Chemistries
- Conditioners and Diamond Discs
- Retaining Rings and Other Parts
- Middle East & Africa Chemical Mechanical Planarization Market Outlook, by Application, Value (US$ Billion), 2026–2033
- Logic and Foundry Devices
- Memory Devices
- Advanced Packaging and Interposers
- Analog, MEMS and Power Devices
- Middle East & Africa Chemical Mechanical Planarization Market Outlook, by End User, Value (US$ Billion), 2026–2033
- Foundries
- Integrated Device Manufacturers
- OSAT and Packaging Houses
- Research Institutes and Pilot Lines
- Middle East & Africa Chemical Mechanical Planarization Market Outlook, by Country and Subregion, Value (US$ Billion), 2026–2033
- Israel Chemical Mechanical Planarization Market Outlook, by Offering, 2026–2033
- Israel Chemical Mechanical Planarization Market Outlook, by Consumable Type, 2026–2033
- Israel Chemical Mechanical Planarization Market Outlook, by Application, 2026–2033
- Israel Chemical Mechanical Planarization Market Outlook, by End User, 2026–2033
- Gulf states Chemical Mechanical Planarization Market Outlook, by Offering, 2026–2033
- Gulf states Chemical Mechanical Planarization Market Outlook, by Consumable Type, 2026–2033
- Gulf states Chemical Mechanical Planarization Market Outlook, by Application, 2026–2033
- Gulf states Chemical Mechanical Planarization Market Outlook, by End User, 2026–2033
- South Africa Chemical Mechanical Planarization Market Outlook, by Offering, 2026–2033
- South Africa Chemical Mechanical Planarization Market Outlook, by Consumable Type, 2026–2033
- South Africa Chemical Mechanical Planarization Market Outlook, by Application, 2026–2033
- South Africa Chemical Mechanical Planarization Market Outlook, by End User, 2026–2033
- Middle East & Africa Chemical Mechanical Planarization Market Outlook, by Offering, Value (US$ Billion), 2026–2033
- Competitive Landscape
- Industry Leaders
- Company Profiles
- Applied Materials, Inc.
- Ebara Corporation
- Tokyo Seimitsu Co., Ltd.
- SpeedFam Co., Ltd.
- Revasum, Inc.
- Axus Technology, LLC
- ACM Research, Inc.
- Entegris, Inc.
- DuPont de Nemours, Inc.
- Fujimi Incorporated
- Merck KGaA
- Resonac Holdings Corporation
- JSR Corporation
- Soulbrain Co., Ltd.
- KC Tech Co., Ltd.
- Hubei Dinglong Co., Ltd.
- Fujifilm Holdings Corporation
- AGC Inc.
- Saint-Gobain
- Appendix
- Research Methodology
- Report Assumptions
- Acronyms and Abbreviations
Offering
- CMP Equipment
- CMP Consumables
- Services and Support
Consumable Type
- Slurries
- Polishing Pads
- Post-CMP Cleaning Chemistries
- Conditioners and Diamond Discs
- Retaining Rings and Other Parts
Application
- Logic and Foundry Devices
- Memory Devices
- Advanced Packaging and Interposers
- Analog, MEMS and Power Devices
End User
- Foundries
- Integrated Device Manufacturers
- OSAT and Packaging Houses
- Research Institutes and Pilot Lines
Region
- North America
- Europe
- Asia Pacific
- Latin America
- Middle East & Africa
Our Research Methodology
Considering the volatility of business today, traditional approaches to strategizing a game plan can be unfruitful if not detrimental. True ambiguity is no way to determine a forecast. A myriad of predetermined factors must be accounted for such as the degree of risk involved, the magnitude of circumstances, as well as conditions or consequences that are not known or unpredictable. To circumvent binary views that cast uncertainty, the application of market research intelligence to strategically posture, move, and enable actionable outcomes is necessary.
View Methodology
Quality Assured
Rigorous Validation Process

Confidentiality Assured
End-to-end Data Security

Custom Research Services
Tailored To Your Objectives
FAQs
The global Chemical Mechanical Planarization market is valued at US$ 7.2 billion in 2026 and is projected to reach US$ 11.95 billion by 2033.
The market is expected to grow at a 7.5% CAGR between 2026 and 2033, creating an absolute dollar opportunity of US$ 4.75 billion.
CMP consumables lead with 56% share in 2026, supported by slurries, which hold 49% of total consumable value across logic and memory fabrication.
Asia Pacific leads with 67% share in 2026, while North America grows fastest at an 8.4% CAGR between 2026 and 2033.
Leading suppliers include Applied Materials, Inc., Ebara Corporation, Entegris, Inc., DuPont de Nemours, Inc. and Fujimi Incorporated, spanning polishing systems, slurries and pads.
Related Reports
SiC GaN Power Semiconductor Market Size, Share, Insights, Competitive Landscape, and Forecast 2026 to 2033
Explore the SiC GaN power semiconductor market outlook for 2026–2033, covering products, power ranges, applications, regions, and key companies.
Serverless Architecture Market Size, Share, Insights, Competitive Landscape, and Forecast 2026 to 2033
Explore the serverless architecture market outlook for 2026–2033, covering services, deployment models, industries, regional trends, and key companies.
Network Sandboxing Market Size, Share, Insights, Competitive Landscape, and Forecast 2026 to 2033
The global network sandboxing market is valued at US$5.8 billion in 2026, reaching US$14.7 billion by 2033, growing at a 14.2% CAGR
Location of Things Market Size, Share, Insights, Competitive Landscape, and Forecast 2026 to 2033
The global location of things market is valued at US$52.31 billion in 2026, reaching US$297.93 billion by 2033, growing at a 28.2% CAGR
Contact Center as a Service Market Size, Share, Insights, Competitive Landscape, and Forecast 2026 to 2033
Explore the contact center as a service market outlook for 2026–2033, including cloud deployment, AI tooling, regional trends, and competitive insights.
Affiliate Software Market Size, Share, Insights, Competitive Landscape, and Forecast 2026 to 2033
Explore the affiliate software market outlook for 2026–2033, including tracking tools, payout trends, regional insights, and competitive analysis.