



LED Drivers and Power Supplies for Horticulture Market
LED Drivers and Power Supplies for Horticulture Market Size, Share, Insights, Competitive Landscape, and Forecast 2026 to 2033
LED Drivers and Power Supplies for Horticulture Market Size and Trend Analysis
How Fast Will Horticultural LED Driver Demand Grow?
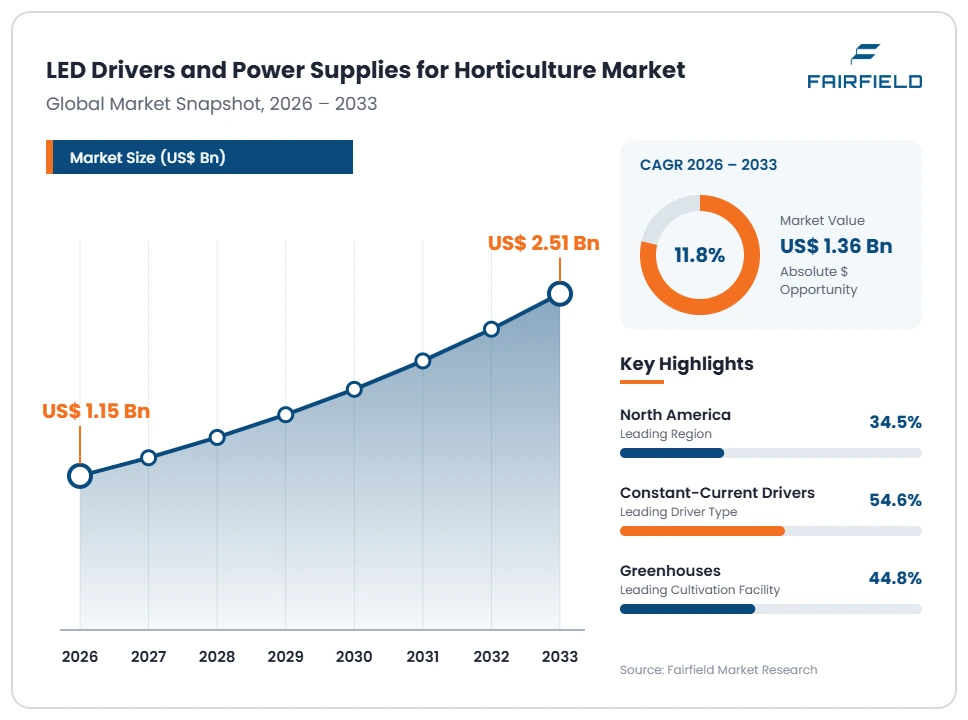
The global LED Drivers and Power Supplies for Horticulture market size is expected to be valued at US$ 1.15 billion in 2026 and projected to reach US$ 2.51 billion by 2033, growing at a CAGR of 11.8% between 2026 and 2033. Growth between 2020 and 2025 ran near a 9.4% CAGR, so the pace is quickening. Fixture wattage keeps rising as growers chase higher light levels in greenhouses and vertical farms. Electricity prices in North America and Europe make driver efficiency a cost lever. The absolute dollar opportunity is US$ 1.36 billion over the forecast period.
Key Report Takeaways
- By Driver Type: Constant-current drivers led with 54.6% share in 2026, while programmable drivers expand at a 14.2% CAGR through 2033, driven by grower demand for recipe-based light scheduling.
- By Power Rating: The 401–800 W class held 38.4% share in 2026, while units above 800 W grow at a 13.9% CAGR through 2033, driven by fixture consolidation in greenhouse bays.
- By Control Interface: 0–10 V analog dimming captured 46.2% share in 2026, while wireless and smart interfaces advance at a 15.1% CAGR through 2033, driven by labour savings from remote control.
- By Cultivation Facility: Greenhouses accounted for 44.8% share in 2026, while vertical and container farms rise at a 14.6% CAGR through 2033, driven by supply contracts with urban grocery buyers.
- By Region: North America led with 34.5% share in 2026, while Asia Pacific is projected to grow at a 14.3% CAGR through 2033, driven by protected cultivation programmes.
Global LED Drivers and Power Supplies for Horticulture Market Trends and Insights
Market Growth Drivers
Rising Fixture Power Density in Controlled Environment Farms
Higher light intensity targets are the single largest pull on driver demand. Growers in greenhouses and indoor farms now specify photosynthetic photon flux levels that older fixtures could not reach. Fixture makers have moved from 320 W platforms toward 600 W and 1,000 W units, raising the value of each power supply.
Tall greenhouse bays and multi-tier racks allow longer light bars, so one high-power driver can serve a run of modules instead of several small units. That cuts wiring, hardware and commissioning labour. Component suppliers have widened their catalogues toward sealed, high-wattage units rated for continuous operation. Standards work at the International Electrotechnical Commission on control gear supports the same shift.
Electricity Costs Make Driver Efficiency a Purchasing Criterion
Energy is the largest controllable operating cost in indoor growing, so efficiency now decides purchases. A driver running at 94% efficiency instead of 88% removes a meaningful share of waste heat and cooling load across a full crop cycle. That calculation favours suppliers who publish tested efficiency and power factor data, moving sales away from low-cost generic supplies toward engineered platforms.
Rebate schemes run by regional utilities and guidance from the U.S. Department of Energy reward qualified horticultural lighting, and qualification lists maintained by the DesignLights Consortium require tested system efficacy. Because the driver sets a ceiling on system efficacy, fixture makers specify higher-grade supplies to stay listed. European grid charges push buyers in the same direction.
Market Restraints
Humidity, Heat and Chemical Exposure Raise Field Failure Rates
Greenhouse environments shorten driver life, and that caution limits spending. Power supplies sit in warm, humid air and meet condensation, fertiliser mist and cleaning chemicals. Field failures are expensive because replacement needs lifts, crop disruption and labour during active growing cycles. Buyers extend evaluation periods, demand longer warranties and slow purchase decisions.
Suppliers answer with potted assemblies, IP66 and IP67 sealed housings, conformal coating and wider ambient temperature ratings. These measures work, but they add material and test cost, which narrows margins at the value end of the market. Smaller fixture builders cannot always absorb that premium, so cheaper units persist in price-sensitive regions, and the resulting quality spread delays conversion projects.
Capital Discipline Among Indoor Farms Slows Replacement Cycles
Tighter funding conditions for controlled environment agriculture have delayed new projects. Several large indoor farming ventures scaled back expansion after margins proved harder than planned, and lenders now ask for proven unit economics before releasing capital. Lighting is a major line item in any build, so postponed facilities translate directly into deferred driver orders.
Established vegetable and ornamental greenhouses with long customer contracts keep investing, while speculative vertical farming projects stay cautious. Equipment vendors have adjusted by offering staged rollouts, leasing structures and retrofit kits that reuse existing fixture housings. These approaches keep volumes moving, but they lower the average order value and shift revenue recognition further into the forecast period.
Market Opportunities
Networked Dimming and Data Services Create New Revenue Streams
Control capability is turning the driver into a sellable platform rather than a passive component. Growers want light recipes that change by crop stage, and dimming during peak tariff hours. Drivers that accept digital commands, report current, temperature and operating hours, and expose that data to farm management software command higher prices.
Adoption is pulled by demand response arrangements with utilities and by the spread of wireless mesh control across large facilities. Dimmable platforms let a site trim load within seconds without harming the crop, which can earn grid payments. Driver makers that publish open protocols are winning design slots with fixture and controls partners.
Conversion of Legacy High-Pressure Sodium Installations
A very large installed base of high-pressure sodium lighting remains in commercial greenhouses, and each conversion needs new drivers. Older magnetic and electronic ballasts cannot run LED modules, so retrofit projects replace the complete power train. Because greenhouses already hold the structure, wiring runs and mounting points, conversion costs far less than a new build.
LED efficacy has improved enough that payback periods fall within normal equipment planning horizons for many crops. Utility incentives and national energy efficiency targets across Europe and North America improve the case further. Suppliers offering drop-in wattage equivalents, flexible input voltage ranges and simple commissioning cut installer time, which lowers perceived risk.
Segment Analysis
- Constant-Current Platforms Hold the Base While Programmable Units Set the Pace
Constant-current drivers led the market with 54.6% share in 2026, because horticultural LED modules need tightly regulated current to hold spectral output and junction temperature stable.
Programmable drivers are growing fastest, at a 14.2% CAGR through 2033. A single stocked unit can be configured for different output currents, dimming curves and fault behaviours, which shrinks fixture inventories and speeds new product launches. Larger operations value the ability to adjust light recipes by crop stage without changing hardware.
The split matters commercially. Volume stays with constant-current platforms, while design wins and software attachment flow to programmable units. Suppliers covering both protect revenue today and position for control-led purchases.
- High-Wattage Classes Capture Spending as Fixture Counts Consolidate
The 401–800 W power class held 38.4% share in 2026, reflecting the sweet spot for greenhouse top lighting and high-bay indoor rooms. At that rating a single driver can power a full light bar assembly without pushing thermal design past practical limits.
Units above 800 W are expanding fastest, at a 13.9% CAGR through 2033. One high-wattage driver feeding multiple modules reduces cabling, conduit, mounting points and commissioning hours, savings that often outweigh the component premium.
Units up to 150 W and the 151–400 W class serve propagation benches and multi-tier racks where clearance is tight. Driver value per facility is therefore rising even where fixture counts are flat.
- Which Control Interface Dominates Horticultural LED Driver Sales?
0–10 V analog dimming dominates, holding 46.2% share in 2026. It is inexpensive, robust in electrically noisy environments and supported by almost every climate computer already installed in commercial greenhouses.
Wireless and smart interfaces are the fastest-growing category, at a 15.1% CAGR through 2033. Large multi-room facilities want zone-level control without pulling control cable through occupied growing space. Wireless commissioning also lets operators reassign zones as crop plans change.
Pulse-width modulation and addressable digital interfaces fill the middle, favoured where precise low-end dimming or per-fixture addressing matters. Drivers supporting analog, digital and wireless control in one family win more fixture platforms than single-protocol products.
- Greenhouses Anchor Volume While Vertical Farms Drive Incremental Growth
Greenhouses accounted for 44.8% share in 2026, the largest cultivation setting for horticultural drivers. Tomato, pepper, cucumber, berry and ornamental producers across temperate regions buy drivers in volume as they convert older lighting.
Vertical and container farms are growing fastest, at a 14.6% CAGR through 2033. These facilities use far more fixtures per square metre of floor area, so driver intensity is high. Leafy greens, herbs and propagation material suit short, repeatable light recipes.
Indoor grow rooms and research facilities complete the picture. Suppliers therefore need two routes to market: price-competitive high-wattage platforms for greenhouse retrofits, and compact units for racked production.
Geography Analysis
- Which Region Is Leading the LED Drivers and Power Supplies for Horticulture Market?
North America leads the market, with 34.5% share in 2026 and a projected 10.6% CAGR through 2033. The United States and Canada hold a deep installed base of commercial greenhouses and controlled environment facilities.
Utility rebate programmes across many states and provinces lower the effective cost of qualified fixtures, and qualification lists maintained by the DesignLights Consortium make driver efficiency a condition of eligibility. Safety certification through UL Solutions is a standard requirement, which favours established suppliers. High electricity prices in the Northeast and parts of Canada strengthen the payback case for efficient power supplies.
- Europe Combines Energy Policy and Advanced Greenhouse Practice
Europe held 29.8% share in 2026 and is set to grow at an 11.2% CAGR through 2033. The Netherlands anchors the region with the world’s most intensive glasshouse sector, supported by Spain, France, Germany, Poland and the Nordic countries.
Volatile gas and power prices pushed growers to cut consumption, making efficient drivers and precise dimming central to operating plans. Efficiency and safety requirements set through CENELEC standards shape product design across member states. Nordic and Polish growers extend production seasons with long lighting hours, which raises driver duty cycles.
- Which Region Is Growing Fastest in the LED Drivers and Power Supplies for Horticulture Market?
Asia Pacific is growing fastest, at a 14.3% CAGR through 2033, from 26.2% share in 2026. China is the largest contributor, with substantial greenhouse construction and a dense local manufacturing base for power electronics. Japan and South Korea focus on plant factories, while Australia and New Zealand invest in protected horticulture.
Government programmes supporting food security and farmland productivity encourage facility upgrades across several economies. Local driver manufacturing keeps costs competitive and shortens lead times for regional fixture makers. Grid constraints also raise interest in dimmable platforms that can shed load.
- Latin America Builds Export Horticulture With Selective Lighting Investment
Latin America represented 5.6% share in 2026 and is projected to advance at a 12.4% CAGR through 2033. Mexico, Colombia, Brazil, Chile and Peru lead, supported by export flows of berries, tomatoes, peppers and cut flowers into North American and European markets.
Investment concentrates on high-value crops and on altitude or winter situations where natural light limits yield. Colombian and Ecuadorian flower operations use lighting to hit precise delivery windows for major holidays. Variable grid reliability favours drivers with wide input voltage tolerance and strong surge protection.
- Middle East & Africa Turn to Controlled Environments for Food Security
Middle East & Africa held 3.9% share in 2026 and should grow at an 11.9% CAGR through 2033. The United Arab Emirates, Saudi Arabia, Qatar and Israel drive most activity, with South Africa, Kenya and Morocco contributing through export horticulture.
National food security programmes in the Gulf support greenhouse construction, often alongside solar generation to offset power costs. High ambient temperatures stress electronics, so buyers favour sealed drivers with wide temperature ratings. African flower and vegetable exporters adopt lighting where premium markets justify the capital.
Competitive Landscape
The market is moderately concentrated. A small group of specialist power electronics manufacturers supplies a large share of horticultural driver volume, while lighting groups that build complete fixtures design or source their own power stages. Below that tier sits a wide field of regional manufacturers competing on price and lead time. Vendors that treated horticulture as a variant of general lighting lost ground to those building purpose-designed platforms.
Efficiency and power factor decide whether a fixture qualifies for rebate programmes, so they are table stakes rather than differentiators. Beyond that, suppliers compete on ingress protection, surge withstand, ambient temperature rating, lifetime claims and the breadth of dimming interfaces supported. Newer entrants from industrial and telecom power supply bring strong thermal and reliability engineering, credible because horticultural duty cycles resemble industrial ones.
Strategic activity follows the same logic. Suppliers extend product families upward in wattage to match larger fixtures, add wireless and digital control options to stay specified, and widen regional manufacturing and certification coverage to shorten delivery. Investment in test capability for humidity, salt mist and thermal cycling supports the warranty terms growers now expect.
Industry Leaders
- MEAN WELL Enterprises Co., Ltd.
- Inventronics, Inc.
- Signify N.V.
- Tridonic GmbH & Co KG
- Delta Electronics, Inc.
- eldoLED, part of Acuity Brands, Inc.
Companies Covered in the Report
- MEAN WELL Enterprises Co., Ltd.
- Inventronics, Inc.
- Signify N.V.
- Tridonic GmbH & Co KG
- Delta Electronics, Inc.
- eldoLED, part of Acuity Brands, Inc.
- Fulham Co., Inc.
- MOONS’ Industries Co., Ltd.
- LIFUD Technology Co., Ltd.
- Sosen Electronics Co., Ltd.
- Done Power Technology Co., Ltd.
- Magtech Industries Corporation
- Phihong Technology Co., Ltd.
- TDK-Lambda Corporation
LED Drivers and Power Supplies for Horticulture Market Report Scope
| Metric | Value |
| Study Period | 2020–2033 |
| Market Size 2026 | US$ 1.15 Billion |
| Market Size 2033 | US$ 2.51 Billion |
| CAGR 2026–2033 | 11.8% |
| Absolute Dollar Opportunity | US$ 1.36 Billion |
| Largest Market | North America (34.5% share in 2026) |
| Fastest-Growing Market | Asia Pacific (14.3% CAGR 2026–2033) |
| Market Concentration | Moderately Concentrated |
| Major Players | MEAN WELL Enterprises Co., Ltd., Inventronics, Inc., Signify N.V., Tridonic GmbH & Co KG, Delta Electronics, Inc. |
LED Drivers and Power Supplies for Horticulture Market Segmentation
- Executive Summary
- Global LED Drivers and Power Supplies for Horticulture Market Snapshot
- Future Projections, 2026–2033
- Key Industry Highlights
- Regional Snapshot
- Market Overview
- Market Definition and Report Scope
- Historical Market Trends
- Market Dynamics
- Drivers
- Restraints
- Market Opportunities
- Global LED Drivers and Power Supplies for Horticulture Market Outlook, 2026–2033
- Global LED Drivers and Power Supplies for Horticulture Market Outlook, by Driver Type, Value (US$ Billion), 2026–2033
- Constant-Current Drivers
- Constant-Voltage Drivers
- Programmable Drivers
- AC-Direct Drivers
- Global LED Drivers and Power Supplies for Horticulture Market Outlook, by Power Rating, Value (US$ Billion), 2026–2033
- Up to 150 W
- 151–400 W
- 401–800 W
- Above 800 W
- Global LED Drivers and Power Supplies for Horticulture Market Outlook, by Control Interface, Value (US$ Billion), 2026–2033
- 0–10 V Analog
- Pulse-Width Modulation
- Addressable Digital
- Wireless and Smart
- Global LED Drivers and Power Supplies for Horticulture Market Outlook, by Cultivation Facility, Value (US$ Billion), 2026–2033
- Greenhouses
- Vertical and Container Farms
- Indoor Grow Rooms
- Research and Plant Science Facilities
- Global LED Drivers and Power Supplies for Horticulture Market Outlook, by Region, Value (US$ Billion), 2026–2033
- North America
- Europe
- Asia Pacific
- Latin America
- Middle East & Africa
- Global LED Drivers and Power Supplies for Horticulture Market Outlook, by Driver Type, Value (US$ Billion), 2026–2033
- North America LED Drivers and Power Supplies for Horticulture Market Outlook, 2026–2033
- North America LED Drivers and Power Supplies for Horticulture Market Outlook, by Driver Type, Value (US$ Billion), 2026–2033
- Constant-Current Drivers
- Constant-Voltage Drivers
- Programmable Drivers
- AC-Direct Drivers
- North America LED Drivers and Power Supplies for Horticulture Market Outlook, by Power Rating, Value (US$ Billion), 2026–2033
- Up to 150 W
- 151–400 W
- 401–800 W
- Above 800 W
- North America LED Drivers and Power Supplies for Horticulture Market Outlook, by Control Interface, Value (US$ Billion), 2026–2033
- 0–10 V Analog
- Pulse-Width Modulation
- Addressable Digital
- Wireless and Smart
- North America LED Drivers and Power Supplies for Horticulture Market Outlook, by Cultivation Facility, Value (US$ Billion), 2026–2033
- Greenhouses
- Vertical and Container Farms
- Indoor Grow Rooms
- Research and Plant Science Facilities
- North America LED Drivers and Power Supplies for Horticulture Market Outlook, by Country, Value (US$ Billion), 2026–2033
- United States LED Drivers and Power Supplies for Horticulture Market Outlook, by Driver Type, 2026–2033
- United States LED Drivers and Power Supplies for Horticulture Market Outlook, by Power Rating, 2026–2033
- United States LED Drivers and Power Supplies for Horticulture Market Outlook, by Control Interface, 2026–2033
- United States LED Drivers and Power Supplies for Horticulture Market Outlook, by Cultivation Facility, 2026–2033
- Canada LED Drivers and Power Supplies for Horticulture Market Outlook, by Driver Type, 2026–2033
- Canada LED Drivers and Power Supplies for Horticulture Market Outlook, by Power Rating, 2026–2033
- Canada LED Drivers and Power Supplies for Horticulture Market Outlook, by Control Interface, 2026–2033
- Canada LED Drivers and Power Supplies for Horticulture Market Outlook, by Cultivation Facility, 2026–2033
- North America LED Drivers and Power Supplies for Horticulture Market Outlook, by Driver Type, Value (US$ Billion), 2026–2033
- Europe LED Drivers and Power Supplies for Horticulture Market Outlook, 2026–2033
- Europe LED Drivers and Power Supplies for Horticulture Market Outlook, by Driver Type, Value (US$ Billion), 2026–2033
- Constant-Current Drivers
- Constant-Voltage Drivers
- Programmable Drivers
- AC-Direct Drivers
- Europe LED Drivers and Power Supplies for Horticulture Market Outlook, by Power Rating, Value (US$ Billion), 2026–2033
- Up to 150 W
- 151–400 W
- 401–800 W
- Above 800 W
- Europe LED Drivers and Power Supplies for Horticulture Market Outlook, by Control Interface, Value (US$ Billion), 2026–2033
- 0–10 V Analog
- Pulse-Width Modulation
- Addressable Digital
- Wireless and Smart
- Europe LED Drivers and Power Supplies for Horticulture Market Outlook, by Cultivation Facility, Value (US$ Billion), 2026–2033
- Greenhouses
- Vertical and Container Farms
- Indoor Grow Rooms
- Research and Plant Science Facilities
- Europe LED Drivers and Power Supplies for Horticulture Market Outlook, by Country and Subregion, Value (US$ Billion), 2026–2033
- Netherlands LED Drivers and Power Supplies for Horticulture Market Outlook, by Driver Type, 2026–2033
- Netherlands LED Drivers and Power Supplies for Horticulture Market Outlook, by Power Rating, 2026–2033
- Netherlands LED Drivers and Power Supplies for Horticulture Market Outlook, by Control Interface, 2026–2033
- Netherlands LED Drivers and Power Supplies for Horticulture Market Outlook, by Cultivation Facility, 2026–2033
- Spain LED Drivers and Power Supplies for Horticulture Market Outlook, by Driver Type, 2026–2033
- Spain LED Drivers and Power Supplies for Horticulture Market Outlook, by Power Rating, 2026–2033
- Spain LED Drivers and Power Supplies for Horticulture Market Outlook, by Control Interface, 2026–2033
- Spain LED Drivers and Power Supplies for Horticulture Market Outlook, by Cultivation Facility, 2026–2033
- France LED Drivers and Power Supplies for Horticulture Market Outlook, by Driver Type, 2026–2033
- France LED Drivers and Power Supplies for Horticulture Market Outlook, by Power Rating, 2026–2033
- France LED Drivers and Power Supplies for Horticulture Market Outlook, by Control Interface, 2026–2033
- France LED Drivers and Power Supplies for Horticulture Market Outlook, by Cultivation Facility, 2026–2033
- Germany LED Drivers and Power Supplies for Horticulture Market Outlook, by Driver Type, 2026–2033
- Germany LED Drivers and Power Supplies for Horticulture Market Outlook, by Power Rating, 2026–2033
- Germany LED Drivers and Power Supplies for Horticulture Market Outlook, by Control Interface, 2026–2033
- Germany LED Drivers and Power Supplies for Horticulture Market Outlook, by Cultivation Facility, 2026–2033
- Poland LED Drivers and Power Supplies for Horticulture Market Outlook, by Driver Type, 2026–2033
- Poland LED Drivers and Power Supplies for Horticulture Market Outlook, by Power Rating, 2026–2033
- Poland LED Drivers and Power Supplies for Horticulture Market Outlook, by Control Interface, 2026–2033
- Poland LED Drivers and Power Supplies for Horticulture Market Outlook, by Cultivation Facility, 2026–2033
- Nordic countries LED Drivers and Power Supplies for Horticulture Market Outlook, by Driver Type, 2026–2033
- Nordic countries LED Drivers and Power Supplies for Horticulture Market Outlook, by Power Rating, 2026–2033
- Nordic countries LED Drivers and Power Supplies for Horticulture Market Outlook, by Control Interface, 2026–2033
- Nordic countries LED Drivers and Power Supplies for Horticulture Market Outlook, by Cultivation Facility, 2026–2033
- Europe LED Drivers and Power Supplies for Horticulture Market Outlook, by Driver Type, Value (US$ Billion), 2026–2033
- Asia Pacific LED Drivers and Power Supplies for Horticulture Market Outlook, 2026–2033
- Asia Pacific LED Drivers and Power Supplies for Horticulture Market Outlook, by Driver Type, Value (US$ Billion), 2026–2033
- Constant-Current Drivers
- Constant-Voltage Drivers
- Programmable Drivers
- AC-Direct Drivers
- Asia Pacific LED Drivers and Power Supplies for Horticulture Market Outlook, by Power Rating, Value (US$ Billion), 2026–2033
- Up to 150 W
- 151–400 W
- 401–800 W
- Above 800 W
- Asia Pacific LED Drivers and Power Supplies for Horticulture Market Outlook, by Control Interface, Value (US$ Billion), 2026–2033
- 0–10 V Analog
- Pulse-Width Modulation
- Addressable Digital
- Wireless and Smart
- Asia Pacific LED Drivers and Power Supplies for Horticulture Market Outlook, by Cultivation Facility, Value (US$ Billion), 2026–2033
- Greenhouses
- Vertical and Container Farms
- Indoor Grow Rooms
- Research and Plant Science Facilities
- Asia Pacific LED Drivers and Power Supplies for Horticulture Market Outlook, by Country, Value (US$ Billion), 2026–2033
- China LED Drivers and Power Supplies for Horticulture Market Outlook, by Driver Type, 2026–2033
- China LED Drivers and Power Supplies for Horticulture Market Outlook, by Power Rating, 2026–2033
- China LED Drivers and Power Supplies for Horticulture Market Outlook, by Control Interface, 2026–2033
- China LED Drivers and Power Supplies for Horticulture Market Outlook, by Cultivation Facility, 2026–2033
- Japan LED Drivers and Power Supplies for Horticulture Market Outlook, by Driver Type, 2026–2033
- Japan LED Drivers and Power Supplies for Horticulture Market Outlook, by Power Rating, 2026–2033
- Japan LED Drivers and Power Supplies for Horticulture Market Outlook, by Control Interface, 2026–2033
- Japan LED Drivers and Power Supplies for Horticulture Market Outlook, by Cultivation Facility, 2026–2033
- South Korea LED Drivers and Power Supplies for Horticulture Market Outlook, by Driver Type, 2026–2033
- South Korea LED Drivers and Power Supplies for Horticulture Market Outlook, by Power Rating, 2026–2033
- South Korea LED Drivers and Power Supplies for Horticulture Market Outlook, by Control Interface, 2026–2033
- South Korea LED Drivers and Power Supplies for Horticulture Market Outlook, by Cultivation Facility, 2026–2033
- Australia LED Drivers and Power Supplies for Horticulture Market Outlook, by Driver Type, 2026–2033
- Australia LED Drivers and Power Supplies for Horticulture Market Outlook, by Power Rating, 2026–2033
- Australia LED Drivers and Power Supplies for Horticulture Market Outlook, by Control Interface, 2026–2033
- Australia LED Drivers and Power Supplies for Horticulture Market Outlook, by Cultivation Facility, 2026–2033
- New Zealand LED Drivers and Power Supplies for Horticulture Market Outlook, by Driver Type, 2026–2033
- New Zealand LED Drivers and Power Supplies for Horticulture Market Outlook, by Power Rating, 2026–2033
- New Zealand LED Drivers and Power Supplies for Horticulture Market Outlook, by Control Interface, 2026–2033
- New Zealand LED Drivers and Power Supplies for Horticulture Market Outlook, by Cultivation Facility, 2026–2033
- Asia Pacific LED Drivers and Power Supplies for Horticulture Market Outlook, by Driver Type, Value (US$ Billion), 2026–2033
- Latin America LED Drivers and Power Supplies for Horticulture Market Outlook, 2026–2033
- Latin America LED Drivers and Power Supplies for Horticulture Market Outlook, by Driver Type, Value (US$ Billion), 2026–2033
- Constant-Current Drivers
- Constant-Voltage Drivers
- Programmable Drivers
- AC-Direct Drivers
- Latin America LED Drivers and Power Supplies for Horticulture Market Outlook, by Power Rating, Value (US$ Billion), 2026–2033
- Up to 150 W
- 151–400 W
- 401–800 W
- Above 800 W
- Latin America LED Drivers and Power Supplies for Horticulture Market Outlook, by Control Interface, Value (US$ Billion), 2026–2033
- 0–10 V Analog
- Pulse-Width Modulation
- Addressable Digital
- Wireless and Smart
- Latin America LED Drivers and Power Supplies for Horticulture Market Outlook, by Cultivation Facility, Value (US$ Billion), 2026–2033
- Greenhouses
- Vertical and Container Farms
- Indoor Grow Rooms
- Research and Plant Science Facilities
- Latin America LED Drivers and Power Supplies for Horticulture Market Outlook, by Country, Value (US$ Billion), 2026–2033
- Mexico LED Drivers and Power Supplies for Horticulture Market Outlook, by Driver Type, 2026–2033
- Mexico LED Drivers and Power Supplies for Horticulture Market Outlook, by Power Rating, 2026–2033
- Mexico LED Drivers and Power Supplies for Horticulture Market Outlook, by Control Interface, 2026–2033
- Mexico LED Drivers and Power Supplies for Horticulture Market Outlook, by Cultivation Facility, 2026–2033
- Colombia LED Drivers and Power Supplies for Horticulture Market Outlook, by Driver Type, 2026–2033
- Colombia LED Drivers and Power Supplies for Horticulture Market Outlook, by Power Rating, 2026–2033
- Colombia LED Drivers and Power Supplies for Horticulture Market Outlook, by Control Interface, 2026–2033
- Colombia LED Drivers and Power Supplies for Horticulture Market Outlook, by Cultivation Facility, 2026–2033
- Brazil LED Drivers and Power Supplies for Horticulture Market Outlook, by Driver Type, 2026–2033
- Brazil LED Drivers and Power Supplies for Horticulture Market Outlook, by Power Rating, 2026–2033
- Brazil LED Drivers and Power Supplies for Horticulture Market Outlook, by Control Interface, 2026–2033
- Brazil LED Drivers and Power Supplies for Horticulture Market Outlook, by Cultivation Facility, 2026–2033
- Chile LED Drivers and Power Supplies for Horticulture Market Outlook, by Driver Type, 2026–2033
- Chile LED Drivers and Power Supplies for Horticulture Market Outlook, by Power Rating, 2026–2033
- Chile LED Drivers and Power Supplies for Horticulture Market Outlook, by Control Interface, 2026–2033
- Chile LED Drivers and Power Supplies for Horticulture Market Outlook, by Cultivation Facility, 2026–2033
- Peru LED Drivers and Power Supplies for Horticulture Market Outlook, by Driver Type, 2026–2033
- Peru LED Drivers and Power Supplies for Horticulture Market Outlook, by Power Rating, 2026–2033
- Peru LED Drivers and Power Supplies for Horticulture Market Outlook, by Control Interface, 2026–2033
- Peru LED Drivers and Power Supplies for Horticulture Market Outlook, by Cultivation Facility, 2026–2033
- Latin America LED Drivers and Power Supplies for Horticulture Market Outlook, by Driver Type, Value (US$ Billion), 2026–2033
- Middle East & Africa LED Drivers and Power Supplies for Horticulture Market Outlook, 2026–2033
- Middle East & Africa LED Drivers and Power Supplies for Horticulture Market Outlook, by Driver Type, Value (US$ Billion), 2026–2033
- Constant-Current Drivers
- Constant-Voltage Drivers
- Programmable Drivers
- AC-Direct Drivers
- Middle East & Africa LED Drivers and Power Supplies for Horticulture Market Outlook, by Power Rating, Value (US$ Billion), 2026–2033
- Up to 150 W
- 151–400 W
- 401–800 W
- Above 800 W
- Middle East & Africa LED Drivers and Power Supplies for Horticulture Market Outlook, by Control Interface, Value (US$ Billion), 2026–2033
- 0–10 V Analog
- Pulse-Width Modulation
- Addressable Digital
- Wireless and Smart
- Middle East & Africa LED Drivers and Power Supplies for Horticulture Market Outlook, by Cultivation Facility, Value (US$ Billion), 2026–2033
- Greenhouses
- Vertical and Container Farms
- Indoor Grow Rooms
- Research and Plant Science Facilities
- Middle East & Africa LED Drivers and Power Supplies for Horticulture Market Outlook, by Country and Subregion, Value (US$ Billion), 2026–2033
- United Arab Emirates LED Drivers and Power Supplies for Horticulture Market Outlook, by Driver Type, 2026–2033
- United Arab Emirates LED Drivers and Power Supplies for Horticulture Market Outlook, by Power Rating, 2026–2033
- United Arab Emirates LED Drivers and Power Supplies for Horticulture Market Outlook, by Control Interface, 2026–2033
- United Arab Emirates LED Drivers and Power Supplies for Horticulture Market Outlook, by Cultivation Facility, 2026–2033
- Saudi Arabia LED Drivers and Power Supplies for Horticulture Market Outlook, by Driver Type, 2026–2033
- Saudi Arabia LED Drivers and Power Supplies for Horticulture Market Outlook, by Power Rating, 2026–2033
- Saudi Arabia LED Drivers and Power Supplies for Horticulture Market Outlook, by Control Interface, 2026–2033
- Saudi Arabia LED Drivers and Power Supplies for Horticulture Market Outlook, by Cultivation Facility, 2026–2033
- Qatar LED Drivers and Power Supplies for Horticulture Market Outlook, by Driver Type, 2026–2033
- Qatar LED Drivers and Power Supplies for Horticulture Market Outlook, by Power Rating, 2026–2033
- Qatar LED Drivers and Power Supplies for Horticulture Market Outlook, by Control Interface, 2026–2033
- Qatar LED Drivers and Power Supplies for Horticulture Market Outlook, by Cultivation Facility, 2026–2033
- Israel LED Drivers and Power Supplies for Horticulture Market Outlook, by Driver Type, 2026–2033
- Israel LED Drivers and Power Supplies for Horticulture Market Outlook, by Power Rating, 2026–2033
- Israel LED Drivers and Power Supplies for Horticulture Market Outlook, by Control Interface, 2026–2033
- Israel LED Drivers and Power Supplies for Horticulture Market Outlook, by Cultivation Facility, 2026–2033
- South Africa LED Drivers and Power Supplies for Horticulture Market Outlook, by Driver Type, 2026–2033
- South Africa LED Drivers and Power Supplies for Horticulture Market Outlook, by Power Rating, 2026–2033
- South Africa LED Drivers and Power Supplies for Horticulture Market Outlook, by Control Interface, 2026–2033
- South Africa LED Drivers and Power Supplies for Horticulture Market Outlook, by Cultivation Facility, 2026–2033
- Kenya LED Drivers and Power Supplies for Horticulture Market Outlook, by Driver Type, 2026–2033
- Kenya LED Drivers and Power Supplies for Horticulture Market Outlook, by Power Rating, 2026–2033
- Kenya LED Drivers and Power Supplies for Horticulture Market Outlook, by Control Interface, 2026–2033
- Kenya LED Drivers and Power Supplies for Horticulture Market Outlook, by Cultivation Facility, 2026–2033
- Morocco LED Drivers and Power Supplies for Horticulture Market Outlook, by Driver Type, 2026–2033
- Morocco LED Drivers and Power Supplies for Horticulture Market Outlook, by Power Rating, 2026–2033
- Morocco LED Drivers and Power Supplies for Horticulture Market Outlook, by Control Interface, 2026–2033
- Morocco LED Drivers and Power Supplies for Horticulture Market Outlook, by Cultivation Facility, 2026–2033
- Gulf LED Drivers and Power Supplies for Horticulture Market Outlook, by Driver Type, 2026–2033
- Gulf LED Drivers and Power Supplies for Horticulture Market Outlook, by Power Rating, 2026–2033
- Gulf LED Drivers and Power Supplies for Horticulture Market Outlook, by Control Interface, 2026–2033
- Gulf LED Drivers and Power Supplies for Horticulture Market Outlook, by Cultivation Facility, 2026–2033
- Middle East & Africa LED Drivers and Power Supplies for Horticulture Market Outlook, by Driver Type, Value (US$ Billion), 2026–2033
- Competitive Landscape
- Industry Leaders
- Company Profiles
- MEAN WELL Enterprises Co., Ltd.
- Inventronics, Inc.
- Signify N.V.
- Tridonic GmbH & Co KG
- Delta Electronics, Inc.
- eldoLED, part of Acuity Brands, Inc.
- Fulham Co., Inc.
- MOONS' Industries Co., Ltd.
- LIFUD Technology Co., Ltd.
- Sosen Electronics Co., Ltd.
- Done Power Technology Co., Ltd.
- Magtech Industries Corporation
- Phihong Technology Co., Ltd.
- TDK-Lambda Corporation
- Appendix
- Research Methodology
- Report Assumptions
- Acronyms and Abbreviations
Driver Type
- Constant-Current Drivers
- Constant-Voltage Drivers
- Programmable Drivers
- AC-Direct Drivers
Power Rating
- Up to 150 W
- 151–400 W
- 401–800 W
- Above 800 W
Control Interface
- 0–10 V Analog
- Pulse-Width Modulation
- Addressable Digital
- Wireless and Smart
Cultivation Facility
- Greenhouses
- Vertical and Container Farms
- Indoor Grow Rooms
- Research and Plant Science Facilities
Region
- North America
- Europe
- Asia Pacific
- Latin America
- Middle East & Africa
Our Research Methodology
Considering the volatility of business today, traditional approaches to strategizing a game plan can be unfruitful if not detrimental. True ambiguity is no way to determine a forecast. A myriad of predetermined factors must be accounted for such as the degree of risk involved, the magnitude of circumstances, as well as conditions or consequences that are not known or unpredictable. To circumvent binary views that cast uncertainty, the application of market research intelligence to strategically posture, move, and enable actionable outcomes is necessary.
View Methodology
Quality Assured
Rigorous Validation Process

Confidentiality Assured
End-to-end Data Security

Custom Research Services
Tailored To Your Objectives
FAQs
The market is valued at US$ 1.15 billion in 2026 and is projected to reach US$ 2.51 billion by 2033.
The market is expected to grow at an 11.8% CAGR between 2026 and 2033, supported by higher fixture wattage and replacement demand.
Constant-current drivers lead with 54.6% share in 2026, while programmable drivers grow fastest at a 14.2% CAGR through 2033.
North America leads with 34.5% share in 2026, while Asia Pacific grows fastest at a 14.3% CAGR through 2033.
The market is moderately concentrated, with specialist driver makers and lighting groups competing on efficiency, sealing, dimming capability and field reliability.
Related Reports
Inkjet Printers Market Size, Share, Insights, Competitive Landscape, and Forecast 2026 to 2033
The global inkjet printers market is valued at US$50.4 billion in 2026, reaching US$58.8 billion by 2033, growing at a 2.2% CAGR
LED Lighting Market Size, Share, Insights, Competitive Landscape, and Forecast 2026 to 2033
The LED lighting market is projected to grow from US$84.0 billion in 2026 to US$112.0 billion by 2033 at a 4.2% CAGR. Explore segments and trends.
LTE Advanced Pro Market Size, Share, Insights, Competitive Landscape, and Forecast 2026 to 2033
The LTE Advanced Pro market is forecast to grow from US$ 22.30 billion in 2026 to US$ 42.91 billion by 2033 at a 9.8% CAGR.
Advanced Semiconductor Cooling Systems Market Size, Share, Insights, Competitive Landscape, and Forecast 2026 to 2033
The advanced semiconductor cooling systems market is projected to grow from US$ 6.8 billion in 2026 to US$ 24.9 billion by 2033 at a 20.4% CAGR.
Plastic Transistors Market Size, Share, Insights, Competitive Landscape, and Forecast 2026 to 2033
The global plastic transistors market is valued at US$0.4 billion in 2026, reaching US$0.9 billion by 2033, growing at a 12.3% CAGR
Multi-Access Edge Computing Market Size, Share, Insights, Competitive Landscape, and Forecast 2026 to 2033
Explore the multi-access edge computing market, valued at US$ 4.2 billion in 2026 and projected to reach US$ 9.8 billion by 2033 at a 12.9% CAGR.