



Multi-Access Edge Computing Market
Multi-Access Edge Computing Market Size, Share, Insights, Competitive Landscape, and Forecast 2026 to 2033
Multi-Access Edge Computing Market Size, Share, Insights, Competitive Landscape, and Forecast 2026 to 2033
How Big Is the Multi-Access Edge Computing Market?
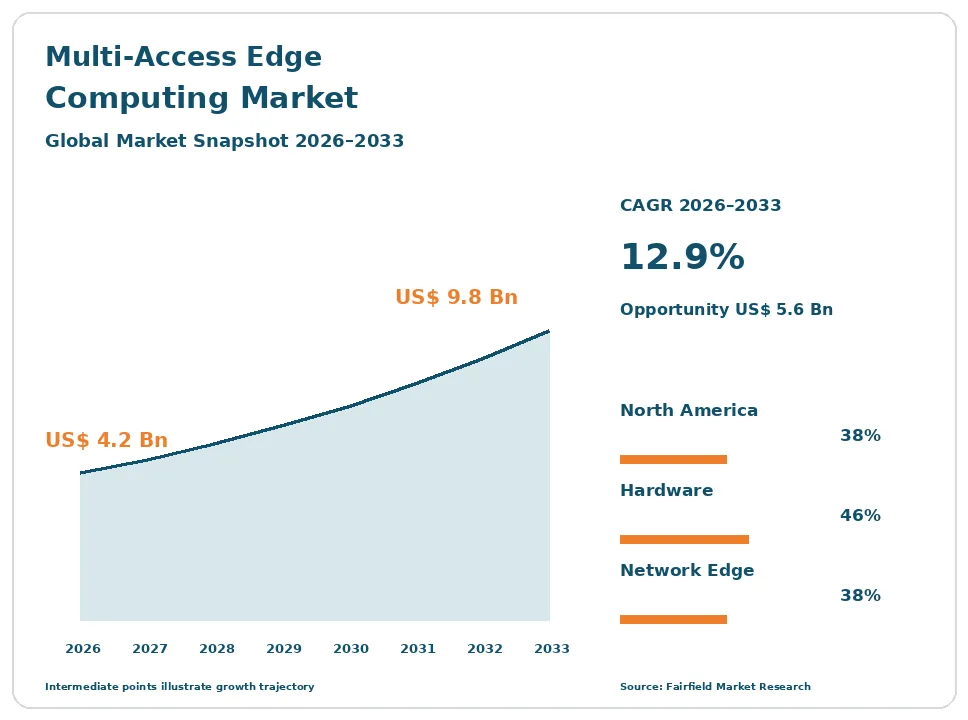
The global multi-access edge computing market size is expected to be valued at US$ 4.2 billion in 2026 and projected to reach US$ 9.8 billion by 2033, growing at a CAGR of 12.9% between 2026 and 2033.
Spending grew at roughly 16.4% a year between 2020 and 2025, from a very small base of trials and proofs of concept. Three demands now carry the market. Factory and port operators need deterministic control close to machines. Video analytics workloads move to local sites when backhaul cost outweighs compute cost. Data residency rules force some processing to stay inside a jurisdiction. Outside those cases, most applications once promised to the edge run acceptably from regional cloud regions. The market remains early and contested, building slowly around a narrow set of defensible workloads rather than a general migration of computing into the access network.
Key Report Takeaways
- By Component: Hardware held 46% share in 2026, while MEC platform software is projected to expand at a 14.9% CAGR through 2033, as operators and integrators replace bespoke stacks with orchestration products aligned to ETSI interfaces.
- By Deployment Location: Network edge sites held 38% share in 2026, while private network edge is projected to grow at a 15.8% CAGR through 2033, because enterprises prefer compute they own on premises.
- By Access Technology: 5G non-standalone access held 41% share in 2026, while 5G standalone is projected to advance at a 17.1% CAGR through 2033 as core upgrades unlock user plane function placement and slicing.
- By End Use Industry: Manufacturing and industrial automation held 27% share in 2026, while logistics and ports are projected to rise at a 15.6% CAGR through 2033, driven by automated cranes and yard vehicles.
- By Geography: North America held 38% share in 2026, while Asia Pacific is projected to expand at a 15.4% CAGR through 2033, supported by dense industrial clusters and local spectrum licensing.
Global Multi-Access Edge Computing Market Trends and Insights
Drivers Impact Analysis
| Driver | Impact on CAGR Forecast | Geographic Relevance | Impact Timeline |
| Real-time control in factories, ports and yards | High | Asia Pacific, Europe, North America | Medium term 2–4 years |
| Data residency and sovereignty obligations | Medium | Europe, Middle East & Africa | Long term ≥4 years |
Two demand sources account for most verified edge deployment activity today.
Real-Time Control in Factories and Ports Anchors Verified Edge Computing Demand
Industrial control is the clearest paying workload in multi-access edge computing. Automated cranes, guided vehicles, machine vision cells and yard management systems need response times that a distant cloud region cannot guarantee. Operators of container terminals, assembly plants and mining sites buy local compute because a missed control loop stops equipment. These buyers purchase servers, accelerators and hardened enclosures together with integration work, which makes the revenue tangible rather than speculative.
The mechanism is physical distance and jurisdiction over the network path. Placing a user plane function at the site keeps traffic local, so round-trip time stops depending on transport links the plant does not control. 3GPP edge application enablement work and network slicing architecture give this a standard shape, and ETSI interfaces let one platform serve several applications. Each new automated cell adds compute at the same location.
Data Residency Obligations Push Regulated Workloads Into Local Edge Sites
Data residency and sovereignty rules create demand that cannot be met from a distant region. Public bodies, hospitals, defence suppliers and regulated manufacturers in Europe and parts of the Middle East & Africa must keep certain processing inside national borders. When the nearest compliant cloud region sits outside the jurisdiction, local edge infrastructure becomes the practical answer, and operators with in-country facilities hold a structural advantage over distant providers.
The cause is policy rather than technology. The European Union data protection framework constrains international transfers, and the bloc’s cloud and edge policy direction favours infrastructure under domestic control. Several national governments apply stricter rules to public sector and health data. These obligations convert a latency argument that enterprises often resist into a compliance requirement they cannot avoid, which is why sovereign edge zones attract procurement budgets that general edge propositions do not.
Restraints Impact Analysis
| Restraint | Impact on CAGR Forecast | Geographic Relevance | Impact Timeline |
| No scaled killer application and weak operator monetisation | High | Global | Long term ≥4 years |
| Slow standalone core rollout and enterprise preference for private networks | High | North America, Europe, Asia Pacific | Medium term 2–4 years |
Two structural problems explain why deployment has trailed a decade of forecasts.
Absence of a Scaled Application Keeps Multi-Access Edge Computing Revenue Thin
The promised killer application has not arrived, and that is the single largest brake on this market. Cloud gaming, immersive media and consumer augmented reality were expected to require edge placement at volume; they have not reached the scale that was projected. Most enterprise workloads run acceptably from regional cloud regions a few tens of milliseconds away, so the business case rarely survives procurement review. Demand stays confined to sites where control loops or backhaul economics genuinely bind.
Operator monetisation has disappointed for the same reason. The platform-and-marketplace model, in which a carrier sells developers access to edge capacity, has produced little revenue because few developers need it. Much practical deployment has become hyperscaler infrastructure placed inside operator facilities, which pays rent and backhaul rather than building an operator-owned business. Platform licensing revenue has stayed well below early expectations.
Slow Standalone Core Rollout and Private Network Preference Limit Operator Edge
The full capability depends on a standalone 5G core, and standalone deployment has been slower than planned in many markets. Without it, user plane function placement, local breakout and network slicing are unavailable or partial, so operators cannot sell the differentiated service that justifies edge investment. Carriers facing flat service revenue have deferred core upgrades, which pushes edge revenue further out and leaves installed platforms underused.
Enterprise buying behaviour compounds the delay. Many industrial and logistics customers prefer a private network with on-premises compute they own, licensed under local or shared spectrum, because it gives them control of uptime, data and change management. That choice routes around the operator entirely, converting what was modelled as carrier platform revenue into equipment and integration spending captured by vendors and system integrators. Operators then compete for a smaller pool than their original plans assumed.
Market Opportunities
Two revenue pools remain genuinely open rather than merely forecast.
Private Network Edge on Enterprise Premises Opens the Most Addressable Pool
Private network edge is the largest practical revenue pool in this market because it matches what enterprises already want to buy. Manufacturers, ports, mines, airports and hospitals are commissioning local networks with compute attached, and each site needs servers, accelerators, platform software, radio equipment and integration. This spending is site-by-site and repeatable, which suits equipment vendors and integrators better than a platform model dependent on developer adoption.
Spectrum policy is what makes it possible. Several administrations now license local-area or shared spectrum directly to enterprises, so a factory can run its own network without a carrier contract. System integrators, industrial automation suppliers and network equipment vendors are the natural capturers, with operators participating as managed service providers where customers want support rather than ownership. Energy efficiency reporting obligations on data infrastructure add a further reason to size compute precisely at each site.
Integration and Managed Services Become the Dependable Edge Revenue Pool
Services are where edge spending reliably converts into margin, and that pool is expanding faster than platform licensing. Customers buying local compute need site surveys, power and cooling design, application porting, security hardening, lifecycle management and day-two operations. Few industrial or logistics buyers have these skills in house, so they purchase them, and the contracts recur annually rather than ending at installation.
The demand comes from the same industrial, port and retail customers driving hardware purchases, plus regulated organisations that need documented compliance for locally processed data. Telecom equipment vendors, cloud providers, specialist integrators and operator professional services arms all compete here. The GSMA Operator Platform initiative and the CAMARA federated network API work support the pool indirectly, by giving integrators a common way to expose network capability across several carriers instead of building bespoke connections.
Segment Analysis
By Component: Hardware Leads While Platform Software Builds Momentum
Hardware held 46% of multi-access edge computing revenue in 2026 because every deployment starts with physical kit. Edge servers, inference accelerators, switching and hardened enclosures must be installed at cell sites, aggregation points, central offices and plant rooms before any software earns money, and industrial sites demand ruggedised equipment that carries a price premium. Services follow closely, since few buyers integrate these systems alone.
MEC platform software is the fastest-growing component at a 14.9% CAGR through 2033. Operators and integrators are replacing bespoke stacks with orchestration and lifecycle management products that follow ETSI interfaces, which cuts the cost of adding each new application. Service exposure functions that let applications request network behaviour sit in this layer. For vendors, the implication is that hardware volume still sets revenue scale, while software decides how cheaply the next site can be added.
By Deployment Location: Network Edge Holds Share as Private Premises Edge Accelerates
Network edge sites held 38% share in 2026, the largest of the four locations. Aggregation points and central offices already have power, cooling, floor space and transport capacity, so operators can place compute there without new construction. The economics are better than at far edge cell sites, where space is tight and power is limited, and the latency achieved is sufficient for most workloads that need anything better than regional cloud.
Private network edge on enterprise premises is growing fastest at a 15.8% CAGR. Factories, ports and campuses deploy compute inside their own buildings alongside a private radio network, keeping both data and uptime under their control. Operator edge zones hosting hyperscaler infrastructure continue to expand, though largely as colocation. The commercial consequence is that value is migrating toward enterprise sites and away from carrier-owned platform positions.
By Access Technology: 5G Non-Standalone Dominates While Standalone Grows Quickest
5G non-standalone access accounted for 41% of connected edge deployments in 2026 because it is what most networks actually run. Non-standalone reuses the existing core, so operators could launch coverage quickly, and installed edge platforms attach to it even though the architecture limits local breakout. Legacy 4G connections still support a meaningful share of industrial sites, particularly in logistics and utilities.
5G standalone is the fastest-growing access technology at a 17.1% CAGR through 2033. Only a standalone core allows user plane function placement at the edge, local breakout and the network slicing architecture defined by 3GPP, which together make differentiated edge services sellable. Wired and Wi-Fi local access remains common inside private deployments. For buyers, this means capability depends on core modernisation timing rather than radio coverage, which is why adoption varies sharply between operators in the same country.
By End Use Industry: Manufacturing Leads While Logistics and Ports Expand Fastest
Manufacturing and industrial automation held 27% share in 2026, the largest end use. Machine vision inspection, robotic cell coordination and process control need bounded response times and generate video and sensor data that is expensive to backhaul. Plants also have the capital budgets and engineering staff to run local infrastructure, which makes them the most reliable buyers of edge computing systems.
Logistics and ports form the fastest-growing end use at a 15.6% CAGR through 2033. Container terminals automating cranes, straddle carriers and gate systems need local control across large outdoor sites where public network performance varies. Retail, media delivery, gaming, connected vehicles, healthcare and public safety each contribute smaller volumes, with healthcare demand shaped more by data residency rules than by latency. The practical implication is that edge revenue concentrates in asset-heavy operations rather than consumer applications.
Geography Analysis
Which Region Is Leading the Multi-Access Edge Computing Market?
North America leads the multi-access edge computing market with 38% share in 2026. The United States supplies most of that revenue, through cloud provider edge zones placed in carrier facilities, private networks at industrial and defence sites, and a large base of automated warehouses. Canada adds utility and resource sector deployments. Three causes explain the position: early standalone core activity at the largest carriers, shared spectrum rules that let enterprises license local-area access directly, and concentrated availability of integration skills. The main barrier is commercial rather than technical, since operators have struggled to convert hosting arrangements into platform revenue of their own. The clearest change ahead is the shift of spending toward enterprise-owned private infrastructure, which moves value from carriers to equipment vendors and integrators.
Europe Builds Edge Capacity Around Sovereignty Rules and Industrial Automation
Europe holds 26% share in 2026, with Germany, France, the United Kingdom, Italy and the Netherlands contributing most deployments. Demand follows two paths. Industrial automation in automotive, chemicals and machinery plants drives local compute at factory sites, supported by national spectrum schemes that grant campus licences directly to manufacturers. Data residency and sovereignty policy drives a second stream, pushing public sector and health workloads into in-country facilities. The European Union cloud and edge policy direction and energy efficiency reporting obligations on data infrastructure both shape procurement. The constraint is fragmentation, since each country licenses spectrum differently and standalone core progress varies widely. Federated network API work gives vendors a route to serve multinational customers across several carriers without bespoke integration in every market.
Which Region Is Growing Fastest in the Multi-Access Edge Computing Market?
Asia Pacific is growing fastest in the multi-access edge computing market, at a 15.4% CAGR through 2033 from 25% share in 2026. China, Japan, South Korea, India, Singapore and Australia drive the expansion. Dense manufacturing and port clusters create the real-time control workloads that justify local compute, and several administrations license local-area spectrum to enterprises, which lets factories build private networks quickly. Standalone core deployment is further advanced in parts of the region than elsewhere, so operators can offer local breakout and slicing where enterprises want them. Barriers include wide variation in enterprise readiness and price pressure in competitive carrier markets. The clearest opportunity is port and intralogistics automation, where terminal operators are standardising on local control systems across multiple sites.
Latin America Adds Edge Capacity Through Mining, Ports and Retail Networks
Latin America holds 6% share in 2026, with Brazil, Mexico and Chile accounting for most activity. Mining operations, container terminals and large retail chains are the practical buyers, using local compute for equipment monitoring, autonomous haulage support and store analytics where connectivity to distant regions is unreliable. Barriers are substantial. Standalone core rollout is limited, enterprise spectrum licensing is less developed than in other markets, import duties raise hardware cost, and integration skills are scarce outside major cities. Currency volatility also complicates multi-year contracts priced in dollars. The opportunity lies in resource sector automation, where mining companies already fund private networks at remote sites and can extend the same infrastructure to processing plants and logistics corridors without waiting for carrier upgrades.
Middle East & Africa Edge Demand Follows Sovereign Cloud and Port Projects
Middle East & Africa accounts for 5% share in 2026, the smallest of the five regions. Demand concentrates in the United Arab Emirates, Saudi Arabia, Qatar and South Africa, driven by sovereign cloud programmes, port and airport automation, and oil and gas facility monitoring. Government data localisation requirements are the strongest single driver, because they oblige regulated workloads to be processed in-country. Barriers include uneven transport infrastructure across much of the continent, limited standalone core coverage, small local integration markets and power reliability problems that raise the cost of distributed sites. The opportunity is tied to national digital infrastructure programmes, which fund local facilities and give vendors anchor projects that can later host industrial and logistics workloads.
Competitive Landscape
The multi-access edge computing market is moderately concentrated, and concentration differs sharply by layer. Telecom equipment suppliers such as Nokia, Ericsson, Huawei Technologies and ZTE Corporation hold strong positions in the network functions that make edge placement possible, because the same vendors supply the radio and core estate. Server and silicon suppliers including Hewlett Packard Enterprise, Dell Technologies, Intel Corporation and NVIDIA Corporation compete in a more open hardware market. Cloud providers such as Amazon Web Services, Microsoft and Google Cloud have taken a strong position in operator-hosted edge zones, which has shifted bargaining power away from carriers. Integration and services remain fragmented across global and regional firms.
Competition turns on a short list of factors. Buyers weigh conformance to ETSI architecture and 3GPP interfaces, the breadth of the application ecosystem, orchestration maturity across many small sites, power and footprint efficiency, security certification, and the ability to run the same stack on premises and in carrier facilities. New entrants come from two directions: industrial automation suppliers extending controllers into general-purpose compute, and open source platform projects that let integrators assemble stacks without a single vendor licence.
Strategic activity concentrates on fitting edge products into existing enterprise buying patterns rather than creating new carrier businesses. Vendors align their platforms with hyperscaler control planes, package private network bundles with compute included, and contribute to the GSMA Operator Platform and CAMARA federated API work so that capability can be exposed consistently across carriers. Each move matters because it reduces the integration cost that has blocked deployment.
Vendor direction now favours software portability, energy efficient hardware and services attachment over platform marketplace ambitions, which have repeatedly failed to generate the revenue expected of them.
Multi-Access Edge Computing Industry Leaders
- Nokia
- Ericsson
- Hewlett Packard Enterprise
- Amazon Web Services
- Microsoft
Recent Industry Developments
- June 2024: 3GPP completed the protocol freeze of Release 18, the first 5G-Advanced release, which carries edge application enablement and network slicing enhancements that edge deployments depend on.
- August 2024: The European Union Artificial Intelligence Act entered into force, setting obligations for high-risk systems and giving regulated users a further reason to run inference inside controlled local facilities.
- September 2024: The first reporting round under the European Union data centre energy reporting scheme closed, extending efficiency disclosure duties to distributed facilities and shaping edge site design.
- September 2025: The European Union Data Act became applicable, introducing cloud and edge switching and data portability duties that lower the cost of moving workloads between providers.
Companies Covered in the Report
- Nokia
- Ericsson
- Huawei Technologies
- ZTE Corporation
- Cisco Systems
- Hewlett Packard Enterprise
- Dell Technologies
- Intel Corporation
- NVIDIA Corporation
- Amazon Web Services
- Microsoft
- Google Cloud
- Red Hat
Multi-Access Edge Computing Market Report Scope
This study measures compute and storage placed at the network edge and integrated with the access network. It covers far edge and network edge infrastructure, the platform software layer, enabling network functions including user plane function placement and slicing, operator edge zones, private network edge and related services. Enterprise on-premises data centres unconnected to the access network, content delivery networks of the classical kind and device-level embedded computing are excluded. Base year 2025; forecast period 2026–2033, in US$ Billion.
Component
- Hardware
- MEC Platform Software
- Services
Deployment Location
- Far Edge
- Network Edge
- Operator Edge Zones
- Private Network Edge
Access Technology
- 4G LTE
- 5G Non-Standalone
- 5G Standalone
- Wired and Wi-Fi Local Access
End Use Industry
- Manufacturing and Industrial Automation
- Logistics and Ports
- Retail
- Media and Gaming
- Connected and Autonomous Vehicles
- Healthcare
- Public Safety
Regions
- North America
- Europe
- Asia Pacific
- Latin America
- Middle East & Africa
Key Questions Answered in the Report
How large is the multi-access edge computing market in 2026?
The market is valued at US$ 4.2 billion in 2026, a modest base that reflects early deployment concentrated in industrial, port and regulated workloads.
What is the multi-access edge computing market forecast to 2033?
The market is projected to reach US$ 9.8 billion by 2033, growing at a 12.9% CAGR and adding US$ 5.6 billion of absolute opportunity.
Which component leads the multi-access edge computing market?
Hardware leads with 46% share in 2026, because servers, accelerators and hardened enclosures must be installed before platform software or services earn revenue.
Which geography is growing fastest in multi-access edge computing?
Asia Pacific grows fastest at a 15.4% CAGR through 2033, supported by dense manufacturing and port clusters and enterprise spectrum licensing.
How concentrated is the multi-access edge computing market?
Concentration is medium, with network vendors strong in enabling functions, cloud providers strong in operator-hosted zones, and services remaining fragmented.
1. Executive Summary
1.1. Global Multi-Access Edge Computing Market Snapshot
1.2. Future Projections, 2026-2033
1.3. Key Market Trends
1.4. Regional Snapshot
2. Market Overview
2.1. Market Definition and Report Scope
2.2. Historical Market Trends, 2020-2025
2.3. Market Dynamics
2.3.1. Drivers Impact Analysis
2.3.1.1. Real-Time Control in Factories and Ports Anchors Verified Edge Computing Demand
2.3.1.2. Data Residency Obligations Push Regulated Workloads Into Local Edge Sites
2.3.2. Restraints Impact Analysis
2.3.2.1. Absence of a Scaled Application Keeps Multi-Access Edge Computing Revenue Thin
2.3.2.2. Slow Standalone Core Rollout and Private Network Preference Limit Operator Edge
2.3.3. Market Opportunities
2.3.3.1. Private Network Edge on Enterprise Premises Opens the Most Addressable Pool
2.3.3.2. Integration and Managed Services Become the Dependable Edge Revenue Pool
3. Global Multi-Access Edge Computing Market Outlook, 2020-2033
3.1. Global Multi-Access Edge Computing Market Outlook, by Component, Value (US$ Billion), 2020-2033
3.1.1. Hardware
3.1.2. MEC Platform Software
3.1.3. Services
3.2. Global Multi-Access Edge Computing Market Outlook, by Deployment Location, Value (US$ Billion), 2020-2033
3.2.1. Far Edge
3.2.2. Network Edge
3.2.3. Operator Edge Zones
3.2.4. Private Network Edge
3.3. Global Multi-Access Edge Computing Market Outlook, by Access Technology, Value (US$ Billion), 2020-2033
3.3.1. 4G LTE
3.3.2. 5G Non-Standalone
3.3.3. 5G Standalone
3.3.4. Wired and Wi-Fi Local Access
3.4. Global Multi-Access Edge Computing Market Outlook, by End Use Industry, Value (US$ Billion), 2020-2033
3.4.1. Manufacturing and Industrial Automation
3.4.2. Logistics and Ports
3.4.3. Retail
3.4.4. Media and Gaming
3.4.5. Connected and Autonomous Vehicles
3.4.6. Healthcare
3.4.7. Public Safety
3.5. Global Multi-Access Edge Computing Market Outlook, by Region, Value (US$ Billion), 2020-2033
3.5.1. North America
3.5.2. Europe
3.5.3. Asia Pacific
3.5.4. Latin America
3.5.5. Middle East & Africa
4. North America Multi-Access Edge Computing Market Outlook, 2020-2033
4.1. North America Multi-Access Edge Computing Market Outlook, by Component, Value (US$ Billion), 2020-2033
4.1.1. Hardware
4.1.2. MEC Platform Software
4.1.3. Services
4.2. North America Multi-Access Edge Computing Market Outlook, by Deployment Location, Value (US$ Billion), 2020-2033
4.2.1. Far Edge
4.2.2. Network Edge
4.2.3. Operator Edge Zones
4.2.4. Private Network Edge
4.3. North America Multi-Access Edge Computing Market Outlook, by Access Technology, Value (US$ Billion), 2020-2033
4.3.1. 4G LTE
4.3.2. 5G Non-Standalone
4.3.3. 5G Standalone
4.3.4. Wired and Wi-Fi Local Access
4.4. North America Multi-Access Edge Computing Market Outlook, by End Use Industry, Value (US$ Billion), 2020-2033
4.4.1. Manufacturing and Industrial Automation
4.4.2. Logistics and Ports
4.4.3. Retail
4.4.4. Media and Gaming
4.4.5. Connected and Autonomous Vehicles
4.4.6. Healthcare
4.4.7. Public Safety
4.5. North America Multi-Access Edge Computing Market Outlook, by Country, Value (US$ Billion), 2020-2033
4.5.1. United States Multi-Access Edge Computing Market Outlook, by Component, 2020-2033
4.5.2. United States Multi-Access Edge Computing Market Outlook, by Deployment Location, 2020-2033
4.5.3. United States Multi-Access Edge Computing Market Outlook, by Access Technology, 2020-2033
4.5.4. United States Multi-Access Edge Computing Market Outlook, by End Use Industry, 2020-2033
4.5.5. Canada Multi-Access Edge Computing Market Outlook, by Component, 2020-2033
4.5.6. Canada Multi-Access Edge Computing Market Outlook, by Deployment Location, 2020-2033
4.5.7. Canada Multi-Access Edge Computing Market Outlook, by Access Technology, 2020-2033
4.5.8. Canada Multi-Access Edge Computing Market Outlook, by End Use Industry, 2020-2033
5. Europe Multi-Access Edge Computing Market Outlook, 2020-2033
5.1. Europe Multi-Access Edge Computing Market Outlook, by Component, Value (US$ Billion), 2020-2033
5.1.1. Hardware
5.1.2. MEC Platform Software
5.1.3. Services
5.2. Europe Multi-Access Edge Computing Market Outlook, by Deployment Location, Value (US$ Billion), 2020-2033
5.2.1. Far Edge
5.2.2. Network Edge
5.2.3. Operator Edge Zones
5.2.4. Private Network Edge
5.3. Europe Multi-Access Edge Computing Market Outlook, by Access Technology, Value (US$ Billion), 2020-2033
5.3.1. 4G LTE
5.3.2. 5G Non-Standalone
5.3.3. 5G Standalone
5.3.4. Wired and Wi-Fi Local Access
5.4. Europe Multi-Access Edge Computing Market Outlook, by End Use Industry, Value (US$ Billion), 2020-2033
5.4.1. Manufacturing and Industrial Automation
5.4.2. Logistics and Ports
5.4.3. Retail
5.4.4. Media and Gaming
5.4.5. Connected and Autonomous Vehicles
5.4.6. Healthcare
5.4.7. Public Safety
5.5. Europe Multi-Access Edge Computing Market Outlook, by Country, Value (US$ Billion), 2020-2033
5.5.1. Germany Multi-Access Edge Computing Market Outlook, by Component, 2020-2033
5.5.2. Germany Multi-Access Edge Computing Market Outlook, by Deployment Location, 2020-2033
5.5.3. Germany Multi-Access Edge Computing Market Outlook, by Access Technology, 2020-2033
5.5.4. Germany Multi-Access Edge Computing Market Outlook, by End Use Industry, 2020-2033
5.5.5. France Multi-Access Edge Computing Market Outlook, by Component, 2020-2033
5.5.6. France Multi-Access Edge Computing Market Outlook, by Deployment Location, 2020-2033
5.5.7. France Multi-Access Edge Computing Market Outlook, by Access Technology, 2020-2033
5.5.8. France Multi-Access Edge Computing Market Outlook, by End Use Industry, 2020-2033
5.5.9. United Kingdom Multi-Access Edge Computing Market Outlook, by Component, 2020-2033
5.5.10. United Kingdom Multi-Access Edge Computing Market Outlook, by Deployment Location, 2020-2033
5.5.11. United Kingdom Multi-Access Edge Computing Market Outlook, by Access Technology, 2020-2033
5.5.12. United Kingdom Multi-Access Edge Computing Market Outlook, by End Use Industry, 2020-2033
5.5.13. Italy Multi-Access Edge Computing Market Outlook, by Component, 2020-2033
5.5.14. Italy Multi-Access Edge Computing Market Outlook, by Deployment Location, 2020-2033
5.5.15. Italy Multi-Access Edge Computing Market Outlook, by Access Technology, 2020-2033
5.5.16. Italy Multi-Access Edge Computing Market Outlook, by End Use Industry, 2020-2033
5.5.17. Netherlands Multi-Access Edge Computing Market Outlook, by Component, 2020-2033
5.5.18. Netherlands Multi-Access Edge Computing Market Outlook, by Deployment Location, 2020-2033
5.5.19. Netherlands Multi-Access Edge Computing Market Outlook, by Access Technology, 2020-2033
5.5.20. Netherlands Multi-Access Edge Computing Market Outlook, by End Use Industry, 2020-2033
6. Asia Pacific Multi-Access Edge Computing Market Outlook, 2020-2033
6.1. Asia Pacific Multi-Access Edge Computing Market Outlook, by Component, Value (US$ Billion), 2020-2033
6.1.1. Hardware
6.1.2. MEC Platform Software
6.1.3. Services
6.2. Asia Pacific Multi-Access Edge Computing Market Outlook, by Deployment Location, Value (US$ Billion), 2020-2033
6.2.1. Far Edge
6.2.2. Network Edge
6.2.3. Operator Edge Zones
6.2.4. Private Network Edge
6.3. Asia Pacific Multi-Access Edge Computing Market Outlook, by Access Technology, Value (US$ Billion), 2020-2033
6.3.1. 4G LTE
6.3.2. 5G Non-Standalone
6.3.3. 5G Standalone
6.3.4. Wired and Wi-Fi Local Access
6.4. Asia Pacific Multi-Access Edge Computing Market Outlook, by End Use Industry, Value (US$ Billion), 2020-2033
6.4.1. Manufacturing and Industrial Automation
6.4.2. Logistics and Ports
6.4.3. Retail
6.4.4. Media and Gaming
6.4.5. Connected and Autonomous Vehicles
6.4.6. Healthcare
6.4.7. Public Safety
6.5. Asia Pacific Multi-Access Edge Computing Market Outlook, by Country, Value (US$ Billion), 2020-2033
6.5.1. China Multi-Access Edge Computing Market Outlook, by Component, 2020-2033
6.5.2. China Multi-Access Edge Computing Market Outlook, by Deployment Location, 2020-2033
6.5.3. China Multi-Access Edge Computing Market Outlook, by Access Technology, 2020-2033
6.5.4. China Multi-Access Edge Computing Market Outlook, by End Use Industry, 2020-2033
6.5.5. Japan Multi-Access Edge Computing Market Outlook, by Component, 2020-2033
6.5.6. Japan Multi-Access Edge Computing Market Outlook, by Deployment Location, 2020-2033
6.5.7. Japan Multi-Access Edge Computing Market Outlook, by Access Technology, 2020-2033
6.5.8. Japan Multi-Access Edge Computing Market Outlook, by End Use Industry, 2020-2033
6.5.9. South Korea Multi-Access Edge Computing Market Outlook, by Component, 2020-2033
6.5.10. South Korea Multi-Access Edge Computing Market Outlook, by Deployment Location, 2020-2033
6.5.11. South Korea Multi-Access Edge Computing Market Outlook, by Access Technology, 2020-2033
6.5.12. South Korea Multi-Access Edge Computing Market Outlook, by End Use Industry, 2020-2033
6.5.13. India Multi-Access Edge Computing Market Outlook, by Component, 2020-2033
6.5.14. India Multi-Access Edge Computing Market Outlook, by Deployment Location, 2020-2033
6.5.15. India Multi-Access Edge Computing Market Outlook, by Access Technology, 2020-2033
6.5.16. India Multi-Access Edge Computing Market Outlook, by End Use Industry, 2020-2033
6.5.17. Singapore Multi-Access Edge Computing Market Outlook, by Component, 2020-2033
6.5.18. Singapore Multi-Access Edge Computing Market Outlook, by Deployment Location, 2020-2033
6.5.19. Singapore Multi-Access Edge Computing Market Outlook, by Access Technology, 2020-2033
6.5.20. Singapore Multi-Access Edge Computing Market Outlook, by End Use Industry, 2020-2033
6.5.21. Australia Multi-Access Edge Computing Market Outlook, by Component, 2020-2033
6.5.22. Australia Multi-Access Edge Computing Market Outlook, by Deployment Location, 2020-2033
6.5.23. Australia Multi-Access Edge Computing Market Outlook, by Access Technology, 2020-2033
6.5.24. Australia Multi-Access Edge Computing Market Outlook, by End Use Industry, 2020-2033
7. Latin America Multi-Access Edge Computing Market Outlook, 2020-2033
7.1. Latin America Multi-Access Edge Computing Market Outlook, by Component, Value (US$ Billion), 2020-2033
7.1.1. Hardware
7.1.2. MEC Platform Software
7.1.3. Services
7.2. Latin America Multi-Access Edge Computing Market Outlook, by Deployment Location, Value (US$ Billion), 2020-2033
7.2.1. Far Edge
7.2.2. Network Edge
7.2.3. Operator Edge Zones
7.2.4. Private Network Edge
7.3. Latin America Multi-Access Edge Computing Market Outlook, by Access Technology, Value (US$ Billion), 2020-2033
7.3.1. 4G LTE
7.3.2. 5G Non-Standalone
7.3.3. 5G Standalone
7.3.4. Wired and Wi-Fi Local Access
7.4. Latin America Multi-Access Edge Computing Market Outlook, by End Use Industry, Value (US$ Billion), 2020-2033
7.4.1. Manufacturing and Industrial Automation
7.4.2. Logistics and Ports
7.4.3. Retail
7.4.4. Media and Gaming
7.4.5. Connected and Autonomous Vehicles
7.4.6. Healthcare
7.4.7. Public Safety
7.5. Latin America Multi-Access Edge Computing Market Outlook, by Country, Value (US$ Billion), 2020-2033
7.5.1. Brazil Multi-Access Edge Computing Market Outlook, by Component, 2020-2033
7.5.2. Brazil Multi-Access Edge Computing Market Outlook, by Deployment Location, 2020-2033
7.5.3. Brazil Multi-Access Edge Computing Market Outlook, by Access Technology, 2020-2033
7.5.4. Brazil Multi-Access Edge Computing Market Outlook, by End Use Industry, 2020-2033
7.5.5. Mexico Multi-Access Edge Computing Market Outlook, by Component, 2020-2033
7.5.6. Mexico Multi-Access Edge Computing Market Outlook, by Deployment Location, 2020-2033
7.5.7. Mexico Multi-Access Edge Computing Market Outlook, by Access Technology, 2020-2033
7.5.8. Mexico Multi-Access Edge Computing Market Outlook, by End Use Industry, 2020-2033
7.5.9. Chile Multi-Access Edge Computing Market Outlook, by Component, 2020-2033
7.5.10. Chile Multi-Access Edge Computing Market Outlook, by Deployment Location, 2020-2033
7.5.11. Chile Multi-Access Edge Computing Market Outlook, by Access Technology, 2020-2033
7.5.12. Chile Multi-Access Edge Computing Market Outlook, by End Use Industry, 2020-2033
8. Middle East & Africa Multi-Access Edge Computing Market Outlook, 2020-2033
8.1. Middle East & Africa Multi-Access Edge Computing Market Outlook, by Component, Value (US$ Billion), 2020-2033
8.1.1. Hardware
8.1.2. MEC Platform Software
8.1.3. Services
8.2. Middle East & Africa Multi-Access Edge Computing Market Outlook, by Deployment Location, Value (US$ Billion), 2020-2033
8.2.1. Far Edge
8.2.2. Network Edge
8.2.3. Operator Edge Zones
8.2.4. Private Network Edge
8.3. Middle East & Africa Multi-Access Edge Computing Market Outlook, by Access Technology, Value (US$ Billion), 2020-2033
8.3.1. 4G LTE
8.3.2. 5G Non-Standalone
8.3.3. 5G Standalone
8.3.4. Wired and Wi-Fi Local Access
8.4. Middle East & Africa Multi-Access Edge Computing Market Outlook, by End Use Industry, Value (US$ Billion), 2020-2033
8.4.1. Manufacturing and Industrial Automation
8.4.2. Logistics and Ports
8.4.3. Retail
8.4.4. Media and Gaming
8.4.5. Connected and Autonomous Vehicles
8.4.6. Healthcare
8.4.7. Public Safety
8.5. Middle East & Africa Multi-Access Edge Computing Market Outlook, by Country, Value (US$ Billion), 2020-2033
8.5.1. United Arab Emirates Multi-Access Edge Computing Market Outlook, by Component, 2020-2033
8.5.2. United Arab Emirates Multi-Access Edge Computing Market Outlook, by Deployment Location, 2020-2033
8.5.3. United Arab Emirates Multi-Access Edge Computing Market Outlook, by Access Technology, 2020-2033
8.5.4. United Arab Emirates Multi-Access Edge Computing Market Outlook, by End Use Industry, 2020-2033
8.5.5. Saudi Arabia Multi-Access Edge Computing Market Outlook, by Component, 2020-2033
8.5.6. Saudi Arabia Multi-Access Edge Computing Market Outlook, by Deployment Location, 2020-2033
8.5.7. Saudi Arabia Multi-Access Edge Computing Market Outlook, by Access Technology, 2020-2033
8.5.8. Saudi Arabia Multi-Access Edge Computing Market Outlook, by End Use Industry, 2020-2033
8.5.9. Qatar Multi-Access Edge Computing Market Outlook, by Component, 2020-2033
8.5.10. Qatar Multi-Access Edge Computing Market Outlook, by Deployment Location, 2020-2033
8.5.11. Qatar Multi-Access Edge Computing Market Outlook, by Access Technology, 2020-2033
8.5.12. Qatar Multi-Access Edge Computing Market Outlook, by End Use Industry, 2020-2033
8.5.13. South Africa Multi-Access Edge Computing Market Outlook, by Component, 2020-2033
8.5.14. South Africa Multi-Access Edge Computing Market Outlook, by Deployment Location, 2020-2033
8.5.15. South Africa Multi-Access Edge Computing Market Outlook, by Access Technology, 2020-2033
8.5.16. South Africa Multi-Access Edge Computing Market Outlook, by End Use Industry, 2020-2033
9. Competitive Landscape
9.1. Market Concentration and Industry Leaders
9.2. Competitive Differentiation
9.3. Strategic Initiatives
9.4. Recent Industry Developments
9.5. Company Profiles
9.5.1. Nokia
9.5.2. Ericsson
9.5.3. Huawei Technologies
9.5.4. ZTE Corporation
9.5.5. Cisco Systems
9.5.6. Hewlett Packard Enterprise
9.5.7. Dell Technologies
9.5.8. Intel Corporation
9.5.9. NVIDIA Corporation
9.5.10. Amazon Web Services
9.5.11. Microsoft
9.5.12. Google Cloud
9.5.13. Red Hat
10. Appendix
10.1. Research Methodology
10.2. Report Assumptions
10.3. Acronyms and Abbreviations
| Component | Hardware, MEC Platform Software, Services |
| Deployment Location | Far Edge, Network Edge, Operator Edge Zones, Private Network Edge |
| Access Technology | 4G LTE, 5G Non-Standalone, 5G Standalone, Wired and Wi-Fi Local Access |
| End Use Industry | Manufacturing and Industrial Automation, Logistics and Ports, Retail, Media and Gaming, Connected and Autonomous Vehicles, Healthcare, Public Safety |
| Regions | North America, Europe, Asia Pacific, Latin America, Middle East & Africa |
Our Research Methodology
Considering the volatility of business today, traditional approaches to strategizing a game plan can be unfruitful if not detrimental. True ambiguity is no way to determine a forecast. A myriad of predetermined factors must be accounted for such as the degree of risk involved, the magnitude of circumstances, as well as conditions or consequences that are not known or unpredictable. To circumvent binary views that cast uncertainty, the application of market research intelligence to strategically posture, move, and enable actionable outcomes is necessary.
View Methodology
Quality Assured
Rigorous Validation Process

Confidentiality Assured
End-to-end Data Security

Custom Research Services
Tailored To Your Objectives
FAQs
The market is valued at US$ 4.2 billion in 2026, a modest base that reflects early deployment concentrated in industrial, port and regulated workloads.
The market is projected to reach US$ 9.8 billion by 2033, growing at a 12.9% CAGR and adding US$ 5.6 billion of absolute opportunity.
Hardware leads with 46% share in 2026, because servers, accelerators and hardened enclosures must be installed before platform software or services earn revenue.
Asia Pacific grows fastest at a 15.4% CAGR through 2033, supported by dense manufacturing and port clusters and enterprise spectrum licensing.
Concentration is medium, with network vendors strong in enabling functions, cloud providers strong in operator-hosted zones, and services remaining fragmented.
Related Reports
M-commerce Payment Market Size, Share, Insights, Competitive Landscape, and Forecast 2026 to 2033
Explore the m-commerce payment market, valued at US$ 10.05 billion in 2026 and forecast to reach US$ 22.70 billion by 2033, growing at a 12.3% CAGR.
Irrigation Automation Market Size, Share, Insights, Competitive Landscape, and Forecast 2026 to 2033
Irrigation automation market to grow from US$ 6.2 billion in 2026 to US$ 18.5 billion by 2033 at a 16.9% CAGR. Explore components, end users and regional trends.
Underwater LiDAR Market Size, Share, Insights, Competitive Landscape, and Forecast 2026 to 2033
Explore the underwater LiDAR market, projected to reach US$0.9 billion by 2033 at 12.3% CAGR, with platform, application and regional insights.
Aerial Imaging Market Size, Share, Insights, Competitive Landscape, and Forecast 2026 to 2033
The global aerial imaging market is valued at US$3.83 billion in 2026, reaching US$8.13 billion by 2033, growing at an 11.4% CAGR
Satcom Terminal Market Size, Share, Insights, Competitive Landscape, and Forecast 2026 to 2033
The satcom terminal market is projected to grow from US$8.6 billion in 2026 to US$20.6 billion by 2033, at a 13.3% CAGR. Explore segments and key trends.
Non-Dispersive Infrared Market Size, Share, Insights, Competitive Landscape, and Forecast 2026 to 2033
The non-dispersive infrared market is projected to grow from US$1.6 billion in 2026 to US$2.7 billion by 2033, at a 7.8% CAGR. Explore segments and trends.