



Underwater LiDAR Market
Underwater LiDAR Market Size, Share, Insights, Competitive Landscape, and Forecast 2026 to 2033
Underwater LiDAR Market Size and Trend Analysis
How Large Is the Underwater LiDAR Market Today?
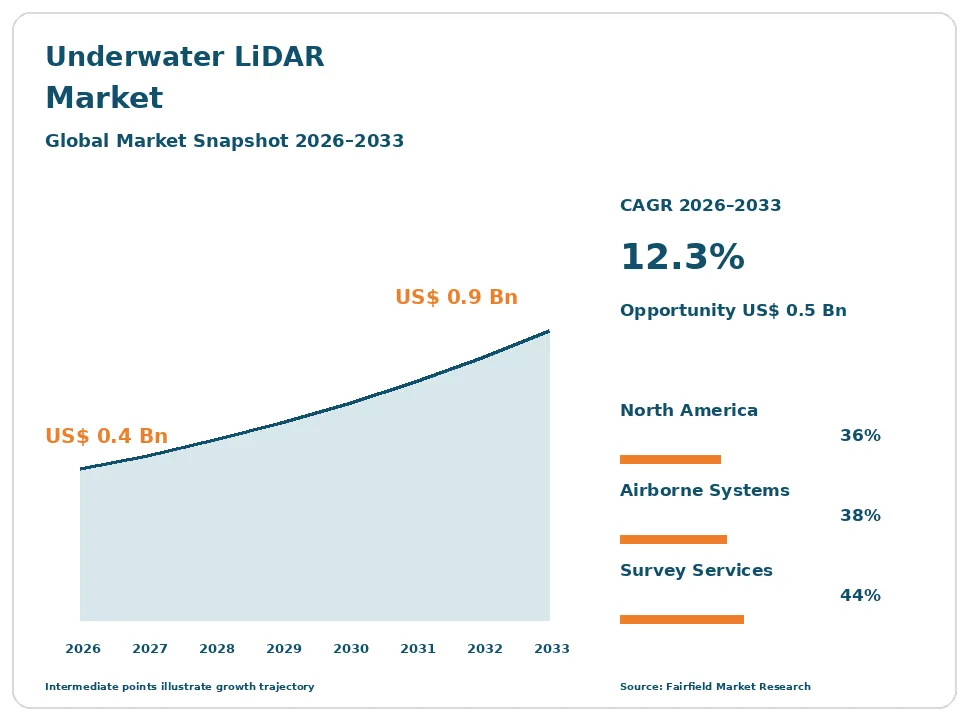
The global Underwater LiDAR market size is expected to be valued at US$ 0.4 billion in 2026 and projected to reach US$ 0.9 billion by 2033, growing at a CAGR of 12.3% between 2026 and 2033.
Between 2020 and 2025 the market expanded at roughly 9% a year, held back by sensor cost and by the small number of survey firms able to fly or deploy these systems. Three forces now lift the outlook. Offshore wind developers need centimetre-scale shallow-water detail that acoustic methods capture poorly in the surf zone. Coastal flood and resilience programmes fund seamless land-to-seabed mapping that only topo-bathymetric sensors deliver in one pass. Uncrewed aircraft and surface vessels are cutting the cost of acquisition sharply. The market stays niche throughout the forecast because clear water is a precondition, not a preference, and most of the world’s survey work still happens in water too turbid for laser ranging.
Key Report Takeaways
- By Platform: Airborne Bathymetric Systems held 38% share in 2026, while Autonomous Underwater Vehicle Mounted sensors are projected to expand at a 17.1% CAGR through 2033, driven by long-endurance inspection missions that remove a crewed support vessel from the cost base.
- By Offering: Survey Services held 44% share in 2026, while Software and Data Processing is projected to expand at a 15.9% CAGR through 2033, supported by automated refraction correction and point-cloud classification that cut skilled processing hours per square kilometre.
- By Application: Hydrographic Charting and Coastal Mapping held 29% share in 2026, while Offshore Wind and Marine Construction Survey is projected to expand at a 17.6% CAGR through 2033, as cable landfall and nearshore route work moves into very shallow water.
- By End User: Government and Hydrographic Agencies held 34% share in 2026, while Defence and Naval Forces are projected to expand at a 16.4% CAGR through 2033, reflecting very shallow water mine countermeasures programmes built around uncrewed platforms.
- By Geography: North America held 36% share in 2026, while Asia Pacific is projected to expand at a 15.2% CAGR through 2033, driven by national seabed mapping budgets and new nearshore wind construction.
Global Underwater LiDAR Market Trends and Insights
Drivers Impact Analysis
| Driver | Impact on CAGR Forecast | Geographic Relevance | Impact Timeline |
| Offshore wind site investigation and cable route survey needing high-resolution nearshore data | High | Europe, Asia Pacific | Medium term 2–4 years |
| Publicly funded coastal resilience and flood mapping requiring seamless land-to-seabed coverage | High | North America, Europe | Long term ≥4 years |
Two demand sources explain why survey buyers pay a premium for laser bathymetry.
Nearshore Wind and Cable Route Survey Rewards Resolution Where Vessels Cannot Work
Offshore wind is the clearest commercial pull on laser bathymetry today. Export cables must cross the surf zone and reach a landfall, and that strip of water is shallow, broken and often unsafe for a survey vessel towing acoustic gear. An aircraft or uncrewed aircraft flying a bathymetric sensor covers the same ground in hours, producing a continuous surface across beach, intertidal zone and nearshore seabed. Developers use that surface for cable burial design, scour assessment and consent evidence.
The mechanism is geometric rather than economic. A vessel-mounted multibeam system needs water under the keel, and its swath narrows as depth falls, so shallow coverage becomes slow and expensive. A laser system works from above and keeps a constant swath regardless of depth. ISO 19901 offshore site investigation practice and marine licensing conditions both require defensible nearshore ground models, which makes the dataset a permitting deliverable rather than a convenience.
Coastal Resilience and Flood Mapping Budgets Fund Seamless Land-to-Seabed Datasets
Public coastal programmes are the steadiest revenue source in this market, and they buy a product no other sensor produces. Flood modelling, dune and marsh restoration, sediment budgeting and shoreline change analysis all need elevation data that crosses the waterline without a join. Topo-bathymetric sensors capture the land surface and the seabed in the same flight, with one coordinate frame and one error budget. Agencies increasingly specify that continuity directly in their scopes of work.
The driver behind the budgets is exposure. Storm surge and sea level rise are forcing coastal authorities to re-baseline their terrain models far more often than the decadal cycle they once used. NOAA hydrographic survey specifications and United States Army Corps of Engineers survey manual requirements define accuracy classes that laser systems can meet in clear shallow water, and International Hydrographic Organization S-44 order categories give overseas agencies the same reference.
Restraints Impact Analysis
| Restraint | Impact on CAGR Forecast | Geographic Relevance | Impact Timeline |
| Light attenuation and suspended sediment limiting usable depth and site availability | High | Global | Long term ≥4 years |
| System price, operator scarcity and weather windows limiting fleet utilisation | Medium | Global | Short term ≤2 years |
Two constraints keep this technology complementary to acoustics rather than competitive with them.
Water Clarity Sets a Physical Ceiling That No Sensor Design Can Remove
Turbidity, not cost, is the binding limit on this market, and it must be stated plainly. Green laser light attenuates rapidly in water and scatters off suspended sediment and organic matter, so return strength collapses as clarity falls. Airborne bathymetric systems typically reach only a few Secchi depths, and subsea scanners work at short standoff distances of a few metres. In estuaries, river mouths, harbours after dredging and most of the deep ocean, the method simply does not produce data.
This is why multibeam and sidescan sonar remain the default for hydrographic work and are excluded from this market. Sound propagates through turbid and deep water with little loss, so acoustics win on range and site availability. Laser systems win on resolution, on coverage above the waterline and on close-range dimensional accuracy. Honest practice treats the two as complementary tools, and most large survey contracts specify both.
Instrument Price, Operator Scarcity and Narrow Weather Windows Cap Fleet Utilisation
Utilisation economics, rather than list price alone, restrain adoption. A full airborne bathymetric payload with its inertial navigation and camera subsystems costs more than a conventional topographic sensor, and the aircraft, pilots and mobilisation add to it. The asset only earns when sea state is low, the water is clear, sun glint is manageable and the survey window is open, which in many regions amounts to a handful of weeks each year. Idle capital is the real cost.
Skilled labour is the second bottleneck. Processing laser bathymetry demands refraction correction, water-column modelling, wave-surface compensation and manual cleaning that few technicians can do well. Training a competent processor takes years, and the pool is small. Airborne acquisition also requires flight permissions, and beyond-visual-line-of-sight authorisation for uncrewed aircraft remains case-by-case in most jurisdictions, which delays the cheaper acquisition model that would otherwise improve utilisation.
Market Opportunities
Two revenue pools sit outside the traditional charting contract.
Subsea Metrology for Spool Piece Measurement Opens a High-Value Inspection Pool
Subsea metrology is the application where laser scanning earns a premium rather than a discount. Measuring the span, heading and relative elevation between two subsea connection points determines how a spool piece is fabricated onshore. An error means the fabricated spool does not fit, and the vessel returns at a cost measured in days of spread rate. Laser scanners deliver millimetre-class relative accuracy at short standoff, which acoustic metrology cannot match, so operators accept a high day rate for the sensor.
The buyers are offshore energy operators and the subsea construction contractors working for them, and the demand is created by tie-back projects, subsea processing equipment and decommissioning surveys. Growth also comes from asset integrity work, where repeat scans quantify corrosion, dent depth and free spans on pipelines. Because the scan supports an engineering decision rather than a chart, buyers value accuracy certificates and repeatability above area coverage rates.
Uncrewed Aircraft and Surface Vessel Platforms Create a Low-Cost Shallow Survey Pool
Miniaturised sensors flown on uncrewed aircraft open a market segment that a crewed survey aircraft can never serve profitably. Small sites, single beaches, reef flats, marina basins, river bars and short cable corridors are too small to justify mobilising an aircraft and crew. A compact bathymetric payload on an uncrewed aircraft or an uncrewed surface vessel turns these into one-day jobs at a fraction of the cost, which converts non-buyers into repeat customers.
The customer groups are port authorities, dredging contractors, coastal municipalities, aquaculture operators and environmental consultancies, all of which need frequent small surveys rather than occasional large ones. Sensor weight reduction and improved receiver sensitivity are what make the configuration viable. The constraint is regulatory: operating rules for uncrewed aircraft, and the beyond-visual-line-of-sight permissions needed to fly long shoreline transects, determine how quickly this pool converts into revenue.
Segment Analysis
By Platform: Airborne Systems Lead Revenue While Autonomous Underwater Vehicles Scale Fastest
Airborne Bathymetric Systems held 38% of revenue in 2026, the largest platform share, because national charting, coastal mapping and nearshore wind work all favour the area coverage that flight provides. Remotely Operated Vehicle Mounted scanners follow at 22%, serving offshore inspection and metrology where a tether supplies power and real-time data. Diver and Pole Mounted units occupy a small but durable niche in archaeology, harbour inspection and shallow structural survey. Autonomous Underwater Vehicle Mounted sensors are the fastest-growing platform at a 17.1% CAGR through 2033, because an autonomous vehicle can run long inspection lines without a support vessel, which removes the single largest cost in subsea survey. Uncrewed Aircraft Mounted payloads grow almost as quickly from a smaller base. For suppliers, the implication is that sensor size, weight and power now matter as much as pulse performance.
By Offering: Survey Services Dominate Spending as Processing Software Grows Quickest
Survey Services accounted for 44% of market value in 2026, the leading offering, because most buyers purchase a deliverable rather than an instrument. Agencies, developers and port authorities contract for a classified point cloud or a charted surface, leaving sensor ownership and crew training to specialist firms. Hardware, covering airborne bathymetric sensors and subsea laser scanners, represents 39% of value and concentrates in a small number of capital purchases each year. Software and Data Processing is the fastest-growing offering at a 15.9% CAGR to 2033, because processing labour is the binding cost in a laser bathymetry project. Automated refraction correction, water-surface modelling, waveform analysis and machine classification each reduce skilled hours per square kilometre. The business implication is that software, not sensors, is where margin expansion is most achievable over the forecast.
By Application: Charting Work Leads While Offshore Wind Survey Expands Most Rapidly
Hydrographic Charting and Coastal Mapping held 29% of revenue in 2026, the largest application, sustained by recurring national survey programmes and by chart update obligations under international standards. Subsea Asset Inspection and Metrology follows, generating high revenue per day from a modest number of deployments. Dredging and Port Maintenance, Pipeline and Cable Route Survey, Marine Habitat Mapping and Defence and Mine Countermeasures divide the remainder. Offshore Wind and Marine Construction Survey is the fastest-growing application at a 17.6% CAGR through 2033, because nearshore cable corridors, landfall sites and intertidal crossings concentrate exactly where acoustic survey is least effective. Each project also requires repeat survey through construction and into operation. For service providers, the practical conclusion is that construction-phase monitoring contracts, not one-off baseline surveys, carry the durable revenue.
By End User: Public Agencies Anchor Demand While Naval Programmes Grow Fastest
Government and Hydrographic Agencies held 34% of spending in 2026, the leading end-user group, because charting, coastal zone management and seabed mapping are public functions funded on multi-year cycles. Survey and Engineering Service Providers follow at 26%, buying sensors to resell capacity. Energy Operators and Developers account for 18% and pay the highest day rates. Research and Academic Institutions remain a small but influential buyer, often validating new sensor designs. Defence and Naval Forces are the fastest-growing end user at a 16.4% CAGR to 2033, driven by very shallow water mine countermeasures, amphibious route survey and rapid environmental assessment, all of which are shifting onto uncrewed platforms that carry compact laser sensors. For vendors, defence procurement brings longer qualification cycles but far better price tolerance than public charting work.
Geography Analysis
Which Region Is Leading the Underwater LiDAR Market?
North America leads with 36% of global revenue in 2026, a position built on sustained public survey funding rather than on manufacturing. The United States accounts for most of it, through NOAA charting programmes, United States Army Corps of Engineers navigation and shoreline work, state coastal resilience projects and a large federal seabed mapping effort covering national waters. Canada adds Arctic charting and inland waterway survey. Three causes sustain the lead. Clear-water conditions in Florida, the Gulf coast, Hawaii and the Caribbean territories make airborne bathymetry genuinely productive. A mature commercial survey sector owns the aircraft and sensors. Defence demand provides a parallel, well-funded buyer. The regional change to watch is uncrewed aircraft authorisation, which would lower acquisition cost for the many small coastal surveys currently priced out.
Europe Converts Offshore Wind Construction Into Repeat Nearshore Survey Demand
Europe held 30% of revenue in 2026, driven less by charting budgets than by construction activity. The United Kingdom, Germany, Denmark, the Netherlands, Belgium, France and Norway all have active offshore wind pipelines, and every project generates landfall, cable corridor and intertidal survey work. Scandinavian and Baltic waters are also comparatively clear in summer, which widens the usable window. Several of the sensor manufacturers and the largest survey contractors are headquartered in the region, so technology development and demand sit close together. Marine spatial planning obligations and habitat directives require seabed characterisation before consent, adding a regulatory layer of demand. The constraint is weather: the survey season is short, and the North Sea is frequently too turbid for laser work, pushing operators toward combined acoustic and laser campaigns.
Which Region Is Growing Fastest in the Underwater LiDAR Market?
Asia Pacific is growing fastest at a 15.2% CAGR between 2026 and 2033, from 22% share in 2026. China, Japan, Australia, South Korea, India and the island states of the Pacific drive the expansion. Three causes are at work. National seabed and coastal mapping programmes are being funded for the first time at scale, often tied to disaster preparedness after typhoon and tsunami damage. Nearshore and fixed-bottom wind construction is moving quickly in China, Japan, South Korea and Taiwan. Tropical water clarity across the Coral Sea, the reefs of Australia and much of the island Pacific suits laser bathymetry better than almost anywhere else. Australia in particular has used airborne bathymetric survey extensively for reef and hydrographic mapping. The open question is domestic sensor supply, since almost all hardware is imported.
Latin America Builds Demand Around Port Access and Reef Mapping
Latin America accounted for 6% of revenue in 2026, a small position concentrated in Brazil, Mexico, Chile, Colombia and the Caribbean states. Demand is led by port and channel maintenance, where accurate shallow survey supports dredging contracts, and by reef and coastal habitat mapping funded through conservation and tourism budgets. Mexico and the Caribbean benefit from exceptionally clear water. Barriers are real. Survey budgets are tight, few regional firms own laser bathymetry capability, and most projects import both aircraft and processing expertise, which raises cost and lengthens schedules. Customs and flight permitting for foreign survey aircraft add further delay. The change worth watching is multilateral finance for coastal adaptation, which is beginning to fund baseline terrain datasets that regional agencies could not otherwise commission.
Middle East & Africa Grows From Port Development and Red Sea Clarity
Middle East & Africa held 6% of revenue in 2026, the smallest share but with unusually favourable conditions in part of the region. The United Arab Emirates, Saudi Arabia, Qatar, Oman, Egypt and South Africa account for most activity. Coastal megaprojects, artificial island construction, port expansion and tourism development along the Red Sea generate survey demand, and Red Sea water clarity is among the best in the world for laser bathymetry. Naval and coastal defence programmes add a second buyer. Barriers include limited local processing capability, security restrictions on aerial survey and the dominance of dredging contractors who bring their own acoustic systems. The opportunity is subsea inspection for the region’s extensive offshore oil and gas infrastructure, where laser metrology can reduce costly repeat vessel mobilisations.
Competitive Landscape
The market is moderately concentrated, and it splits into two groups that rarely compete directly. Airborne bathymetric sensors come from a handful of established laser scanning manufacturers with aviation-grade engineering and long customer relationships with hydrographic agencies. Subsea laser scanners come from a smaller set of specialist firms built around underwater optics and pressure-tolerant design. Few vendors credibly serve both domains. A third layer, the survey service providers, buys from both groups and competes on crew, aircraft, vessels and processing throughput rather than on sensor design.
Competition rests on measurable technical ground. Achievable depth expressed in Secchi depths is the first comparison a buyer makes, followed by point density, horizontal and vertical accuracy against IHO S-44 order categories, and the proportion of a survey area that passes quality control on the first pass. Eye safety classification under IEC 60825 governs where and how a system may be operated, which matters for low-altitude and diver-deployed work. Sensor weight is an increasingly decisive specification, because it determines whether a payload flies on an uncrewed aircraft or needs a crewed one.
Strategic activity has centred on integration rather than on headline product races. Sensor manufacturers have moved into processing software so that the deliverable, not the instrument, becomes the product. Survey contractors have added subsea laser capability alongside acoustic fleets so they can bid combined scopes. Several hardware vendors now sell through service partners rather than directly, which spreads the cost of training scarce processing staff. Consolidation has been modest, reflecting how small the installed base remains.
Vendor strategy points in three directions: reducing size, weight and power so sensors fit uncrewed platforms, automating the processing chain to remove the labour bottleneck, and aligning data products with the S-100 framework so outputs feed directly into charting workflows.
Underwater LiDAR Industry Leaders
- Teledyne Technologies Incorporated
- Leica Geosystems AG
- RIEGL Laser Measurement Systems GmbH
- 3D at Depth, Inc.
- Fugro N.V.
Recent Industry Developments
- 2020: The International Hydrographic Organization published Edition 6.0.0 of S-44, its standards for hydrographic surveys – the revised order categories gave agencies a common accuracy framework against which laser bathymetry can be specified and accepted.
- December 2020: European Union operating rules for uncrewed aircraft systems became applicable across member states – they created a common risk-based authorisation route that survey operators now use to plan shoreline flights.
- January 2021: The United Nations Decade of Ocean Science for Sustainable Development began – it set a coordinated international push for seabed and coastal mapping that has supported national survey funding across several regions.
- August 2025: The Federal Aviation Administration issued its proposed rule for routine beyond-visual-line-of-sight uncrewed aircraft operations – approval would materially lower the cost of small-area airborne bathymetric survey in the United States.
- January 2026: Carriage requirements for chart systems capable of handling the International Hydrographic Organization S-100 data framework took effect – the shift pushes survey deliverables toward structured, machine-readable products rather than legacy chart formats.
Companies Covered in the Report
- Teledyne Technologies Incorporated
- Leica Geosystems AG
- RIEGL Laser Measurement Systems GmbH
- 3D at Depth, Inc.
- Voyis Imaging Inc.
- Kraken Robotics Inc.
- Cathx Ocean Limited
- Fugro N.V.
- Woolpert, Inc.
- NV5 Global, Inc.
- Oceaneering International, Inc.
- QPS B.V.
Underwater LiDAR Market Report Scope
This study covers laser systems that range and image through water: airborne bathymetric and topo-bathymetric sensors flown on crewed and uncrewed aircraft, and subsea laser scanners carried by remotely operated vehicles, autonomous underwater vehicles and divers, together with their processing software and the survey services built on them. Multibeam and sidescan sonar are excluded. The base year is 2025 and the forecast period runs from 2026 to 2033, reported in US$ Billion.
Platform
- Airborne Bathymetric Systems
- Uncrewed Aircraft Mounted
- Remotely Operated Vehicle Mounted
- Autonomous Underwater Vehicle Mounted
- Diver and Pole Mounted
Offering
- Hardware
- Software and Data Processing
- Survey Services
Application
- Hydrographic Charting and Coastal Mapping
- Offshore Wind and Marine Construction Survey
- Subsea Asset Inspection and Metrology
- Dredging and Port Maintenance
- Pipeline and Cable Route Survey
- Marine Habitat Mapping
- Defence and Mine Countermeasures
End User
- Government and Hydrographic Agencies
- Survey and Engineering Service Providers
- Energy Operators and Developers
- Defence and Naval Forces
- Research and Academic Institutions
Regions
- North America
- Europe
- Asia Pacific
- Latin America
- Middle East & Africa
Key Questions Answered in the Report
How big is the underwater lidar market in 2026?
The market is valued at US$ 0.4 billion in 2026, covering airborne bathymetric sensors, subsea laser scanners, processing software and the survey services built on them.
What is the forecast size and CAGR for underwater lidar through 2033?
Revenue is projected to reach US$ 0.9 billion by 2033, a 12.3% CAGR and an absolute dollar opportunity of US$ 0.5 billion across the forecast period.
Which application holds the largest underwater lidar market share?
Hydrographic Charting and Coastal Mapping leads with 29% share in 2026, supported by recurring national charting programmes and coastal zone management obligations.
Which underwater lidar segment is growing fastest to 2033?
Offshore Wind and Marine Construction Survey grows fastest at a 17.6% CAGR, as cable landfall and nearshore route work concentrates where acoustic survey performs worst.
Which region leads the underwater lidar market?
North America leads with 36% share in 2026, supported by federal charting and coastal programmes, defence demand and clear-water conditions across its southern coastline.
1. Executive Summary
1.1. Global Underwater LiDAR Market Snapshot
1.2. Future Projections
1.3. Key Report Takeaways
1.4. Regional Snapshot
2. Market Overview
2.1. Market Definition and Report Scope
2.2. Historical Trends 2020–2025
2.3. Market Dynamics
2.3.1. Drivers
2.3.1.1. Nearshore Wind and Cable Route Survey Rewards Resolution Where Vessels Cannot Work
2.3.1.2. Coastal Resilience and Flood Mapping Budgets Fund Seamless Land-to-Seabed Datasets
2.3.2. Restraints
2.3.2.1. Water Clarity Sets a Physical Ceiling That No Sensor Design Can Remove
2.3.2.2. Instrument Price, Operator Scarcity and Narrow Weather Windows Cap Fleet Utilisation
2.3.3. Market Opportunities
2.3.3.1. Subsea Metrology for Spool Piece Measurement Opens a High-Value Inspection Pool
2.3.3.2. Uncrewed Aircraft and Surface Vessel Platforms Create a Low-Cost Shallow Survey Pool
3. Global Underwater LiDAR Market Outlook, 2020–2033
3.1. Global Underwater LiDAR Market Outlook, by Platform, Value (US$ Billion), 2020–2033
3.1.1. Airborne Bathymetric Systems
3.1.2. Uncrewed Aircraft Mounted
3.1.3. Remotely Operated Vehicle Mounted
3.1.4. Autonomous Underwater Vehicle Mounted
3.1.5. Diver and Pole Mounted
3.2. Global Underwater LiDAR Market Outlook, by Offering, Value (US$ Billion), 2020–2033
3.2.1. Hardware
3.2.2. Software and Data Processing
3.2.3. Survey Services
3.3. Global Underwater LiDAR Market Outlook, by Application, Value (US$ Billion), 2020–2033
3.3.1. Hydrographic Charting and Coastal Mapping
3.3.2. Offshore Wind and Marine Construction Survey
3.3.3. Subsea Asset Inspection and Metrology
3.3.4. Dredging and Port Maintenance
3.3.5. Pipeline and Cable Route Survey
3.3.6. Marine Habitat Mapping
3.3.7. Defence and Mine Countermeasures
3.4. Global Underwater LiDAR Market Outlook, by End User, Value (US$ Billion), 2020–2033
3.4.1. Government and Hydrographic Agencies
3.4.2. Survey and Engineering Service Providers
3.4.3. Energy Operators and Developers
3.4.4. Defence and Naval Forces
3.4.5. Research and Academic Institutions
3.5. Global Underwater LiDAR Market Outlook, by Region, Value (US$ Billion), 2020–2033
3.5.1. North America
3.5.2. Europe
3.5.3. Asia Pacific
3.5.4. Latin America
3.5.5. Middle East & Africa
4. North America Underwater LiDAR Market Outlook, 2020–2033
4.1. North America Underwater LiDAR Market Outlook, by Platform, Value (US$ Billion), 2020–2033
4.1.1. Airborne Bathymetric Systems
4.1.2. Uncrewed Aircraft Mounted
4.1.3. Remotely Operated Vehicle Mounted
4.1.4. Autonomous Underwater Vehicle Mounted
4.1.5. Diver and Pole Mounted
4.2. North America Underwater LiDAR Market Outlook, by Offering, Value (US$ Billion), 2020–2033
4.2.1. Hardware
4.2.2. Software and Data Processing
4.2.3. Survey Services
4.3. North America Underwater LiDAR Market Outlook, by Application, Value (US$ Billion), 2020–2033
4.3.1. Hydrographic Charting and Coastal Mapping
4.3.2. Offshore Wind and Marine Construction Survey
4.3.3. Subsea Asset Inspection and Metrology
4.3.4. Dredging and Port Maintenance
4.3.5. Pipeline and Cable Route Survey
4.3.6. Marine Habitat Mapping
4.3.7. Defence and Mine Countermeasures
4.4. North America Underwater LiDAR Market Outlook, by End User, Value (US$ Billion), 2020–2033
4.4.1. Government and Hydrographic Agencies
4.4.2. Survey and Engineering Service Providers
4.4.3. Energy Operators and Developers
4.4.4. Defence and Naval Forces
4.4.5. Research and Academic Institutions
4.5. North America Underwater LiDAR Market Outlook, by Country, Value (US$ Billion), 2020–2033
4.5.1. United States Underwater LiDAR Market Outlook, by Platform, 2020–2033
4.5.2. United States Underwater LiDAR Market Outlook, by Offering, 2020–2033
4.5.3. United States Underwater LiDAR Market Outlook, by Application, 2020–2033
4.5.4. United States Underwater LiDAR Market Outlook, by End User, 2020–2033
4.5.5. Canada Underwater LiDAR Market Outlook, by Platform, 2020–2033
4.5.6. Canada Underwater LiDAR Market Outlook, by Offering, 2020–2033
4.5.7. Canada Underwater LiDAR Market Outlook, by Application, 2020–2033
4.5.8. Canada Underwater LiDAR Market Outlook, by End User, 2020–2033
5. Europe Underwater LiDAR Market Outlook, 2020–2033
5.1. Europe Underwater LiDAR Market Outlook, by Platform, Value (US$ Billion), 2020–2033
5.1.1. Airborne Bathymetric Systems
5.1.2. Uncrewed Aircraft Mounted
5.1.3. Remotely Operated Vehicle Mounted
5.1.4. Autonomous Underwater Vehicle Mounted
5.1.5. Diver and Pole Mounted
5.2. Europe Underwater LiDAR Market Outlook, by Offering, Value (US$ Billion), 2020–2033
5.2.1. Hardware
5.2.2. Software and Data Processing
5.2.3. Survey Services
5.3. Europe Underwater LiDAR Market Outlook, by Application, Value (US$ Billion), 2020–2033
5.3.1. Hydrographic Charting and Coastal Mapping
5.3.2. Offshore Wind and Marine Construction Survey
5.3.3. Subsea Asset Inspection and Metrology
5.3.4. Dredging and Port Maintenance
5.3.5. Pipeline and Cable Route Survey
5.3.6. Marine Habitat Mapping
5.3.7. Defence and Mine Countermeasures
5.4. Europe Underwater LiDAR Market Outlook, by End User, Value (US$ Billion), 2020–2033
5.4.1. Government and Hydrographic Agencies
5.4.2. Survey and Engineering Service Providers
5.4.3. Energy Operators and Developers
5.4.4. Defence and Naval Forces
5.4.5. Research and Academic Institutions
5.5. Europe Underwater LiDAR Market Outlook, by Country, Value (US$ Billion), 2020–2033
5.5.1. United Kingdom Underwater LiDAR Market Outlook, by Platform, 2020–2033
5.5.2. United Kingdom Underwater LiDAR Market Outlook, by Offering, 2020–2033
5.5.3. United Kingdom Underwater LiDAR Market Outlook, by Application, 2020–2033
5.5.4. United Kingdom Underwater LiDAR Market Outlook, by End User, 2020–2033
5.5.5. Germany Underwater LiDAR Market Outlook, by Platform, 2020–2033
5.5.6. Germany Underwater LiDAR Market Outlook, by Offering, 2020–2033
5.5.7. Germany Underwater LiDAR Market Outlook, by Application, 2020–2033
5.5.8. Germany Underwater LiDAR Market Outlook, by End User, 2020–2033
5.5.9. Denmark Underwater LiDAR Market Outlook, by Platform, 2020–2033
5.5.10. Denmark Underwater LiDAR Market Outlook, by Offering, 2020–2033
5.5.11. Denmark Underwater LiDAR Market Outlook, by Application, 2020–2033
5.5.12. Denmark Underwater LiDAR Market Outlook, by End User, 2020–2033
5.5.13. Netherlands Underwater LiDAR Market Outlook, by Platform, 2020–2033
5.5.14. Netherlands Underwater LiDAR Market Outlook, by Offering, 2020–2033
5.5.15. Netherlands Underwater LiDAR Market Outlook, by Application, 2020–2033
5.5.16. Netherlands Underwater LiDAR Market Outlook, by End User, 2020–2033
5.5.17. Belgium Underwater LiDAR Market Outlook, by Platform, 2020–2033
5.5.18. Belgium Underwater LiDAR Market Outlook, by Offering, 2020–2033
5.5.19. Belgium Underwater LiDAR Market Outlook, by Application, 2020–2033
5.5.20. Belgium Underwater LiDAR Market Outlook, by End User, 2020–2033
5.5.21. France Underwater LiDAR Market Outlook, by Platform, 2020–2033
5.5.22. France Underwater LiDAR Market Outlook, by Offering, 2020–2033
5.5.23. France Underwater LiDAR Market Outlook, by Application, 2020–2033
5.5.24. France Underwater LiDAR Market Outlook, by End User, 2020–2033
5.5.25. Norway Underwater LiDAR Market Outlook, by Platform, 2020–2033
5.5.26. Norway Underwater LiDAR Market Outlook, by Offering, 2020–2033
5.5.27. Norway Underwater LiDAR Market Outlook, by Application, 2020–2033
5.5.28. Norway Underwater LiDAR Market Outlook, by End User, 2020–2033
6. Asia Pacific Underwater LiDAR Market Outlook, 2020–2033
6.1. Asia Pacific Underwater LiDAR Market Outlook, by Platform, Value (US$ Billion), 2020–2033
6.1.1. Airborne Bathymetric Systems
6.1.2. Uncrewed Aircraft Mounted
6.1.3. Remotely Operated Vehicle Mounted
6.1.4. Autonomous Underwater Vehicle Mounted
6.1.5. Diver and Pole Mounted
6.2. Asia Pacific Underwater LiDAR Market Outlook, by Offering, Value (US$ Billion), 2020–2033
6.2.1. Hardware
6.2.2. Software and Data Processing
6.2.3. Survey Services
6.3. Asia Pacific Underwater LiDAR Market Outlook, by Application, Value (US$ Billion), 2020–2033
6.3.1. Hydrographic Charting and Coastal Mapping
6.3.2. Offshore Wind and Marine Construction Survey
6.3.3. Subsea Asset Inspection and Metrology
6.3.4. Dredging and Port Maintenance
6.3.5. Pipeline and Cable Route Survey
6.3.6. Marine Habitat Mapping
6.3.7. Defence and Mine Countermeasures
6.4. Asia Pacific Underwater LiDAR Market Outlook, by End User, Value (US$ Billion), 2020–2033
6.4.1. Government and Hydrographic Agencies
6.4.2. Survey and Engineering Service Providers
6.4.3. Energy Operators and Developers
6.4.4. Defence and Naval Forces
6.4.5. Research and Academic Institutions
6.5. Asia Pacific Underwater LiDAR Market Outlook, by Country, Value (US$ Billion), 2020–2033
6.5.1. China Underwater LiDAR Market Outlook, by Platform, 2020–2033
6.5.2. China Underwater LiDAR Market Outlook, by Offering, 2020–2033
6.5.3. China Underwater LiDAR Market Outlook, by Application, 2020–2033
6.5.4. China Underwater LiDAR Market Outlook, by End User, 2020–2033
6.5.5. Japan Underwater LiDAR Market Outlook, by Platform, 2020–2033
6.5.6. Japan Underwater LiDAR Market Outlook, by Offering, 2020–2033
6.5.7. Japan Underwater LiDAR Market Outlook, by Application, 2020–2033
6.5.8. Japan Underwater LiDAR Market Outlook, by End User, 2020–2033
6.5.9. Australia Underwater LiDAR Market Outlook, by Platform, 2020–2033
6.5.10. Australia Underwater LiDAR Market Outlook, by Offering, 2020–2033
6.5.11. Australia Underwater LiDAR Market Outlook, by Application, 2020–2033
6.5.12. Australia Underwater LiDAR Market Outlook, by End User, 2020–2033
6.5.13. South Korea Underwater LiDAR Market Outlook, by Platform, 2020–2033
6.5.14. South Korea Underwater LiDAR Market Outlook, by Offering, 2020–2033
6.5.15. South Korea Underwater LiDAR Market Outlook, by Application, 2020–2033
6.5.16. South Korea Underwater LiDAR Market Outlook, by End User, 2020–2033
6.5.17. India Underwater LiDAR Market Outlook, by Platform, 2020–2033
6.5.18. India Underwater LiDAR Market Outlook, by Offering, 2020–2033
6.5.19. India Underwater LiDAR Market Outlook, by Application, 2020–2033
6.5.20. India Underwater LiDAR Market Outlook, by End User, 2020–2033
6.5.21. Taiwan Underwater LiDAR Market Outlook, by Platform, 2020–2033
6.5.22. Taiwan Underwater LiDAR Market Outlook, by Offering, 2020–2033
6.5.23. Taiwan Underwater LiDAR Market Outlook, by Application, 2020–2033
6.5.24. Taiwan Underwater LiDAR Market Outlook, by End User, 2020–2033
7. Latin America Underwater LiDAR Market Outlook, 2020–2033
7.1. Latin America Underwater LiDAR Market Outlook, by Platform, Value (US$ Billion), 2020–2033
7.1.1. Airborne Bathymetric Systems
7.1.2. Uncrewed Aircraft Mounted
7.1.3. Remotely Operated Vehicle Mounted
7.1.4. Autonomous Underwater Vehicle Mounted
7.1.5. Diver and Pole Mounted
7.2. Latin America Underwater LiDAR Market Outlook, by Offering, Value (US$ Billion), 2020–2033
7.2.1. Hardware
7.2.2. Software and Data Processing
7.2.3. Survey Services
7.3. Latin America Underwater LiDAR Market Outlook, by Application, Value (US$ Billion), 2020–2033
7.3.1. Hydrographic Charting and Coastal Mapping
7.3.2. Offshore Wind and Marine Construction Survey
7.3.3. Subsea Asset Inspection and Metrology
7.3.4. Dredging and Port Maintenance
7.3.5. Pipeline and Cable Route Survey
7.3.6. Marine Habitat Mapping
7.3.7. Defence and Mine Countermeasures
7.4. Latin America Underwater LiDAR Market Outlook, by End User, Value (US$ Billion), 2020–2033
7.4.1. Government and Hydrographic Agencies
7.4.2. Survey and Engineering Service Providers
7.4.3. Energy Operators and Developers
7.4.4. Defence and Naval Forces
7.4.5. Research and Academic Institutions
7.5. Latin America Underwater LiDAR Market Outlook, by Country, Value (US$ Billion), 2020–2033
7.5.1. Brazil Underwater LiDAR Market Outlook, by Platform, 2020–2033
7.5.2. Brazil Underwater LiDAR Market Outlook, by Offering, 2020–2033
7.5.3. Brazil Underwater LiDAR Market Outlook, by Application, 2020–2033
7.5.4. Brazil Underwater LiDAR Market Outlook, by End User, 2020–2033
7.5.5. Mexico Underwater LiDAR Market Outlook, by Platform, 2020–2033
7.5.6. Mexico Underwater LiDAR Market Outlook, by Offering, 2020–2033
7.5.7. Mexico Underwater LiDAR Market Outlook, by Application, 2020–2033
7.5.8. Mexico Underwater LiDAR Market Outlook, by End User, 2020–2033
7.5.9. Chile Underwater LiDAR Market Outlook, by Platform, 2020–2033
7.5.10. Chile Underwater LiDAR Market Outlook, by Offering, 2020–2033
7.5.11. Chile Underwater LiDAR Market Outlook, by Application, 2020–2033
7.5.12. Chile Underwater LiDAR Market Outlook, by End User, 2020–2033
7.5.13. Colombia Underwater LiDAR Market Outlook, by Platform, 2020–2033
7.5.14. Colombia Underwater LiDAR Market Outlook, by Offering, 2020–2033
7.5.15. Colombia Underwater LiDAR Market Outlook, by Application, 2020–2033
7.5.16. Colombia Underwater LiDAR Market Outlook, by End User, 2020–2033
8. Middle East & Africa Underwater LiDAR Market Outlook, 2020–2033
8.1. Middle East & Africa Underwater LiDAR Market Outlook, by Platform, Value (US$ Billion), 2020–2033
8.1.1. Airborne Bathymetric Systems
8.1.2. Uncrewed Aircraft Mounted
8.1.3. Remotely Operated Vehicle Mounted
8.1.4. Autonomous Underwater Vehicle Mounted
8.1.5. Diver and Pole Mounted
8.2. Middle East & Africa Underwater LiDAR Market Outlook, by Offering, Value (US$ Billion), 2020–2033
8.2.1. Hardware
8.2.2. Software and Data Processing
8.2.3. Survey Services
8.3. Middle East & Africa Underwater LiDAR Market Outlook, by Application, Value (US$ Billion), 2020–2033
8.3.1. Hydrographic Charting and Coastal Mapping
8.3.2. Offshore Wind and Marine Construction Survey
8.3.3. Subsea Asset Inspection and Metrology
8.3.4. Dredging and Port Maintenance
8.3.5. Pipeline and Cable Route Survey
8.3.6. Marine Habitat Mapping
8.3.7. Defence and Mine Countermeasures
8.4. Middle East & Africa Underwater LiDAR Market Outlook, by End User, Value (US$ Billion), 2020–2033
8.4.1. Government and Hydrographic Agencies
8.4.2. Survey and Engineering Service Providers
8.4.3. Energy Operators and Developers
8.4.4. Defence and Naval Forces
8.4.5. Research and Academic Institutions
8.5. Middle East & Africa Underwater LiDAR Market Outlook, by Country, Value (US$ Billion), 2020–2033
8.5.1. United Arab Emirates Underwater LiDAR Market Outlook, by Platform, 2020–2033
8.5.2. United Arab Emirates Underwater LiDAR Market Outlook, by Offering, 2020–2033
8.5.3. United Arab Emirates Underwater LiDAR Market Outlook, by Application, 2020–2033
8.5.4. United Arab Emirates Underwater LiDAR Market Outlook, by End User, 2020–2033
8.5.5. Saudi Arabia Underwater LiDAR Market Outlook, by Platform, 2020–2033
8.5.6. Saudi Arabia Underwater LiDAR Market Outlook, by Offering, 2020–2033
8.5.7. Saudi Arabia Underwater LiDAR Market Outlook, by Application, 2020–2033
8.5.8. Saudi Arabia Underwater LiDAR Market Outlook, by End User, 2020–2033
8.5.9. Qatar Underwater LiDAR Market Outlook, by Platform, 2020–2033
8.5.10. Qatar Underwater LiDAR Market Outlook, by Offering, 2020–2033
8.5.11. Qatar Underwater LiDAR Market Outlook, by Application, 2020–2033
8.5.12. Qatar Underwater LiDAR Market Outlook, by End User, 2020–2033
8.5.13. Oman Underwater LiDAR Market Outlook, by Platform, 2020–2033
8.5.14. Oman Underwater LiDAR Market Outlook, by Offering, 2020–2033
8.5.15. Oman Underwater LiDAR Market Outlook, by Application, 2020–2033
8.5.16. Oman Underwater LiDAR Market Outlook, by End User, 2020–2033
8.5.17. Egypt Underwater LiDAR Market Outlook, by Platform, 2020–2033
8.5.18. Egypt Underwater LiDAR Market Outlook, by Offering, 2020–2033
8.5.19. Egypt Underwater LiDAR Market Outlook, by Application, 2020–2033
8.5.20. Egypt Underwater LiDAR Market Outlook, by End User, 2020–2033
8.5.21. South Africa Underwater LiDAR Market Outlook, by Platform, 2020–2033
8.5.22. South Africa Underwater LiDAR Market Outlook, by Offering, 2020–2033
8.5.23. South Africa Underwater LiDAR Market Outlook, by Application, 2020–2033
8.5.24. South Africa Underwater LiDAR Market Outlook, by End User, 2020–2033
9. Competitive Landscape
9.1. Market Concentration and Industry Leaders
9.2. Competitive Differentiation
9.3. Strategic Moves and Market Direction
9.4. Recent Industry Developments
9.5. Company Profiles
9.5.1. Teledyne Technologies Incorporated
9.5.2. Leica Geosystems AG
9.5.3. RIEGL Laser Measurement Systems GmbH
9.5.4. 3D at Depth, Inc.
9.5.5. Voyis Imaging Inc.
9.5.6. Kraken Robotics Inc.
9.5.7. Cathx Ocean Limited
9.5.8. Fugro N.V.
9.5.9. Woolpert, Inc.
9.5.10. NV5 Global, Inc.
9.5.11. Oceaneering International, Inc.
9.5.12. QPS B.V.
10. Appendix
10.1. Research Methodology
10.2. Report Assumptions
10.3. Acronyms and Abbreviations
| Platform | Airborne Bathymetric Systems, Uncrewed Aircraft Mounted, Remotely Operated Vehicle Mounted, Autonomous Underwater Vehicle Mounted, Diver and Pole Mounted |
| Offering | Hardware, Software and Data Processing, Survey Services |
| Application | Hydrographic Charting and Coastal Mapping, Offshore Wind and Marine Construction Survey, Subsea Asset Inspection and Metrology, Dredging and Port Maintenance, Pipeline and Cable Route Survey, Marine Habitat Mapping, Defence and Mine Countermeasures |
| End User | Government and Hydrographic Agencies, Survey and Engineering Service Providers, Energy Operators and Developers, Defence and Naval Forces, Research and Academic Institutions |
| Regions | North America, Europe, Asia Pacific, Latin America, Middle East & Africa |
Our Research Methodology
Considering the volatility of business today, traditional approaches to strategizing a game plan can be unfruitful if not detrimental. True ambiguity is no way to determine a forecast. A myriad of predetermined factors must be accounted for such as the degree of risk involved, the magnitude of circumstances, as well as conditions or consequences that are not known or unpredictable. To circumvent binary views that cast uncertainty, the application of market research intelligence to strategically posture, move, and enable actionable outcomes is necessary.
View Methodology
Quality Assured
Rigorous Validation Process

Confidentiality Assured
End-to-end Data Security

Custom Research Services
Tailored To Your Objectives
FAQs
The market is valued at US$ 0.4 billion in 2026, covering airborne bathymetric sensors, subsea laser scanners, processing software and the survey services built on them.
Revenue is projected to reach US$ 0.9 billion by 2033, a 12.3% CAGR and an absolute dollar opportunity of US$ 0.5 billion across the forecast period.
Hydrographic Charting and Coastal Mapping leads with 29% share in 2026, supported by recurring national charting programmes and coastal zone management obligations.
Offshore Wind and Marine Construction Survey grows fastest at a 17.6% CAGR, as cable landfall and nearshore route work concentrates where acoustic survey performs worst.
North America leads with 36% share in 2026, supported by federal charting and coastal programmes, defence demand and clear-water conditions across its southern coastline.
Related Reports
Aerial Imaging Market Size, Share, Insights, Competitive Landscape, and Forecast 2026 to 2033
The global aerial imaging market is valued at US$3.83 billion in 2026, reaching US$8.13 billion by 2033, growing at an 11.4% CAGR
Satcom Terminal Market Size, Share, Insights, Competitive Landscape, and Forecast 2026 to 2033
The satcom terminal market is projected to grow from US$8.6 billion in 2026 to US$20.6 billion by 2033, at a 13.3% CAGR. Explore segments and key trends.
Non-Dispersive Infrared Market Size, Share, Insights, Competitive Landscape, and Forecast 2026 to 2033
The non-dispersive infrared market is projected to grow from US$1.6 billion in 2026 to US$2.7 billion by 2033, at a 7.8% CAGR. Explore segments and trends.
5G Edge Computing Market Size, Share, Insights, Competitive Landscape, and Forecast 2026 to 2033
The global 5G edge computing market is valued at US$10.45 billion in 2026, reaching US$161.37 billion by 2033, growing at a 47.8% CAGR
Wearable Cameras Market Size, Share, Insights, Competitive Landscape, and Forecast 2026 to 2033
The global wearable cameras market is valued at US$8.80 billion in 2026, reaching US$20.80 billion by 2033, growing at a 13.1% CAGR
Spend Analytics Market Size, Share, Insights, Competitive Landscape, and Forecast 2026 to 2033
The global spend analytics market is valued at US$3.90 billion in 2026, reaching US$10.40 billion by 2033, growing at a 15.0% CAGR