



Aloe Vera Extract Market
Aloe Vera Extract Market Size, Share, Insights, Competitive Landscape, and Forecast 2026 to 2033
How Large Is the Aloe Vera Extract Market Today?
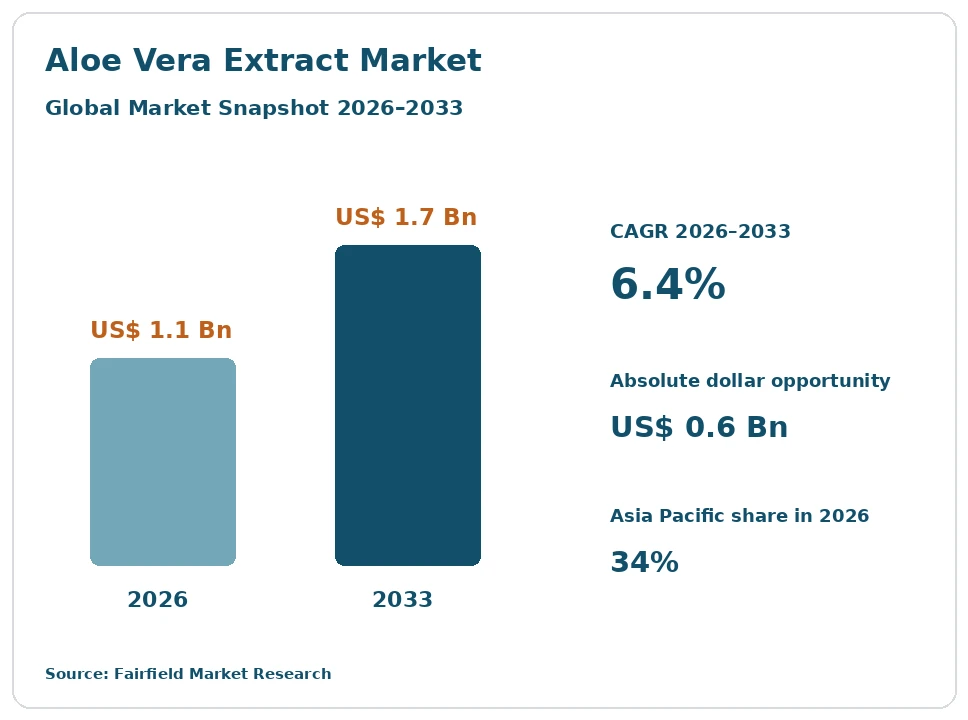
The global aloe vera extract market size is expected to be valued at US$ 1.1 billion in 2026 and projected to reach US$ 1.7 billion by 2033, growing at a CAGR of 6.4% between 2026 and 2033.
The trade grew at about 5.2% a year between 2020 and 2025, ending near US$ 1.0 billion. This is a small ingredient market with an unusual cost structure. Processing requirements set by food law separate the grades: material containing the leaf latex layer must be decolourised and aloin-reduced before it can enter food in the European Union, while inner-leaf fillet avoids that step by excluding the latex. Growth comes from three places: personal care formulators buying standardised gel and powder, beverage manufacturers in Asia Pacific and Latin America, and buyers paying more for certified and independently tested material. Commodity gel remains price-competitive and fragmented, so value growth is concentrated in tested, documented and higher-fold grades rather than in bulk tonnage.
Key Report Takeaways
- By Product Form: Liquid Gel and Juice held 41% share in 2026, while Freeze-Dried Powder is projected to expand at an 8.1% CAGR through 2033, driven by buyers who need low-moisture material with documented polysaccharide content for dry formats.
- By Extract Grade: Inner Leaf Fillet held 46% share in 2026, while Decolourised and Aloin-Reduced Grade is projected to expand at a 7.9% CAGR through 2033, driven by the hydroxyanthracene restriction that governs whole leaf material entering food.
- By Application: Personal Care and Cosmetics held 38% share in 2026, while Dietary Supplements are projected to expand at a 7.5% CAGR through 2033, driven by standardised fractions sold against defined analytical specifications.
- By Distribution Channel: Direct Sales to Manufacturers held 58% share in 2026, while Online B2B Platforms are projected to expand at a 9.2% CAGR through 2033, driven by smaller formulators sourcing sample and pilot quantities with documentation attached.
- By Geography: Asia Pacific held 34% share in 2026, while Latin America is projected to expand at a 7.6% CAGR through 2033, driven by cultivation capacity sitting alongside expanding regional beverage and cosmetic manufacturing.
Global Aloe Vera Extract Market Trends and Insights
Drivers Impact Analysis
Two forces account for most of the value growth in this comparatively small ingredient trade.
Food Law Purification Requirements Shift Aloe Vera Extract Demand Toward Processed Grades
The regulatory position on the leaf latex layer is the defining commercial fact in this trade, and it moves demand upward in value. The layer between the rind and the inner gel contains hydroxyanthracene derivatives, including aloin, and the European Union prohibits those compounds in food. Whole leaf material must first be decolourised and aloin-reduced before it can be sold into food in that market, while inner-leaf fillet sidesteps the question by excluding the latex entirely.
The mechanism is processing economics. Decolourisation through activated carbon filtration, combined with analytical verification of residual aloin at specified limits, adds plant capacity, consumable cost and testing cost to every batch. That favours processors who have already installed the capability and can certify compliance on paper. Exporters in Mexico, India and China targeting European food customers must meet the same specification, so the requirement propagates well beyond the jurisdiction that set it.
Authentication Requirements Push Buyers Toward Certified and Tested Aloe Vera Supply
Documented authenticity has become a purchasing condition rather than an assurance, and it raises the realised price of verified material. Aloe is traded by fold concentration, which makes dilution easy to conceal, and maltodextrin and similar carriers can be substituted for genuine solids without an obvious visual difference. Buyers that have been caught out once now specify analytical testing and third-party certification in the purchase contract itself.
The mechanism is analytical and contractual. Marker polysaccharide content, including acemannan, together with organic acid and sugar profiling, provides measurable evidence of identity and concentration. International Aloe Science Council certification gives the industry a recognised programme built around these methods, and large personal care and beverage customers increasingly make it a condition of listing. Suppliers that can present certificates of analysis per lot win contracts that price-only competitors cannot reach.
| Driver | Impact on CAGR Forecast | Geographic Relevance | Impact Timeline |
| Purification requirements that shift demand toward processed, aloin-reduced grades | High | European Union, with knock-on effects on exporters | Short term ≤2 years |
| Buyer insistence on certified and analytically verified material | High | Global, strongest in North America and Europe | Medium term 2–4 years |
Restraints Impact Analysis
Two restraints limit both the addressable volume and the margin available in this market.
Aloin Restrictions and Decolourisation Costs Narrow the Usable Aloe Vera Extract Supply Base
The same rule that lifts value also removes supply. Whole leaf material that has not been decolourised and aloin-reduced cannot enter food in the European Union, which disqualifies a share of global production from that market outright. Smaller growers and processors without carbon filtration capacity are confined to personal care, animal and domestic food outlets, and the pool of suppliers that can serve regulated food customers is correspondingly narrow.
The cost is specific rather than general. Activated carbon filtration consumes media that must be replaced and disposed of, adds a processing step with its own yield loss, and requires validated analytical testing for residual hydroxyanthracene content on every batch. Documentation and audit obligations follow. A further complication is the European Union novel food framework, under which certain aloe preparations require authorisation before use, adding time and dossier cost before a grade can be commercialised.
Crop Concentration and Commodity Gel Pricing Compress Margins Across Aloe Vera Extract Supply
Raw material supply is geographically narrow, which transmits weather directly into price. Cultivation is weighted toward a small number of hot-climate origins, principally Mexico, the Dominican Republic, India, China and parts of Africa. Drought, hurricane damage or an unusual cold event in one of these origins moves leaf availability and price for the whole trade, and replanting takes several years because the plant needs time to reach harvestable size.
Margin pressure comes from the opposite end. Undifferentiated single-fold gel is close to a commodity, with many producers and low technical barriers, so buyers switch on price alone. Freight cost is significant because single-fold material is mostly water, which pushes processors toward concentrates and powders and penalises anyone shipping dilute product long distances. Combined with testing costs that cannot be avoided, this leaves thin margins on standard grades.
| Restraint | Impact on CAGR Forecast | Geographic Relevance | Impact Timeline |
| Hydroxyanthracene restrictions and the cost of decolourisation | High | European Union and export supply chains serving it | Short term ≤2 years |
| Crop concentration, weather exposure and commodity gel price competition | Medium | Latin America, Asia Pacific, Africa | Medium term 2–4 years |
Market Opportunities
Certified Aloin-Reduced Food Grades Open a Protected Revenue Pool for Qualified Processors
The clearest revenue pool sits in certified, aloin-reduced food grades, where the barrier to entry is capital and compliance rather than agronomy. Buyers serving regulated food and beverage markets need material that is documented as compliant on every lot, and they will pay a premium above commodity gel for it. Because few processors hold both the filtration capacity and the analytical infrastructure, the supplier list for these contracts is short and relatively stable.
Beverage manufacturers, supplement brands and their contract packers create the demand, particularly those exporting into the European Union or into markets that reference its food rules. Capturing it requires validated decolourisation, in-house or accredited laboratory testing, and participation in a recognised certification programme. Suppliers that pair this with higher-fold concentrates reduce freight cost per unit of solids and improve the economics of long-distance supply.
Cosmetic Actives and Standardised Polysaccharide Fractions Build a Higher-Value Product Tier
Standardised fractions give processors a way out of commodity pricing. Instead of selling gel by fold, suppliers can sell material specified by marker polysaccharide content, including acemannan-standardised fractions, with a defined assay range and documented processing route. Personal care formulators buy these as specified ingredients with consistent batch behaviour, and the price sits well above bulk juice. Freeze-dried and spray-dried powders extend the same logic into dry formats and anhydrous systems.
Cosmetic manufacturers, contract formulators and supplement brands are the buyers, and they are concentrated in North America, Europe, South Korea and Japan. Capturing the pool requires analytical capability, stable supply from controlled cultivation, and the documentation that cosmetic ingredient registration demands. Organic certification and, where wild or local genetic resources are involved, access and benefit-sharing compliance add further qualification that smaller competitors often cannot provide.
Segment Analysis
By Product Form: Liquid Gel and Juice Lead Volume While Freeze-Dried Powder Grows Fastest
Liquid Gel and Juice held 41% share in 2026, the largest form by value, because beverage and personal care manufacturers buy single-fold and low-fold material in bulk and dilute or formulate it on site. Concentrate follows, valued for reducing freight cost per unit of solids on long export routes from Mexico, India and China. Spray-Dried Powder serves dry blends and capsules at moderate cost. Freeze-Dried Powder is the fastest-growing form at an 8.1% CAGR through 2033, bought where low-moisture material with documented polysaccharide content is specified and where processing temperature is tightly controlled. Its share stays small because the drying route is expensive. The implication is that form choice is driven mainly by freight economics and specification detail rather than by availability of raw leaf.
By Extract Grade: Inner Leaf Fillet Holds the Largest Share as Aloin-Reduced Grades Accelerate
Inner Leaf Fillet accounted for 46% of the market in 2026 because it excludes the latex layer at the filleting stage and so avoids the hydroxyanthracene question entirely, which simplifies qualification for food customers. Whole Leaf Extract retains a substantial position in personal care and in markets outside the European Union food restriction. Decolourised and Aloin-Reduced Grade is the fastest-growing grade at a 7.9% CAGR through 2033, since whole leaf material must be processed this way to reach regulated food channels, and processors with carbon filtration capacity are expanding output. Polysaccharide-Standardised Fraction is the smallest but highest-priced grade. The implication is that grade, not origin, determines which markets a given supplier can serve, and processing capability is the real entry barrier.
By Application: Personal Care Leads Demand While Dietary Supplements Expand Most Quickly
Personal Care and Cosmetics held 38% of demand in 2026, the largest application, because aloe-derived materials appear across a wide range of skin and hair formulations and because cosmetic use is not subject to the food restriction on hydroxyanthracene derivatives. Food and Beverage is the next largest, dominated by aloe drinks and pulp-containing beverages sold heavily in South Korea, Japan, China and Mexico. Pharmaceutical and Wound Care Formulations and Pet and Animal Products hold smaller, specification-led positions. Dietary Supplements is the fastest-growing application at a 7.5% CAGR through 2033, as supplement brands move to standardised fractions bought against defined analytical specifications. The implication is that applications with written specifications grow faster than those buying on price, which rewards processors with laboratory capability.
By Distribution Channel: Direct Manufacturer Supply Dominates While Online B2B Channels Gain Share
Direct Sales to Manufacturers accounted for 58% of trade in 2026, because large beverage and personal care buyers contract annually, audit supplier sites and require lot-level documentation that distributors cannot easily provide. Ingredient Distributors serve mid-sized formulators with smaller volumes and consolidated logistics, while Contract Processors handle filleting, decolourisation and drying on behalf of growers and brand owners. Online B2B Platforms are the fastest-growing channel at a 9.2% CAGR through 2033, used mainly by smaller formulators sourcing sample and pilot quantities with certificates of analysis attached to the listing. The implication is that documentation is becoming the unit of trade: whichever channel a buyer uses, the certificate and the test result travel with the lot and decide whether it qualifies.
Geography Analysis
North America Buys the Most Certified Material for Personal Care and Supplements
North America holds 28% share in 2026 and grows at 5.6%, with the United States taking most of the volume and Canada adding a smaller supplement and cosmetic demand base. The region buys a high proportion of certified and tested material, since personal care and supplement brands here carry the greatest exposure to retailer specification audits and class-action risk over ingredient content. Regulatory treatment is split: aloe is handled as a food ingredient in beverages and as a cosmetic ingredient in topical products, while its historical over-the-counter laxative status was withdrawn decades ago. Monograph specifications published by United States Pharmacopeia and comparable compendia give buyers a reference standard. Proximity to Mexican and Caribbean cultivation shortens supply lines materially.
Europe Applies the Strictest Compositional Rules to Aloe Vera Extract
Europe accounts for 21% share in 2026 and grows at 5.2%, led by Germany, France, Italy, Spain and the United Kingdom. Its influence exceeds its share because its compositional rules set the specification that exporters worldwide must meet. The prohibition on hydroxyanthracene derivatives in food, and on preparations from aloe leaf containing them, removes untreated whole leaf material from food use across the region. The novel food framework adds a separate authorisation step for certain aloe preparations before they may be placed on the market. Cosmetic use follows the region’s cosmetic rules instead and remains broadly open. The practical change is that food buyers here now qualify suppliers on analytical evidence of residual aloin before price is discussed.
Which Region Is Leading the Aloe Vera Extract Market?
Asia Pacific leads the aloe vera extract market with 34% share in 2026, driven by beverage consumption and by substantial domestic cultivation. South Korea, Japan and China anchor the aloe drinks category, which consumes large volumes of gel and pulp, while India and China are significant growers and processors that supply both local and export demand. Thailand, Indonesia and Australia add smaller processing bases. Regional growth of 7.2% is supported by expanding cosmetic manufacturing, especially in South Korea and Japan, where ingredient documentation standards are demanding. The constraint is quality dispersion across a fragmented grower base. The main change is investment in filleting and drying capacity near cultivation, which raises grade consistency and allows regional processors to serve export food customers.
Which Region Is Growing Fastest in the Aloe Vera Extract Market?
Latin America is growing fastest at a 7.6% CAGR through 2033, from 11% share in 2026. The region combines a cultivation base with expanding processing capacity, centred on Mexico, the Dominican Republic, Costa Rica and Brazil. Mexico is among the largest producing origins, with climate suited to year-round harvesting and established export routes north. Growth comes from processors moving beyond raw leaf and bulk juice into filleting, concentration and drying, which keeps more value in the region. The barriers are weather exposure, including hurricane and drought risk, variable farm-level quality control, and limited accredited laboratory capacity in some countries. Growing regional beverage and cosmetic manufacturing is the clearest opportunity, since it places buyers close to the cultivation base.
Middle East & Africa Supplies Emerging Origins From a Small Demand Base
Middle East & Africa holds 6% share in 2026 and grows at 7.0%, the smallest base in this market and the one with the widest spread between production and consumption. Cultivation is developing in Kenya, Tanzania, Nigeria, Ethiopia and South Africa, where climate conditions suit the crop and where export-oriented farming projects target buyers abroad. Consumption concentrates in the Gulf Cooperation Council states, with Saudi Arabia and the United Arab Emirates importing processed material for cosmetic and beverage manufacturing. The barriers are substantial: limited local processing and cold chain capability, little accredited testing infrastructure, and inconsistent farm practice that complicates certification. Access and benefit-sharing requirements apply where local genetic resources are used. Investment in filleting and drying capacity near farms is the main change under way.
Competitive Landscape
The aloe vera extract market is fragmented and has low concentration. Hundreds of growers and small processors operate across the producing origins, and no supplier holds a dominant global position. A smaller group of vertically integrated processors, controlling plantations, filleting lines, decolourisation capacity and laboratories, sits above the general field and takes most of the regulated food and branded personal care business. The gap between these two tiers is widening, because the capital and compliance requirements for certified grades are rising while commodity gel remains easy to enter.
Competition turns on verifiable quality rather than price in the upper tier. The decisive factors are certification status, lot-level certificates of analysis, residual aloin control, polysaccharide content consistency and the ability to pass customer audits. Organic certification and traceability to named farms are frequent additional conditions. In the commodity tier, competition is straightforwardly about delivered cost per unit of solids, where freight and fold strength dominate. New entrants are mostly origin-country processors moving downstream from leaf supply into finished extract.
Strategic activity concentrates on capability building rather than consolidation. Processors are adding decolourisation and drying capacity, investing in analytical laboratories, joining recognised certification programmes, and contracting cultivation acreage to secure leaf supply against weather risk. Several are also moving from single-fold juice toward concentrates and powders to cut freight cost per unit of solids on export routes.
Vendor strategy points toward specification-led supply. The suppliers positioned for the forecast period are those that can define a grade analytically, prove it on every lot, and hold that specification across seasons and harvest origins.
Aloe Vera Extract Industry Leaders
- Aloecorp, Inc.
- Terry Laboratories, LLC
- Lily of the Desert
- Houssy Global
- Natural Aloe de Costa Rica S.A.
Recent Industry Developments
- 2002: The US Food and Drug Administration finalised its rule removing aloe from the ingredients recognised as safe and effective for over-the-counter laxative use – redirecting the ingredient firmly toward food, cosmetic and supplement channels in that market.
- January 2018: The revised Novel Food Regulation of the European Union became applicable, introducing a centralised authorisation procedure and a Union list – setting the route certain aloe preparations must follow before they may be placed on the market.
- April 2021: The European Union prohibition on hydroxyanthracene derivatives in food, and on preparations from aloe leaf containing them, took effect – making decolourisation and aloin reduction a precondition for whole leaf material entering food in the region.
- October 2014: The Nagoya Protocol on access to genetic resources and benefit sharing entered into force – adding access and benefit-sharing documentation to sourcing from certain origins, a requirement covered more fully in the separate plant extracts study.
Companies Covered in the Report
- Aloecorp, Inc.
- Terry Laboratories, LLC
- Lily of the Desert
- Aloe Farms, Inc.
- Aloe Laboratories, Inc.
- Natural Aloe de Costa Rica S.A.
- Houssy Global
- Forever Living Products International, LLC
- Aloe Vera of America, Inc.
- Aloe Jaumave S.A. de C.V.
- Foodchem International Corporation
- Sabinsa Corporation
Aloe Vera Extract Market Report Scope
This study covers extracts and derivatives of Aloe barbadensis and related species, including inner leaf fillet, whole leaf extract, decolourised and aloin-reduced grades, concentrates, dried powders and polysaccharide-standardised fractions, sold into personal care, food and beverage, supplements, pharmaceutical and wound care formulations, and animal products. The wider plant extracts market is covered in a separate report. The base year is 2025, with a 2026 to 2033 forecast in US$ Billion.
| Metric | Value |
| Study Period | 2020–2033 |
| Market Size 2026 | US$ 1.1 Billion |
| Market Size 2033 | US$ 1.7 Billion |
| CAGR 2026–2033 | 6.4% |
| Absolute Dollar Opportunity | US$ 0.6 Billion |
| Largest Market | Asia Pacific (34% share in 2026) |
| Fastest-Growing Market | Latin America (7.6% CAGR 2026–2033) |
| Market Concentration | Low |
| Major Players | Aloecorp, Inc., Terry Laboratories, LLC, Lily of the Desert, Houssy Global, Natural Aloe de Costa Rica S.A. |
Product Form
- Liquid Gel and Juice
- Concentrate
- Spray-Dried Powder
- Freeze-Dried Powder
Extract Grade
- Inner Leaf Fillet
- Whole Leaf Extract
- Decolourised and Aloin-Reduced Grade
- Polysaccharide-Standardised Fraction
Application
- Personal Care and Cosmetics
- Food and Beverage
- Dietary Supplements
- Pharmaceutical and Wound Care Formulations
- Pet and Animal Products
Distribution Channel
- Direct Sales to Manufacturers
- Ingredient Distributors
- Online B2B Platforms
- Contract Processors
Regions
- North America
- Europe
- Asia Pacific
- Latin America
- Middle East & Africa
1. Executive Summary
1.1. Global Aloe Vera Extract Market Snapshot
1.2. Future Projections, 2026-2033
1.3. Key Market Trends
1.4. Regional Snapshot
2. Market Overview
2.1. Market Definition and Report Scope
2.2. Historical Market Trends, 2020-2025
2.3. Market Dynamics
2.3.1. Drivers Impact Analysis
2.3.1.1. Food Law Purification Requirements Shift Aloe Vera Extract Demand Toward Processed Grades
2.3.1.2. Authentication Requirements Push Buyers Toward Certified and Tested Aloe Vera Supply
2.3.2. Restraints Impact Analysis
2.3.2.1. Aloin Restrictions and Decolourisation Costs Narrow the Usable Aloe Vera Extract Supply Base
2.3.2.2. Crop Concentration and Commodity Gel Pricing Compress Margins Across Aloe Vera Extract Supply
2.3.3. Market Opportunities
2.3.3.1. Certified Aloin-Reduced Food Grades Open a Protected Revenue Pool for Qualified Processors
2.3.3.2. Cosmetic Actives and Standardised Polysaccharide Fractions Build a Higher-Value Product Tier
3. Global Aloe Vera Extract Market Outlook, 2020-2033
3.1. Global Aloe Vera Extract Market Outlook, by Product Form, Value (US$ Billion), 2020-2033
3.1.1. Liquid Gel and Juice
3.1.2. Concentrate
3.1.3. Spray-Dried Powder
3.1.4. Freeze-Dried Powder
3.2. Global Aloe Vera Extract Market Outlook, by Extract Grade, Value (US$ Billion), 2020-2033
3.2.1. Inner Leaf Fillet
3.2.2. Whole Leaf Extract
3.2.3. Decolourised and Aloin-Reduced Grade
3.2.4. Polysaccharide-Standardised Fraction
3.3. Global Aloe Vera Extract Market Outlook, by Application, Value (US$ Billion), 2020-2033
3.3.1. Personal Care and Cosmetics
3.3.2. Food and Beverage
3.3.3. Dietary Supplements
3.3.4. Pharmaceutical and Wound Care Formulations
3.3.5. Pet and Animal Products
3.4. Global Aloe Vera Extract Market Outlook, by Distribution Channel, Value (US$ Billion), 2020-2033
3.4.1. Direct Sales to Manufacturers
3.4.2. Ingredient Distributors
3.4.3. Online B2B Platforms
3.4.4. Contract Processors
3.5. Global Aloe Vera Extract Market Outlook, by Region, Value (US$ Billion), 2020-2033
3.5.1. North America
3.5.2. Europe
3.5.3. Asia Pacific
3.5.4. Latin America
3.5.5. Middle East & Africa
4. North America Aloe Vera Extract Market Outlook, 2020-2033
4.1. North America Aloe Vera Extract Market Outlook, by Product Form, Value (US$ Billion), 2020-2033
4.1.1. Liquid Gel and Juice
4.1.2. Concentrate
4.1.3. Spray-Dried Powder
4.1.4. Freeze-Dried Powder
4.2. North America Aloe Vera Extract Market Outlook, by Extract Grade, Value (US$ Billion), 2020-2033
4.2.1. Inner Leaf Fillet
4.2.2. Whole Leaf Extract
4.2.3. Decolourised and Aloin-Reduced Grade
4.2.4. Polysaccharide-Standardised Fraction
4.3. North America Aloe Vera Extract Market Outlook, by Application, Value (US$ Billion), 2020-2033
4.3.1. Personal Care and Cosmetics
4.3.2. Food and Beverage
4.3.3. Dietary Supplements
4.3.4. Pharmaceutical and Wound Care Formulations
4.3.5. Pet and Animal Products
4.4. North America Aloe Vera Extract Market Outlook, by Distribution Channel, Value (US$ Billion), 2020-2033
4.4.1. Direct Sales to Manufacturers
4.4.2. Ingredient Distributors
4.4.3. Online B2B Platforms
4.4.4. Contract Processors
4.5. North America Aloe Vera Extract Market Outlook, by Country, Value (US$ Billion), 2020-2033
4.5.1. United States Aloe Vera Extract Market Outlook, by Product Form, 2020-2033
4.5.2. United States Aloe Vera Extract Market Outlook, by Extract Grade, 2020-2033
4.5.3. United States Aloe Vera Extract Market Outlook, by Application, 2020-2033
4.5.4. United States Aloe Vera Extract Market Outlook, by Distribution Channel, 2020-2033
4.5.5. Canada Aloe Vera Extract Market Outlook, by Product Form, 2020-2033
4.5.6. Canada Aloe Vera Extract Market Outlook, by Extract Grade, 2020-2033
4.5.7. Canada Aloe Vera Extract Market Outlook, by Application, 2020-2033
4.5.8. Canada Aloe Vera Extract Market Outlook, by Distribution Channel, 2020-2033
5. Europe Aloe Vera Extract Market Outlook, 2020-2033
5.1. Europe Aloe Vera Extract Market Outlook, by Product Form, Value (US$ Billion), 2020-2033
5.1.1. Liquid Gel and Juice
5.1.2. Concentrate
5.1.3. Spray-Dried Powder
5.1.4. Freeze-Dried Powder
5.2. Europe Aloe Vera Extract Market Outlook, by Extract Grade, Value (US$ Billion), 2020-2033
5.2.1. Inner Leaf Fillet
5.2.2. Whole Leaf Extract
5.2.3. Decolourised and Aloin-Reduced Grade
5.2.4. Polysaccharide-Standardised Fraction
5.3. Europe Aloe Vera Extract Market Outlook, by Application, Value (US$ Billion), 2020-2033
5.3.1. Personal Care and Cosmetics
5.3.2. Food and Beverage
5.3.3. Dietary Supplements
5.3.4. Pharmaceutical and Wound Care Formulations
5.3.5. Pet and Animal Products
5.4. Europe Aloe Vera Extract Market Outlook, by Distribution Channel, Value (US$ Billion), 2020-2033
5.4.1. Direct Sales to Manufacturers
5.4.2. Ingredient Distributors
5.4.3. Online B2B Platforms
5.4.4. Contract Processors
5.5. Europe Aloe Vera Extract Market Outlook, by Country, Value (US$ Billion), 2020-2033
5.5.1. Germany Aloe Vera Extract Market Outlook, by Product Form, 2020-2033
5.5.2. Germany Aloe Vera Extract Market Outlook, by Extract Grade, 2020-2033
5.5.3. Germany Aloe Vera Extract Market Outlook, by Application, 2020-2033
5.5.4. Germany Aloe Vera Extract Market Outlook, by Distribution Channel, 2020-2033
5.5.5. France Aloe Vera Extract Market Outlook, by Product Form, 2020-2033
5.5.6. France Aloe Vera Extract Market Outlook, by Extract Grade, 2020-2033
5.5.7. France Aloe Vera Extract Market Outlook, by Application, 2020-2033
5.5.8. France Aloe Vera Extract Market Outlook, by Distribution Channel, 2020-2033
5.5.9. Italy Aloe Vera Extract Market Outlook, by Product Form, 2020-2033
5.5.10. Italy Aloe Vera Extract Market Outlook, by Extract Grade, 2020-2033
5.5.11. Italy Aloe Vera Extract Market Outlook, by Application, 2020-2033
5.5.12. Italy Aloe Vera Extract Market Outlook, by Distribution Channel, 2020-2033
5.5.13. Spain Aloe Vera Extract Market Outlook, by Product Form, 2020-2033
5.5.14. Spain Aloe Vera Extract Market Outlook, by Extract Grade, 2020-2033
5.5.15. Spain Aloe Vera Extract Market Outlook, by Application, 2020-2033
5.5.16. Spain Aloe Vera Extract Market Outlook, by Distribution Channel, 2020-2033
5.5.17. United Kingdom Aloe Vera Extract Market Outlook, by Product Form, 2020-2033
5.5.18. United Kingdom Aloe Vera Extract Market Outlook, by Extract Grade, 2020-2033
5.5.19. United Kingdom Aloe Vera Extract Market Outlook, by Application, 2020-2033
5.5.20. United Kingdom Aloe Vera Extract Market Outlook, by Distribution Channel, 2020-2033
6. Asia Pacific Aloe Vera Extract Market Outlook, 2020-2033
6.1. Asia Pacific Aloe Vera Extract Market Outlook, by Product Form, Value (US$ Billion), 2020-2033
6.1.1. Liquid Gel and Juice
6.1.2. Concentrate
6.1.3. Spray-Dried Powder
6.1.4. Freeze-Dried Powder
6.2. Asia Pacific Aloe Vera Extract Market Outlook, by Extract Grade, Value (US$ Billion), 2020-2033
6.2.1. Inner Leaf Fillet
6.2.2. Whole Leaf Extract
6.2.3. Decolourised and Aloin-Reduced Grade
6.2.4. Polysaccharide-Standardised Fraction
6.3. Asia Pacific Aloe Vera Extract Market Outlook, by Application, Value (US$ Billion), 2020-2033
6.3.1. Personal Care and Cosmetics
6.3.2. Food and Beverage
6.3.3. Dietary Supplements
6.3.4. Pharmaceutical and Wound Care Formulations
6.3.5. Pet and Animal Products
6.4. Asia Pacific Aloe Vera Extract Market Outlook, by Distribution Channel, Value (US$ Billion), 2020-2033
6.4.1. Direct Sales to Manufacturers
6.4.2. Ingredient Distributors
6.4.3. Online B2B Platforms
6.4.4. Contract Processors
6.5. Asia Pacific Aloe Vera Extract Market Outlook, by Country, Value (US$ Billion), 2020-2033
6.5.1. South Korea Aloe Vera Extract Market Outlook, by Product Form, 2020-2033
6.5.2. South Korea Aloe Vera Extract Market Outlook, by Extract Grade, 2020-2033
6.5.3. South Korea Aloe Vera Extract Market Outlook, by Application, 2020-2033
6.5.4. South Korea Aloe Vera Extract Market Outlook, by Distribution Channel, 2020-2033
6.5.5. Japan Aloe Vera Extract Market Outlook, by Product Form, 2020-2033
6.5.6. Japan Aloe Vera Extract Market Outlook, by Extract Grade, 2020-2033
6.5.7. Japan Aloe Vera Extract Market Outlook, by Application, 2020-2033
6.5.8. Japan Aloe Vera Extract Market Outlook, by Distribution Channel, 2020-2033
6.5.9. China Aloe Vera Extract Market Outlook, by Product Form, 2020-2033
6.5.10. China Aloe Vera Extract Market Outlook, by Extract Grade, 2020-2033
6.5.11. China Aloe Vera Extract Market Outlook, by Application, 2020-2033
6.5.12. China Aloe Vera Extract Market Outlook, by Distribution Channel, 2020-2033
6.5.13. India Aloe Vera Extract Market Outlook, by Product Form, 2020-2033
6.5.14. India Aloe Vera Extract Market Outlook, by Extract Grade, 2020-2033
6.5.15. India Aloe Vera Extract Market Outlook, by Application, 2020-2033
6.5.16. India Aloe Vera Extract Market Outlook, by Distribution Channel, 2020-2033
6.5.17. Thailand Aloe Vera Extract Market Outlook, by Product Form, 2020-2033
6.5.18. Thailand Aloe Vera Extract Market Outlook, by Extract Grade, 2020-2033
6.5.19. Thailand Aloe Vera Extract Market Outlook, by Application, 2020-2033
6.5.20. Thailand Aloe Vera Extract Market Outlook, by Distribution Channel, 2020-2033
6.5.21. Indonesia Aloe Vera Extract Market Outlook, by Product Form, 2020-2033
6.5.22. Indonesia Aloe Vera Extract Market Outlook, by Extract Grade, 2020-2033
6.5.23. Indonesia Aloe Vera Extract Market Outlook, by Application, 2020-2033
6.5.24. Indonesia Aloe Vera Extract Market Outlook, by Distribution Channel, 2020-2033
6.5.25. Australia Aloe Vera Extract Market Outlook, by Product Form, 2020-2033
6.5.26. Australia Aloe Vera Extract Market Outlook, by Extract Grade, 2020-2033
6.5.27. Australia Aloe Vera Extract Market Outlook, by Application, 2020-2033
6.5.28. Australia Aloe Vera Extract Market Outlook, by Distribution Channel, 2020-2033
7. Latin America Aloe Vera Extract Market Outlook, 2020-2033
7.1. Latin America Aloe Vera Extract Market Outlook, by Product Form, Value (US$ Billion), 2020-2033
7.1.1. Liquid Gel and Juice
7.1.2. Concentrate
7.1.3. Spray-Dried Powder
7.1.4. Freeze-Dried Powder
7.2. Latin America Aloe Vera Extract Market Outlook, by Extract Grade, Value (US$ Billion), 2020-2033
7.2.1. Inner Leaf Fillet
7.2.2. Whole Leaf Extract
7.2.3. Decolourised and Aloin-Reduced Grade
7.2.4. Polysaccharide-Standardised Fraction
7.3. Latin America Aloe Vera Extract Market Outlook, by Application, Value (US$ Billion), 2020-2033
7.3.1. Personal Care and Cosmetics
7.3.2. Food and Beverage
7.3.3. Dietary Supplements
7.3.4. Pharmaceutical and Wound Care Formulations
7.3.5. Pet and Animal Products
7.4. Latin America Aloe Vera Extract Market Outlook, by Distribution Channel, Value (US$ Billion), 2020-2033
7.4.1. Direct Sales to Manufacturers
7.4.2. Ingredient Distributors
7.4.3. Online B2B Platforms
7.4.4. Contract Processors
7.5. Latin America Aloe Vera Extract Market Outlook, by Country, Value (US$ Billion), 2020-2033
7.5.1. Mexico Aloe Vera Extract Market Outlook, by Product Form, 2020-2033
7.5.2. Mexico Aloe Vera Extract Market Outlook, by Extract Grade, 2020-2033
7.5.3. Mexico Aloe Vera Extract Market Outlook, by Application, 2020-2033
7.5.4. Mexico Aloe Vera Extract Market Outlook, by Distribution Channel, 2020-2033
7.5.5. Dominican Republic Aloe Vera Extract Market Outlook, by Product Form, 2020-2033
7.5.6. Dominican Republic Aloe Vera Extract Market Outlook, by Extract Grade, 2020-2033
7.5.7. Dominican Republic Aloe Vera Extract Market Outlook, by Application, 2020-2033
7.5.8. Dominican Republic Aloe Vera Extract Market Outlook, by Distribution Channel, 2020-2033
7.5.9. Costa Rica Aloe Vera Extract Market Outlook, by Product Form, 2020-2033
7.5.10. Costa Rica Aloe Vera Extract Market Outlook, by Extract Grade, 2020-2033
7.5.11. Costa Rica Aloe Vera Extract Market Outlook, by Application, 2020-2033
7.5.12. Costa Rica Aloe Vera Extract Market Outlook, by Distribution Channel, 2020-2033
7.5.13. Brazil Aloe Vera Extract Market Outlook, by Product Form, 2020-2033
7.5.14. Brazil Aloe Vera Extract Market Outlook, by Extract Grade, 2020-2033
7.5.15. Brazil Aloe Vera Extract Market Outlook, by Application, 2020-2033
7.5.16. Brazil Aloe Vera Extract Market Outlook, by Distribution Channel, 2020-2033
8. Middle East & Africa Aloe Vera Extract Market Outlook, 2020-2033
8.1. Middle East & Africa Aloe Vera Extract Market Outlook, by Product Form, Value (US$ Billion), 2020-2033
8.1.1. Liquid Gel and Juice
8.1.2. Concentrate
8.1.3. Spray-Dried Powder
8.1.4. Freeze-Dried Powder
8.2. Middle East & Africa Aloe Vera Extract Market Outlook, by Extract Grade, Value (US$ Billion), 2020-2033
8.2.1. Inner Leaf Fillet
8.2.2. Whole Leaf Extract
8.2.3. Decolourised and Aloin-Reduced Grade
8.2.4. Polysaccharide-Standardised Fraction
8.3. Middle East & Africa Aloe Vera Extract Market Outlook, by Application, Value (US$ Billion), 2020-2033
8.3.1. Personal Care and Cosmetics
8.3.2. Food and Beverage
8.3.3. Dietary Supplements
8.3.4. Pharmaceutical and Wound Care Formulations
8.3.5. Pet and Animal Products
8.4. Middle East & Africa Aloe Vera Extract Market Outlook, by Distribution Channel, Value (US$ Billion), 2020-2033
8.4.1. Direct Sales to Manufacturers
8.4.2. Ingredient Distributors
8.4.3. Online B2B Platforms
8.4.4. Contract Processors
8.5. Middle East & Africa Aloe Vera Extract Market Outlook, by Country and Subregion, Value (US$ Billion), 2020-2033
8.5.1. Kenya Aloe Vera Extract Market Outlook, by Product Form, 2020-2033
8.5.2. Kenya Aloe Vera Extract Market Outlook, by Extract Grade, 2020-2033
8.5.3. Kenya Aloe Vera Extract Market Outlook, by Application, 2020-2033
8.5.4. Kenya Aloe Vera Extract Market Outlook, by Distribution Channel, 2020-2033
8.5.5. Tanzania Aloe Vera Extract Market Outlook, by Product Form, 2020-2033
8.5.6. Tanzania Aloe Vera Extract Market Outlook, by Extract Grade, 2020-2033
8.5.7. Tanzania Aloe Vera Extract Market Outlook, by Application, 2020-2033
8.5.8. Tanzania Aloe Vera Extract Market Outlook, by Distribution Channel, 2020-2033
8.5.9. Nigeria Aloe Vera Extract Market Outlook, by Product Form, 2020-2033
8.5.10. Nigeria Aloe Vera Extract Market Outlook, by Extract Grade, 2020-2033
8.5.11. Nigeria Aloe Vera Extract Market Outlook, by Application, 2020-2033
8.5.12. Nigeria Aloe Vera Extract Market Outlook, by Distribution Channel, 2020-2033
8.5.13. Ethiopia Aloe Vera Extract Market Outlook, by Product Form, 2020-2033
8.5.14. Ethiopia Aloe Vera Extract Market Outlook, by Extract Grade, 2020-2033
8.5.15. Ethiopia Aloe Vera Extract Market Outlook, by Application, 2020-2033
8.5.16. Ethiopia Aloe Vera Extract Market Outlook, by Distribution Channel, 2020-2033
8.5.17. South Africa Aloe Vera Extract Market Outlook, by Product Form, 2020-2033
8.5.18. South Africa Aloe Vera Extract Market Outlook, by Extract Grade, 2020-2033
8.5.19. South Africa Aloe Vera Extract Market Outlook, by Application, 2020-2033
8.5.20. South Africa Aloe Vera Extract Market Outlook, by Distribution Channel, 2020-2033
8.5.21. Gulf Cooperation Council Aloe Vera Extract Market Outlook, by Product Form, 2020-2033
8.5.22. Gulf Cooperation Council Aloe Vera Extract Market Outlook, by Extract Grade, 2020-2033
8.5.23. Gulf Cooperation Council Aloe Vera Extract Market Outlook, by Application, 2020-2033
8.5.24. Gulf Cooperation Council Aloe Vera Extract Market Outlook, by Distribution Channel, 2020-2033
8.5.25. Saudi Arabia Aloe Vera Extract Market Outlook, by Product Form, 2020-2033
8.5.26. Saudi Arabia Aloe Vera Extract Market Outlook, by Extract Grade, 2020-2033
8.5.27. Saudi Arabia Aloe Vera Extract Market Outlook, by Application, 2020-2033
8.5.28. Saudi Arabia Aloe Vera Extract Market Outlook, by Distribution Channel, 2020-2033
8.5.29. United Arab Emirates Aloe Vera Extract Market Outlook, by Product Form, 2020-2033
8.5.30. United Arab Emirates Aloe Vera Extract Market Outlook, by Extract Grade, 2020-2033
8.5.31. United Arab Emirates Aloe Vera Extract Market Outlook, by Application, 2020-2033
8.5.32. United Arab Emirates Aloe Vera Extract Market Outlook, by Distribution Channel, 2020-2033
9. Competitive Landscape
9.1. Market Concentration and Industry Leaders
9.2. Competitive Differentiation
9.3. Strategic Initiatives
9.4. Recent Industry Developments
9.5. Company Profiles
9.5.1. Aloecorp, Inc.
9.5.2. Terry Laboratories, LLC
9.5.3. Lily of the Desert
9.5.4. Aloe Farms, Inc.
9.5.5. Aloe Laboratories, Inc.
9.5.6. Natural Aloe de Costa Rica S.A.
9.5.7. Houssy Global
9.5.8. Forever Living Products International, LLC
9.5.9. Aloe Vera of America, Inc.
9.5.10. Aloe Jaumave S.A. de C.V.
9.5.11. Foodchem International Corporation
9.5.12. Sabinsa Corporation
10. Appendix
10.1. Research Methodology
10.2. Report Assumptions
10.3. Acronyms and Abbreviations
| Segment | Categories |
|---|---|
| Product Form | Liquid Gel and Juice, Concentrate, Spray-Dried Powder, Freeze-Dried Powder |
| Extract Grade | Inner Leaf Fillet, Whole Leaf Extract, Decolourised and Aloin-Reduced Grade, Polysaccharide-Standardised Fraction |
| Application | Personal Care and Cosmetics, Food and Beverage, Dietary Supplements, Pharmaceutical and Wound Care Formulations, Pet and Animal Products |
| Distribution Channel | Direct Sales to Manufacturers, Ingredient Distributors, Online B2B Platforms, Contract Processors |
| Regions | North America, Europe, Asia Pacific, Latin America, Middle East & Africa |
Our Research Methodology
Considering the volatility of business today, traditional approaches to strategizing a game plan can be unfruitful if not detrimental. True ambiguity is no way to determine a forecast. A myriad of predetermined factors must be accounted for such as the degree of risk involved, the magnitude of circumstances, as well as conditions or consequences that are not known or unpredictable. To circumvent binary views that cast uncertainty, the application of market research intelligence to strategically posture, move, and enable actionable outcomes is necessary.
View Methodology
Quality Assured
Rigorous Validation Process

Confidentiality Assured
End-to-end Data Security

Custom Research Services
Tailored To Your Objectives
FAQs
The market is valued at US$ 1.1 billion in 2026, covering extracts, concentrates, powders and standardised fractions sold to manufacturers.
The market is projected to reach US$ 1.7 billion by 2033, a 6.4% CAGR and an absolute dollar opportunity of US$ 0.6 billion.
Inner Leaf Fillet leads with 46% share in 2026, because excluding the latex layer simplifies qualification for regulated food customers.
Latin America grows fastest at a 7.6% CAGR through 2033, as processors in producing origins move downstream into filleting and drying.
Concentration is low: many growers and small processors compete, while a smaller group of integrated, certified processors serves regulated buyers.
Related Reports
Baby Car Seat Market Size, Share, Insights, Competitive Landscape, and Forecast 2026 to 2033
The baby car seat market is forecast to grow from US$ 6.12 billion in 2026 to US$ 10.09 billion by 2033 at a 7.4% CAGR.
Household Cooking Appliance Market Size, Share, Insights, Competitive Landscape, and Forecast 2026 to 2033
Household cooking appliance market to reach US$ 580.24 billion by 2033 from US$ 366.11 billion in 2026 at a 6.8% CAGR. Explore products and regional trends.
Toilet Paper Market Size, Share, Insights, Competitive Landscape, and Forecast 2026 to 2033
The global toilet paper market is valued at US$54.27 billion in 2026, reaching US$67.98 billion by 2033, growing at a 3.27% CAGR
Vertical Garden Construction Market Size, Share, Insights, Competitive Landscape, and Forecast 2026 to 2033
The global vertical garden construction market is valued at US$1.28 billion in 2026, reaching US$2.26 billion by 2033, growing at an 8.5% CAGR
Zero Gravity Entertainment Market Size, Share, Insights, Competitive Landscape, and Forecast 2026 to 2033
Zero gravity entertainment market to grow from US$ 0.3 billion in 2026 to US$ 0.8 billion by 2033 at a 15.0% CAGR. Explore experiences, channels and regions.
Veterinary Wearable Devices Market Size, Share, Insights, Competitive Landscape, and Forecast 2026 to 2033
The veterinary wearable devices market is projected to grow from US$3.10 billion in 2026 to US$7.69 billion by 2033, at a 13.9% CAGR, led by pet and herd monitoring.