



Automated Mooring Systems Market
Automated Mooring Systems Market Size, Share, Insights, Competitive Landscape, and Forecast 2026 to 2033
Automated Mooring Systems Market Size and Trend Analysis
How Fast Will Automated Mooring Systems Grow Through 2033?
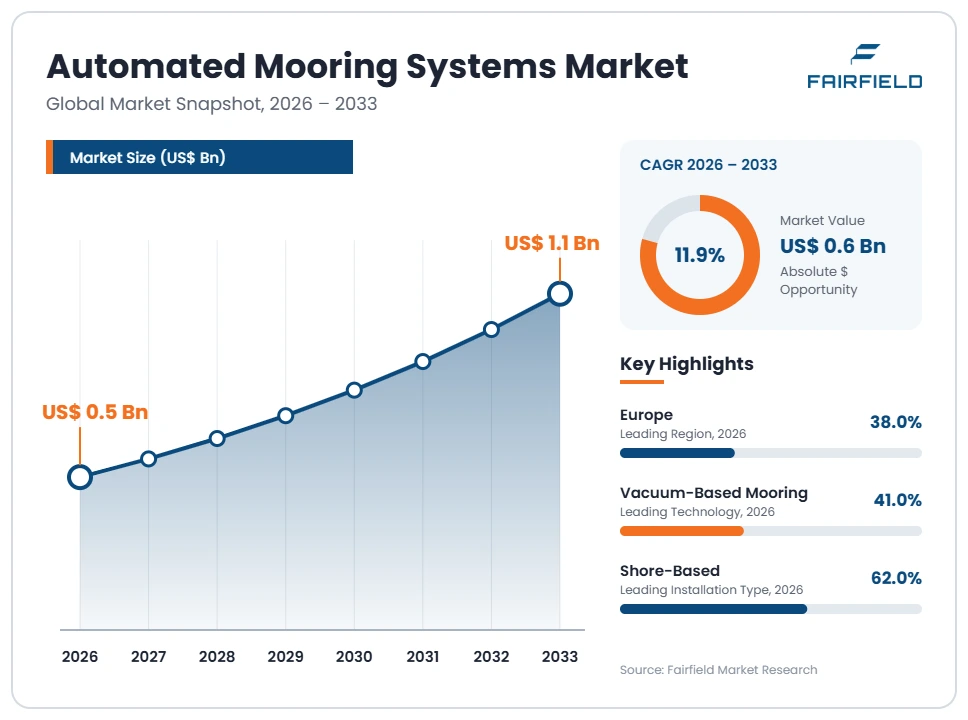
The global automated mooring systems market size is expected to be valued at US$ 0.5 billion in 2026 and projected to reach US$ 1.1 billion by 2033, growing at a CAGR of 11.9% between 2026 and 2033.
In precise terms, the market is estimated at US$ 500 million in 2026 and US$ 1,100 million by 2033. Between 2020 and 2025 the sector expanded at roughly 8.2% annually, held back by pandemic-era capital deferrals at ports. Three factors now drive faster growth. First, mooring line failure remains a documented cause of serious crew injury, pushing terminals toward rope-free berthing. Second, the SOLAS chapter II-1 regulation 3-8 amendments have made mooring arrangement design a formal safety obligation. Third, shore power connections require stable, repeatable berthing. The direction is a shift from pilot installations at ferry berths toward programmed rollouts across container, bulk and lock infrastructure.
Key Report Takeaways
- By Technology: Vacuum-based mooring held 41% share in 2026, while magnetic mooring is projected to expand at a 14.8% CAGR through 2033, driven by its ability to grip uncoated and coated hull plating without a sealed contact surface.
- By Installation Type: Shore-based systems held 62% share in 2026, while vessel-based systems are projected to expand at a 14.2% CAGR through 2033, as owners specify onboard units for berths that cannot be modified.
- By Application: Ferry and ro-ro berths held 33% share in 2026, while ship-to-ship transfer and offshore installations are projected to grow at a 15.3% CAGR through 2033, reflecting demand for safe transfer in open-water swell conditions.
- By Offering: Equipment held 58% share in 2026, while software and load monitoring is projected to expand at a 16.2% CAGR through 2033, as terminal operators buy berth analytics alongside the hardware.
- By Geography: Europe held 38% share in 2026, while Asia Pacific is projected to grow at a 14.9% CAGR through 2033, supported by new container terminal construction and ferry fleet renewal.
Global Automated Mooring Systems Market Trends and Insights
Drivers Impact Analysis
Two demand forces account for most of the forecast growth in rope-free berthing equipment.
| Driver | Impact on CAGR Forecast | Geographic Relevance | Impact Timeline |
| Mandatory mooring safety rules under SOLAS regulation 3-8 | High | Global, strongest in Europe and North America | Medium term (2–4 years) |
| Shore power programmes requiring repeatable berthing accuracy | High | Europe, North America, Asia Pacific | Long term (≥4 years) |
Mooring Injury Prevention Rules Are Making Rope-Free Berthing a Compliance Purchase
Safety regulation has converted automated mooring from an efficiency option into a compliance purchase at high-risk berths. Snap-back from a parted mooring line remains one of the most frequently recorded causes of serious deck injury, and terminals that remove line handlers from the snap-back zone remove the hazard entirely. Port authorities and terminal operators increasingly write rope-free berthing into berth safety cases for ferry, lock and exposed-berth operations.
The mechanism is regulatory. SOLAS chapter II-1 regulation 3-8, as amended, requires mooring arrangements to be designed, selected and maintained to a defined safe working standard for ships built from the start of 2024, supported by IMO guidelines on mooring arrangement design and equipment selection. The OCIMF Mooring Equipment Guidelines fourth edition reset expectations on line management and inspection, raising the recorded cost of conventional mooring and improving the business case for automation.
Shore Power Mandates Are Tying Automated Mooring to Berth Electrification Budgets
Berth electrification is pulling automated mooring into projects it would not otherwise reach. Onshore power supply connections need the vessel held in a tight, repeatable position so that cable handling equipment can mate safely and stay mated through tide and passing-ship surge. Ports therefore specify automated mooring and shore power together, which moves the equipment from an operations budget into a larger funded infrastructure programme.
The driver is policy. The European Union Alternative Fuels Infrastructure Regulation requires shore power provision for container and passenger ships at core network ports, and FuelEU Maritime obliges those ships to connect at quay. Terminal operators responding to these obligations are rebuilding berth furniture anyway, so the incremental cost of vacuum pads or magnetic units installed during the same civil works is far lower than a standalone retrofit.
Restraints Impact Analysis
Two constraints hold back conversion of interest into installed berths.
| Restraint | Impact on CAGR Forecast | Geographic Relevance | Impact Timeline |
| Capital cost per berth and civil works for quay-mounted units | High | Latin America, Middle East & Africa, Asia Pacific | Medium term (2–4 years) |
| Vessel-side compatibility and mixed-call berth traffic | Medium | Global | Long term (≥4 years) |
Per-Berth Capital Cost and Quay Reconstruction Slow Automated Mooring Adoption
Cost per berth is the single largest brake on adoption, especially at publicly funded ports working to multi-year budget cycles. The spend is not only the mooring unit. It includes quay-face strengthening, rail or plinth foundations, power supply, control room integration and a berth closure of several weeks, which carries lost throughput that terminal finance teams count against the project.
The underlying cause is civil, not mechanical. Many working quays were built for bollards and fenders, not for units that transfer large horizontal holding loads into the quay wall at a single point. Structural assessment often shows that the existing wall cannot accept those loads without piling or capping beam reinforcement. On tidal berths, vertical travel rails add further structure. These items frequently exceed the equipment price, and disruption at a congested quay is harder to justify than the hardware itself.
Mixed Vessel Calls and Hull Compatibility Limit Automated Mooring at Common-User Berths
Compatibility limits where the technology can be deployed. A system that works perfectly on a scheduled ferry becomes difficult at a common-user berth that receives different hull forms, freeboards and fender arrangements on consecutive calls. If a meaningful share of calls cannot be held automatically, the terminal must keep conventional lines, handlers and training in place, which erodes the savings that justified the purchase.
The technical cause sits on the vessel side. Vacuum systems need a reasonably flat, clean contact area within the pad’s vertical travel range, and heavily curved, strake-interrupted or ice-belt hulls reduce achievable grip. Magnetic systems depend on plate thickness and coating. Freeboard variation between a laden bulk carrier and a ballasted one can exceed the equipment envelope. Without fleet-wide hull interface standards, each berth needs its own compatibility study before specification.
Market Opportunities
Two revenue pools sit outside the traditional ferry-berth installed base.
Retrofit of Locks and Inland Waterway Infrastructure Opens a Public-Works Revenue Pool
Locks and inland waterway structures represent an underserved revenue pool distinct from seaport demand. Lock chambers see repeated line handling under turbulent filling conditions, with high injury exposure and long cycle times. Automated vacuum or magnetic restraint cuts lock cycle time and removes personnel from chamber walls, and because lock authorities procure as public infrastructure, projects are funded through renewal programmes rather than commercial port budgets.
Waterway authorities and inland navigation agencies in Europe and North America are the buyers, with barge and short-sea operators as the beneficiary user group. Lock modernisation programmes and inland waterway renewal budgets support the spend, and standardised chamber geometry makes the engineering repeatable across many sites. That repeatability lets suppliers sell a configured product rather than a bespoke project, which improves margin and shortens delivery schedules materially.
Load Monitoring Software and Berth Analytics Create a Recurring Revenue Layer
Integrated load monitoring turns a one-time equipment sale into recurring revenue. Automated mooring arms and hooks already measure holding force continuously, and that data supports passing-ship surge alarms, berth occupancy analytics, predictive maintenance and insurance evidence. Sold as a subscription with remote diagnostics, this layer carries higher margins than steelwork and renews independently of the capital replacement cycle.
Equipment suppliers and port technology integrators can capture it, with terminal operations managers and port authority harbour masters as the paying customer group. Digital port programmes and berth productivity targets create the demand, since operators already fund terminal operating systems and want mooring data inside them. Mooring load records also support compliance evidence under OCIMF guidance and classification requirements, which makes the subscription easier to defend at budget review each year.
Segment Analysis
- By Technology: Vacuum-Based Units Lead While Magnetic Mooring Gains Momentum
Vacuum-based mooring holds 41% of the automated mooring systems market in 2026, the largest technology share. Its lead reflects the longest field record at ferry and ro-ro berths, where repeat calls by known hulls suit pad-based attachment, and where operators have accumulated a decade of reliability data. Magnetic mooring is the fastest-growing technology at a 14.8% CAGR through 2033. Magnets tolerate wet, pitted and coated plating that defeats a vacuum seal, and they attach without a defined flat contact patch, which widens the range of callable vessels. Automated mooring arms and hooks with integrated load monitoring remain the standard choice where holding loads are very high, such as tanker and bulk berths. Automated winch and line-handling equipment serves ports that want reduced manning without removing lines. The practical implication is that suppliers now need more than one attachment physics in their catalogue.
- By Installation Type: Shore-Based Systems Dominate as Vessel-Based Units Scale Quickly
Shore-based, quay-mounted equipment accounts for 62% of installations in 2026. Terminals prefer it because one investment serves every vessel that calls, maintenance stays ashore, and the system is under the operator’s direct control. Vessel-based systems are expanding fastest at a 14.2% CAGR. Shipowners specify onboard units when they serve berths that cannot be rebuilt, including island ferry ramps, remote jetties and offshore structures, and a single vessel-mounted system travels the whole route network. Floating and pontoon-mounted arrangements occupy a smaller niche at locations with extreme tidal range or temporary berths. The shift matters commercially because it moves part of the buying decision from port authorities to shipowners and ferry operators, which changes the sales cycle, the financing route and the warranty structure suppliers must offer.
- By Application: Ferry and Ro-Ro Berths Lead With Offshore Transfer Rising Sharply
Ferry and ro-ro berths represent 33% of demand in 2026, the leading application. Short turnarounds, many daily calls and consistent hull geometry give these berths the clearest payback, since seconds saved per call compound across a timetable. Ship-to-ship transfer and offshore installations form the fastest-growing application at a 15.3% CAGR through 2033, because holding two moving hulls alongside in open-water swell is exactly where conventional lines perform worst and where crew exposure is highest. Container terminals are a substantial second application, driven by berth productivity targets and passing-ship surge control on long quays. Bulk and general cargo terminals adopt more slowly, given draught-driven freeboard variation. Locks and inland waterways are small but strategically useful, as public funding there is less sensitive to commercial payback periods.
- By Offering: Equipment Sales Lead While Software and Load Monitoring Expands Fastest
Equipment accounts for 58% of market value in 2026, reflecting the capital intensity of mooring hardware, hydraulics, rails and control cabinets. Software and load monitoring is the fastest-expanding offering at a 16.2% CAGR through 2033. Terminals are buying continuous holding-force measurement, surge alerting and maintenance analytics as a subscription, which converts an episodic equipment relationship into an annual one. Installation and integration remains a sizeable line item because quay civil works, power provision and terminal operating system interfaces are rarely trivial. Maintenance and service contracts grow steadily as the installed base ages and operators seek guaranteed availability at berths with no manual fallback. For vendors, the business implication is a gradual revenue mix shift toward services, which smooths the lumpy order intake that characterises port equipment markets.
Geography Analysis
- North America Advances Through Port Safety Programmes and Lock Modernisation
North America holds 21% of the automated mooring systems market in 2026, the second-largest regional position. The United States and Canada drive demand through ferry operators on the Pacific and Atlantic coasts, Great Lakes terminals and inland lock renewal programmes. The United States Coast Guard and port authority safety requirements addressing mooring line failure have raised scrutiny of manual line handling at passenger terminals. Cruise berths in Florida and Alaska are adopting assisted berthing to shorten turnarounds. The principal barrier is split ownership between port authorities and terminal lessees, which complicates who funds quay modification. The clearest regional opportunity lies in pairing automated mooring with shore power projects at container and cruise berths, where both systems need the same berthing precision and can share one civil works package.
- Which Region Is Leading the Automated Mooring Systems Market?
Europe leads the automated mooring systems market with 38% share in 2026, the largest regional position worldwide. Norway, the Netherlands, the United Kingdom, Denmark and Sweden account for most installations, built on dense short-sea ferry networks with high call frequency. Regional policy is decisive. The Alternative Fuels Infrastructure Regulation and FuelEU Maritime together require shore power at core network ports and connection by container and passenger ships, and that precision berthing requirement travels with every electrification project. Battery and hybrid ferry fleets in Norwegian fjord services depend on fast, repeatable connection at each call. Strict national occupational safety enforcement around mooring operations reinforces the case. The key regional change ahead is movement from single demonstration berths to port-wide rollouts specified in multi-berth tenders rather than one-off pilots.
- Which Region Is Growing Fastest in the Automated Mooring Systems Market?
Asia Pacific is growing fastest in the automated mooring systems market, at a 14.9% CAGR between 2026 and 2033 from a 27% share in 2026. China, Japan, South Korea, Singapore and Australia lead the expansion. New container terminal construction allows automated mooring to be designed into the quay from the outset, avoiding the retrofit cost that slows mature ports. Japan and South Korea are renewing coastal ferry fleets with vessels specified for assisted berthing. Singapore is building large automated terminal capacity where berth productivity targets justify surge control on long quays. Australian bulk and LNG export jetties face exposed-berth conditions that suit arm-based systems with load monitoring. The regional change to watch is local manufacture of mooring hardware, which will lower delivered cost across the region.
- Latin America Builds Early Demand at Exposed Bulk and Ferry Berths
Latin America accounts for 5% of the market in 2026, an emerging position with concentrated pockets of demand. Brazil, Chile, Mexico and Panama lead adoption. Exposed Pacific coast terminals in Chile and Peru suffer swell-driven downtime and ranging that conventional lines handle poorly, which makes automated restraint technically compelling at mineral and fishmeal berths. Brazilian iron ore and grain terminals are evaluating systems to cut berth downtime in long-period swell. The main barriers are financing cost, limited local service capability and a port concession structure that discourages lessees from investing in fixed assets they do not own. The clearest opportunity is specifying automated mooring inside new concession agreements, which places the cost in the project financing rather than the annual operating budget.
- Middle East & Africa Growth Tracks Energy Export Jetty Investment
Middle East & Africa holds 9% of the market in 2026 and grows steadily through 2033. Saudi Arabia, the United Arab Emirates, Qatar, Egypt and South Africa account for most activity. Demand is dominated by energy export infrastructure, where tanker and gas jetties use automated mooring arms with integrated load monitoring and quick-release hooks to manage very large holding loads and emergency release. New industrial port developments on the Red Sea and Arabian Gulf are specifying these systems at the design stage. The key barriers are a thin regional service and spares network, high ambient temperature and dust loading on hydraulic equipment, and limited trained maintenance staff. The main opportunity is container transhipment hub expansion in the region, which extends demand beyond hydrocarbon jetties into commercial box terminals.
Competitive Landscape
The automated mooring systems market is moderately concentrated. A small group of specialist suppliers holds most installed berths, because the technology demands marine engineering, control systems and port civil experience in one organisation, and because reference installations matter more than price in a safety-critical purchase. Cavotec SA and Trelleborg AB are the most visible in vacuum and arm-based berthing respectively, while Mampaey Offshore Industries is strongly associated with automated hooks and quick-release systems. MacGregor and Kongsberg Maritime bring deck machinery and vessel automation positions. Below this tier sits a longer list of regional deck equipment makers competing on winches and line handling.
Competition turns on holding force at defined berth conditions, mean time between failures, release time in an emergency, compatibility across the vessel mix that actually calls, and the quality of the service network near the port. Reference berths and independent reliability data carry more weight than catalogue specifications. New entrants arrive from two directions: magnetic technology developers offering wider hull tolerance, and shore power and terminal automation integrators that bundle mooring into a single berth contract.
Strategic activity concentrates on widening the addressable berth base rather than deepening the ferry niche. Suppliers are extending product ranges across vacuum, magnetic and arm-based attachment so one vendor can answer any berth brief. They are adding load monitoring and remote diagnostics to create recurring revenue, and building regional service capability in Asia Pacific and the Middle East & Africa where installed bases are young. Partnerships with shore power equipment makers and with crane and terminal automation suppliers are increasingly common, since port tenders bundle these scopes.
Strategic direction across the sector points toward standardisation. Vendors are working with classification societies and industry bodies on interface definitions, pushing for recognised holding-force test protocols, and moving commercially from project engineering toward configurable product platforms with service contracts attached.
Recent Industry Developments
- January 2024: Amendments to SOLAS chapter II-1 regulation 3-8 on mooring equipment began applying to ships constructed on or after this date – formalising safe mooring design and maintenance as a flag-state obligation rather than good practice.
- 2020: The IMO issued guidelines on the design of mooring arrangements and on the selection of appropriate mooring equipment and fittings – giving designers and terminals a common technical reference for safe holding loads.
- April 2024: The European Union Alternative Fuels Infrastructure Regulation became applicable, setting shore power obligations at core network ports from 2030 – linking berth electrification investment directly to precision berthing requirements.
- January 2025: FuelEU Maritime greenhouse gas intensity limits began applying, including at-berth connection duties for container and passenger ships – accelerating European berth rebuilds that carry automated mooring in the same scope.
- 2018: The OCIMF Mooring Equipment Guidelines fourth edition was published – resetting line management, inspection and retirement expectations and raising the recorded whole-life cost of conventional mooring.
Companies Covered in the Report
- Cavotec SA
- Trelleborg AB
- Mampaey Offshore Industries
- MacGregor
- Kongsberg Maritime
- Straatman B.V.
- Prosertek Group
- Ibercisa Deck Machinery
- Smith Berger Marine
- DMT Marine Equipment
Automated Mooring Systems Market Report Scope
| Metric | Value |
| Study Period | 2020–2033 |
| Market Size 2026 | US$ 0.5 Billion |
| Market Size 2033 | US$ 1.1 Billion |
| CAGR 2026–2033 | 11.9% |
| Absolute Dollar Opportunity | US$ 0.6 Billion |
| Largest Market | Europe |
| Fastest-Growing Market | Asia Pacific |
| Market Concentration | Medium |
| Major Players | Cavotec SA, Trelleborg AB, Mampaey Offshore Industries, MacGregor, Kongsberg Maritime |
Automated Mooring Systems Market Segmentation
Technology
- Vacuum-based mooring
- Magnetic mooring
- Automated mooring arms and hooks
- Automated winch and line-handling systems
Installation Type
- Shore-based
- Vessel-based
- Floating and pontoon-mounted
Application
- Ferry and ro-ro berths
- Container terminals
- Bulk and general cargo terminals
- Locks and inland waterways
- Ship-to-ship transfer and offshore installations
Offering
- Equipment
- Installation and integration
- Software and load monitoring
- Maintenance and service contracts
Regions
- North America
- Europe
- Asia Pacific
- Latin America
- Middle East & Africa
- Executive Summary
- Global Automated Mooring Systems Market Snapshot
- Future Projections
- Key Report Takeaways
- Regional Snapshot
- Market Overview
- Market Definition and Report Scope
- Historical Trends 2020–2025
- Market Dynamics
- Drivers
- Mooring Injury Prevention Rules Are Making Rope-Free Berthing a Compliance Purchase
- Shore Power Mandates Are Tying Automated Mooring to Berth Electrification Budgets
- Restraints
- Per-Berth Capital Cost and Quay Reconstruction Slow Automated Mooring Adoption
- Mixed Vessel Calls and Hull Compatibility Limit Automated Mooring at Common-User Berths
- Market Opportunities
- Retrofit of Locks and Inland Waterway Infrastructure Opens a Public-Works Revenue Pool
- Load Monitoring Software and Berth Analytics Create a Recurring Revenue Layer
- Drivers
- Global Automated Mooring Systems Market Outlook, 2020–2033
- Global Automated Mooring Systems Market Outlook, by Technology, Value (US$ Billion), 2020–2033
- Vacuum-based mooring
- Magnetic mooring
- Automated mooring arms and hooks
- Automated winch and line-handling systems
- Global Automated Mooring Systems Market Outlook, by Installation Type, Value (US$ Billion), 2020–2033
- Shore-based
- Vessel-based
- Floating and pontoon-mounted
- Global Automated Mooring Systems Market Outlook, by Application, Value (US$ Billion), 2020–2033
- Ferry and ro-ro berths
- Container terminals
- Bulk and general cargo terminals
- Locks and inland waterways
- Ship-to-ship transfer and offshore installations
- Global Automated Mooring Systems Market Outlook, by Offering, Value (US$ Billion), 2020–2033
- Equipment
- Installation and integration
- Software and load monitoring
- Maintenance and service contracts
- Global Automated Mooring Systems Market Outlook, by Region, Value (US$ Billion), 2020–2033
- North America
- Europe
- Asia Pacific
- Latin America
- Middle East & Africa
- Global Automated Mooring Systems Market Outlook, by Technology, Value (US$ Billion), 2020–2033
- North America Automated Mooring Systems Market Outlook, 2020–2033
- North America Automated Mooring Systems Market Outlook, by Technology, Value (US$ Billion), 2020–2033
- Vacuum-based mooring
- Magnetic mooring
- Automated mooring arms and hooks
- Automated winch and line-handling systems
- North America Automated Mooring Systems Market Outlook, by Installation Type, Value (US$ Billion), 2020–2033
- Shore-based
- Vessel-based
- Floating and pontoon-mounted
- North America Automated Mooring Systems Market Outlook, by Application, Value (US$ Billion), 2020–2033
- Ferry and ro-ro berths
- Container terminals
- Bulk and general cargo terminals
- Locks and inland waterways
- Ship-to-ship transfer and offshore installations
- North America Automated Mooring Systems Market Outlook, by Offering, Value (US$ Billion), 2020–2033
- Equipment
- Installation and integration
- Software and load monitoring
- Maintenance and service contracts
- North America Automated Mooring Systems Market Outlook, by Country, Value (US$ Billion), 2020–2033
- United States Automated Mooring Systems Market Outlook, by Technology, 2020–2033
- United States Automated Mooring Systems Market Outlook, by Installation Type, 2020–2033
- United States Automated Mooring Systems Market Outlook, by Application, 2020–2033
- United States Automated Mooring Systems Market Outlook, by Offering, 2020–2033
- Canada Automated Mooring Systems Market Outlook, by Technology, 2020–2033
- Canada Automated Mooring Systems Market Outlook, by Installation Type, 2020–2033
- Canada Automated Mooring Systems Market Outlook, by Application, 2020–2033
- Canada Automated Mooring Systems Market Outlook, by Offering, 2020–2033
- North America Automated Mooring Systems Market Outlook, by Technology, Value (US$ Billion), 2020–2033
- Europe Automated Mooring Systems Market Outlook, 2020–2033
- Europe Automated Mooring Systems Market Outlook, by Technology, Value (US$ Billion), 2020–2033
- Vacuum-based mooring
- Magnetic mooring
- Automated mooring arms and hooks
- Automated winch and line-handling systems
- Europe Automated Mooring Systems Market Outlook, by Installation Type, Value (US$ Billion), 2020–2033
- Shore-based
- Vessel-based
- Floating and pontoon-mounted
- Europe Automated Mooring Systems Market Outlook, by Application, Value (US$ Billion), 2020–2033
- Ferry and ro-ro berths
- Container terminals
- Bulk and general cargo terminals
- Locks and inland waterways
- Ship-to-ship transfer and offshore installations
- Europe Automated Mooring Systems Market Outlook, by Offering, Value (US$ Billion), 2020–2033
- Equipment
- Installation and integration
- Software and load monitoring
- Maintenance and service contracts
- Europe Automated Mooring Systems Market Outlook, by Country, Value (US$ Billion), 2020–2033
- Norway Automated Mooring Systems Market Outlook, by Technology, 2020–2033
- Norway Automated Mooring Systems Market Outlook, by Installation Type, 2020–2033
- Norway Automated Mooring Systems Market Outlook, by Application, 2020–2033
- Norway Automated Mooring Systems Market Outlook, by Offering, 2020–2033
- Netherlands Automated Mooring Systems Market Outlook, by Technology, 2020–2033
- Netherlands Automated Mooring Systems Market Outlook, by Installation Type, 2020–2033
- Netherlands Automated Mooring Systems Market Outlook, by Application, 2020–2033
- Netherlands Automated Mooring Systems Market Outlook, by Offering, 2020–2033
- United Kingdom Automated Mooring Systems Market Outlook, by Technology, 2020–2033
- United Kingdom Automated Mooring Systems Market Outlook, by Installation Type, 2020–2033
- United Kingdom Automated Mooring Systems Market Outlook, by Application, 2020–2033
- United Kingdom Automated Mooring Systems Market Outlook, by Offering, 2020–2033
- Denmark Automated Mooring Systems Market Outlook, by Technology, 2020–2033
- Denmark Automated Mooring Systems Market Outlook, by Installation Type, 2020–2033
- Denmark Automated Mooring Systems Market Outlook, by Application, 2020–2033
- Denmark Automated Mooring Systems Market Outlook, by Offering, 2020–2033
- Sweden Automated Mooring Systems Market Outlook, by Technology, 2020–2033
- Sweden Automated Mooring Systems Market Outlook, by Installation Type, 2020–2033
- Sweden Automated Mooring Systems Market Outlook, by Application, 2020–2033
- Sweden Automated Mooring Systems Market Outlook, by Offering, 2020–2033
- Europe Automated Mooring Systems Market Outlook, by Technology, Value (US$ Billion), 2020–2033
- Asia Pacific Automated Mooring Systems Market Outlook, 2020–2033
- Asia Pacific Automated Mooring Systems Market Outlook, by Technology, Value (US$ Billion), 2020–2033
- Vacuum-based mooring
- Magnetic mooring
- Automated mooring arms and hooks
- Automated winch and line-handling systems
- Asia Pacific Automated Mooring Systems Market Outlook, by Installation Type, Value (US$ Billion), 2020–2033
- Shore-based
- Vessel-based
- Floating and pontoon-mounted
- Asia Pacific Automated Mooring Systems Market Outlook, by Application, Value (US$ Billion), 2020–2033
- Ferry and ro-ro berths
- Container terminals
- Bulk and general cargo terminals
- Locks and inland waterways
- Ship-to-ship transfer and offshore installations
- Asia Pacific Automated Mooring Systems Market Outlook, by Offering, Value (US$ Billion), 2020–2033
- Equipment
- Installation and integration
- Software and load monitoring
- Maintenance and service contracts
- Asia Pacific Automated Mooring Systems Market Outlook, by Country, Value (US$ Billion), 2020–2033
- China Automated Mooring Systems Market Outlook, by Technology, 2020–2033
- China Automated Mooring Systems Market Outlook, by Installation Type, 2020–2033
- China Automated Mooring Systems Market Outlook, by Application, 2020–2033
- China Automated Mooring Systems Market Outlook, by Offering, 2020–2033
- Japan Automated Mooring Systems Market Outlook, by Technology, 2020–2033
- Japan Automated Mooring Systems Market Outlook, by Installation Type, 2020–2033
- Japan Automated Mooring Systems Market Outlook, by Application, 2020–2033
- Japan Automated Mooring Systems Market Outlook, by Offering, 2020–2033
- South Korea Automated Mooring Systems Market Outlook, by Technology, 2020–2033
- South Korea Automated Mooring Systems Market Outlook, by Installation Type, 2020–2033
- South Korea Automated Mooring Systems Market Outlook, by Application, 2020–2033
- South Korea Automated Mooring Systems Market Outlook, by Offering, 2020–2033
- Singapore Automated Mooring Systems Market Outlook, by Technology, 2020–2033
- Singapore Automated Mooring Systems Market Outlook, by Installation Type, 2020–2033
- Singapore Automated Mooring Systems Market Outlook, by Application, 2020–2033
- Singapore Automated Mooring Systems Market Outlook, by Offering, 2020–2033
- Australia Automated Mooring Systems Market Outlook, by Technology, 2020–2033
- Australia Automated Mooring Systems Market Outlook, by Installation Type, 2020–2033
- Australia Automated Mooring Systems Market Outlook, by Application, 2020–2033
- Australia Automated Mooring Systems Market Outlook, by Offering, 2020–2033
- Asia Pacific Automated Mooring Systems Market Outlook, by Technology, Value (US$ Billion), 2020–2033
- Latin America Automated Mooring Systems Market Outlook, 2020–2033
- Latin America Automated Mooring Systems Market Outlook, by Technology, Value (US$ Billion), 2020–2033
- Vacuum-based mooring
- Magnetic mooring
- Automated mooring arms and hooks
- Automated winch and line-handling systems
- Latin America Automated Mooring Systems Market Outlook, by Installation Type, Value (US$ Billion), 2020–2033
- Shore-based
- Vessel-based
- Floating and pontoon-mounted
- Latin America Automated Mooring Systems Market Outlook, by Application, Value (US$ Billion), 2020–2033
- Ferry and ro-ro berths
- Container terminals
- Bulk and general cargo terminals
- Locks and inland waterways
- Ship-to-ship transfer and offshore installations
- Latin America Automated Mooring Systems Market Outlook, by Offering, Value (US$ Billion), 2020–2033
- Equipment
- Installation and integration
- Software and load monitoring
- Maintenance and service contracts
- Latin America Automated Mooring Systems Market Outlook, by Country, Value (US$ Billion), 2020–2033
- Brazil Automated Mooring Systems Market Outlook, by Technology, 2020–2033
- Brazil Automated Mooring Systems Market Outlook, by Installation Type, 2020–2033
- Brazil Automated Mooring Systems Market Outlook, by Application, 2020–2033
- Brazil Automated Mooring Systems Market Outlook, by Offering, 2020–2033
- Chile Automated Mooring Systems Market Outlook, by Technology, 2020–2033
- Chile Automated Mooring Systems Market Outlook, by Installation Type, 2020–2033
- Chile Automated Mooring Systems Market Outlook, by Application, 2020–2033
- Chile Automated Mooring Systems Market Outlook, by Offering, 2020–2033
- Mexico Automated Mooring Systems Market Outlook, by Technology, 2020–2033
- Mexico Automated Mooring Systems Market Outlook, by Installation Type, 2020–2033
- Mexico Automated Mooring Systems Market Outlook, by Application, 2020–2033
- Mexico Automated Mooring Systems Market Outlook, by Offering, 2020–2033
- Panama Automated Mooring Systems Market Outlook, by Technology, 2020–2033
- Panama Automated Mooring Systems Market Outlook, by Installation Type, 2020–2033
- Panama Automated Mooring Systems Market Outlook, by Application, 2020–2033
- Panama Automated Mooring Systems Market Outlook, by Offering, 2020–2033
- Peru Automated Mooring Systems Market Outlook, by Technology, 2020–2033
- Peru Automated Mooring Systems Market Outlook, by Installation Type, 2020–2033
- Peru Automated Mooring Systems Market Outlook, by Application, 2020–2033
- Peru Automated Mooring Systems Market Outlook, by Offering, 2020–2033
- Latin America Automated Mooring Systems Market Outlook, by Technology, Value (US$ Billion), 2020–2033
- Middle East & Africa Automated Mooring Systems Market Outlook, 2020–2033
- Middle East & Africa Automated Mooring Systems Market Outlook, by Technology, Value (US$ Billion), 2020–2033
- Vacuum-based mooring
- Magnetic mooring
- Automated mooring arms and hooks
- Automated winch and line-handling systems
- Middle East & Africa Automated Mooring Systems Market Outlook, by Installation Type, Value (US$ Billion), 2020–2033
- Shore-based
- Vessel-based
- Floating and pontoon-mounted
- Middle East & Africa Automated Mooring Systems Market Outlook, by Application, Value (US$ Billion), 2020–2033
- Ferry and ro-ro berths
- Container terminals
- Bulk and general cargo terminals
- Locks and inland waterways
- Ship-to-ship transfer and offshore installations
- Middle East & Africa Automated Mooring Systems Market Outlook, by Offering, Value (US$ Billion), 2020–2033
- Equipment
- Installation and integration
- Software and load monitoring
- Maintenance and service contracts
- Middle East & Africa Automated Mooring Systems Market Outlook, by Country, Value (US$ Billion), 2020–2033
- Saudi Arabia Automated Mooring Systems Market Outlook, by Technology, 2020–2033
- Saudi Arabia Automated Mooring Systems Market Outlook, by Installation Type, 2020–2033
- Saudi Arabia Automated Mooring Systems Market Outlook, by Application, 2020–2033
- Saudi Arabia Automated Mooring Systems Market Outlook, by Offering, 2020–2033
- United Arab Emirates Automated Mooring Systems Market Outlook, by Technology, 2020–2033
- United Arab Emirates Automated Mooring Systems Market Outlook, by Installation Type, 2020–2033
- United Arab Emirates Automated Mooring Systems Market Outlook, by Application, 2020–2033
- United Arab Emirates Automated Mooring Systems Market Outlook, by Offering, 2020–2033
- Qatar Automated Mooring Systems Market Outlook, by Technology, 2020–2033
- Qatar Automated Mooring Systems Market Outlook, by Installation Type, 2020–2033
- Qatar Automated Mooring Systems Market Outlook, by Application, 2020–2033
- Qatar Automated Mooring Systems Market Outlook, by Offering, 2020–2033
- Egypt Automated Mooring Systems Market Outlook, by Technology, 2020–2033
- Egypt Automated Mooring Systems Market Outlook, by Installation Type, 2020–2033
- Egypt Automated Mooring Systems Market Outlook, by Application, 2020–2033
- Egypt Automated Mooring Systems Market Outlook, by Offering, 2020–2033
- South Africa Automated Mooring Systems Market Outlook, by Technology, 2020–2033
- South Africa Automated Mooring Systems Market Outlook, by Installation Type, 2020–2033
- South Africa Automated Mooring Systems Market Outlook, by Application, 2020–2033
- South Africa Automated Mooring Systems Market Outlook, by Offering, 2020–2033
- Middle East & Africa Automated Mooring Systems Market Outlook, by Technology, Value (US$ Billion), 2020–2033
- Competitive Landscape
- Market Concentration and Industry Leaders
- Competitive Differentiation
- Strategic Moves and Market Direction
- Recent Industry Developments
- Company Profiles
- Cavotec SA
- Trelleborg AB
- Mampaey Offshore Industries
- MacGregor
- Kongsberg Maritime
- Straatman B.V.
- Prosertek Group
- Ibercisa Deck Machinery
- Smith Berger Marine
- DMT Marine Equipment
- Appendix
- Research Methodology
- Report Assumptions
- Acronyms and Abbreviations
Technology
- Vacuum-based mooring
- Magnetic mooring
- Automated mooring arms and hooks
- Automated winch and line-handling systems
Installation Type
- Shore-based
- Vessel-based
- Floating and pontoon-mounted
Application
- Ferry and ro-ro berths
- Container terminals
- Bulk and general cargo terminals
- Locks and inland waterways
- Ship-to-ship transfer and offshore installations
Offering
- Equipment
- Installation and integration
- Software and load monitoring
- Maintenance and service contracts
Regions
- North America
- Europe
- Asia Pacific
- Latin America
- Middle East & Africa
Our Research Methodology
Considering the volatility of business today, traditional approaches to strategizing a game plan can be unfruitful if not detrimental. True ambiguity is no way to determine a forecast. A myriad of predetermined factors must be accounted for such as the degree of risk involved, the magnitude of circumstances, as well as conditions or consequences that are not known or unpredictable. To circumvent binary views that cast uncertainty, the application of market research intelligence to strategically posture, move, and enable actionable outcomes is necessary.
View Methodology
Quality Assured
Rigorous Validation Process

Confidentiality Assured
End-to-end Data Security

Custom Research Services
Tailored To Your Objectives
FAQs
The automated mooring systems market is valued at US$ 0.5 billion in 2026, equivalent to US$ 500 million across shore-based and vessel-based rope-free berthing equipment worldwide.
The market is projected to reach US$ 1.1 billion by 2033, growing at an 11.9% CAGR and adding US$ 0.6 billion in absolute dollar opportunity.
Vacuum-based mooring leads with 41% share in 2026, supported by the longest field record at ferry and ro-ro berths with frequent, repeatable vessel calls.
Software and load monitoring grows fastest at 16.2% CAGR, while Asia Pacific is the fastest-expanding region at 14.9% CAGR through 2033.
Europe holds the largest share at 38% in 2026, driven by dense ferry networks, shore power obligations and strict enforcement of mooring safety requirements.
Related Reports
Floating Storage and Regasification Unit Market Size, Share, Insights, Competitive Landscape, and Forecast 2026 to 2033
Floating storage and regasification unit market to grow from US$8.96 Bn in 2026 to US$13.92 Bn by 2033 at 6.5% CAGR. Explore types, mooring and regions.
Floating Solar Market Size, Share, Insights, Competitive Landscape, and Forecast 2026 to 2033
Floating solar market to grow from US$1.60 Bn in 2026 to US$4.02 Bn by 2033 at 14.1% CAGR. Explore capacities, products, locations and regional trends.
Offshore Grid Connection Solutions Market Size, Share, Insights, Competitive Landscape, and Forecast 2026 to 2033
Offshore grid connection solutions market to reach US$ 5.71 billion by 2033 at a 6.7% CAGR. Explore HVDC, subsea cables, applications and regional trends.
Nickel Hydrogen Batteries Market Size, Share, Insights, Competitive Landscape, and Forecast 2026 to 2033
Nickel hydrogen batteries market to reach US$11.85 billion by 2033 at 13.7% CAGR, driven by hybrid vehicles and stationary energy storage.
Landing String Equipment Market Size, Share, Insights, Competitive Landscape, and Forecast 2026 to 2033
Explore the landing string equipment market, reaching US$ 0.80 billion by 2033 at 6.6% CAGR, with component, technology and regional insights.
Fuel Cell Market Size, Share, Insights, Competitive Landscape, and Forecast 2026 to 2033
Fuel cell market to reach US$ 21.6 billion by 2033 at 17.0% CAGR. Explore technologies, applications, regions and key companies.