



Compounded Bioidentical Hormone Therapy Market
Compounded Bioidentical Hormone Therapy Market Size, Share, Insights, Competitive Landscape, and Forecast 2026 to 2033
Report Overview
Compounded Bioidentical Hormone Therapy Market Size and Trend Analysis
What Is Driving Compounded Hormone Therapy Market Growth?
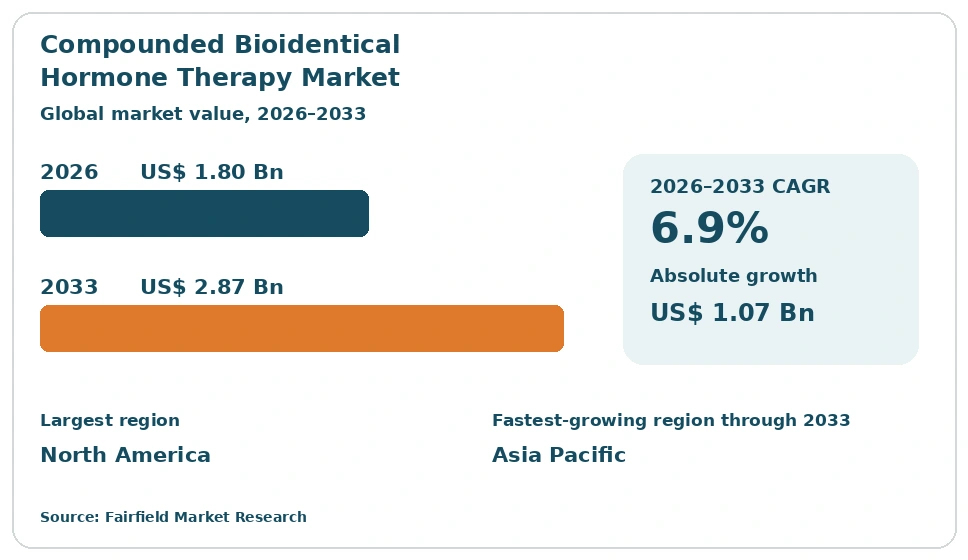
The global Compounded Bioidentical Hormone Therapy market size is expected to be valued at US$ 1.8 billion in 2026 and projected to reach US$ 2.87 billion by 2033, growing at a CAGR of 6.9% between 2026 and 2033. Growth reflects wider use of pharmacy-compounded estrogen, progesterone, testosterone and DHEA preparations prescribed through specialty clinics. Demand sits in cash-pay menopause and andropause care, where prescribers seek dose and excipient flexibility. These preparations are not approved by the U.S. Food and Drug Administration, and approved bioidentical hormone products remain a separate regulated category. Market expansion is shaped as much by state pharmacy oversight and facility quality systems as by patient demand. Absolute dollar opportunity is US$ 1.07 billion.
Key Report Takeaways
- By Hormone Type: Estrogen-based preparations led with 38% share in 2026, while testosterone preparations are projected to expand at an 8.1% CAGR through 2033, driven by growth in men’s health clinic prescribing.
- By Dosage Form: Topical creams and gels led with 41% share in 2026, while subcutaneous pellets are projected to expand at an 8.4% CAGR through 2033, driven by procedure-based clinic business models and in-office administration workflows.
- By Distribution Channel: Independent compounding pharmacies held 46% share in 2026, while online and mail-order pharmacies are projected to expand at an 8.6% CAGR through 2033, driven by telehealth prescribing and multi-state licensure build-out.
- By End User: Women’s health and menopause clinics accounted for 44% share in 2026, while men’s health and andrology clinics are projected to expand at an 8.3% CAGR through 2033, driven by expanding cash-pay practice networks and franchise models.
- By Region: North America led with 58% share in 2026, while Asia Pacific is projected to expand at an 8.9% CAGR through 2033; Europe, Latin America and Middle East & Africa follow with smaller but widening specialty clinic bases.
Market Trends and Insights
Market Growth Drivers
Prescriber Demand for Dose and Excipient Flexibility
Prescriber demand for formulation flexibility is the largest single contributor to revenue growth in this market. Clinicians managing menopause and andropause symptoms request strengths, hormone combinations or excipient profiles that approved products do not supply. Compounding pharmacies fill those requests on a prescription-specific basis, which sustains steady order volume across 503A operations. Activity concentrates in cash-pay practices, where formulary design does not constrain prescribing.
The underlying trend is demographic and structural. Populations across North America, Europe and parts of Asia Pacific are moving into midlife age bands, widening the prescribing pool. Specialty menopause and men’s health practices have grown into standalone clinical businesses that build workflows around compounded supply agreements. Pharmacy operators have responded by adding non-sterile capacity, documentation systems and multi-state licensure, since these preparations remain unapproved by the U.S. Food and Drug Administration.
Expansion of Specialty Clinic Networks and Cash-Pay Channels
The build-out of specialty hormone clinics converts scattered prescribing into predictable, contracted pharmacy demand. Clinic groups standardise their preparation menus, sign supply arrangements with few pharmacies and order on repeat cycles. That shift lifts order size and improves working capital for pharmacy operators. It also moves revenue away from one-off retail dispensing toward recurring business-to-business supply, which investors value at higher multiples.
Behind the shift is the growth of cash-pay wellness medicine as a practice model. Integrative medicine, longevity and men’s health clinics operate outside conventional reimbursement, charging programme fees that bundle consultation, laboratory work and dispensing. Franchise and clinic-support companies supply branding, training and ordering platforms to independent practices. Pharmacies serving these networks invest in ordering portals, electronic prescription capture and courier logistics, which raises the operating bar for smaller single-site compounders.
Restraints Impact Analysis of Market
Absence of FDA Approval and Documented Potency Variability
Compounded bioidentical preparations are not approved by the U.S. Food and Drug Administration, which constrains the addressable market structurally. They lack the premarket review, standardised content testing and labelling requirements applied to approved hormone products. Regulators and medical bodies have raised concerns about potency variability between batches and pharmacies, since content uniformity testing is not uniformly mandated. Insurers decline coverage on that basis, pushing volume into cash-pay channels.
These are substantive clinical and regulatory concerns rather than commercial inconvenience. Professional bodies including The Endocrine Society and The Menopause Society have challenged marketing claims that compounded preparations are safer, more natural or better tolerated than approved hormone therapy; those claims are disputed and unestablished. State boards of pharmacy and the U.S. Food and Drug Administration direct inspection attention toward sterility assurance, beyond-use dating and bulk substance sourcing. The practical effect is higher quality-system cost.
Tightening Oversight of Compounding Categories and Marketing Claims
Regulatory tightening across compounding categories limits how far operators can scale standardised production. The distinction between patient-specific 503A compounding and 503B outsourcing facility manufacturing sets different registration, inspection and record-keeping obligations. Pharmacies that grow beyond prescription-specific dispensing must register as outsourcing facilities and absorb heavier compliance cost. That threshold caps growth for mid-sized operators and slows consolidation.
Scrutiny of promotional language adds a second constraint. Advertising that presents compounded preparations as equivalent to, or better than, approved hormone products attracts attention from federal regulators, state boards and advertising authorities. Clinic marketing that blurs the line between the two categories carries reputational and legal exposure for the supplying pharmacy. Operators have responded by narrowing claims, formalising prescriber education content and separating clinical information from promotional material, which raises customer acquisition cost across the sector.
Market Opportunities
Quality Systems and Outsourcing Capacity as Commercial Differentiators
Investment in verifiable quality systems is becoming the clearest route to premium positioning and institutional accounts. Pharmacies that run third-party potency and sterility testing, environmental monitoring and documented stability programmes can serve clinic groups with procurement committees. Those buyers ask for test certificates, batch records and supplier audits before signing agreements. Operators supplying that evidence win multi-site contracts and defend pricing.
Registered 503B outsourcing facilities open a parallel revenue line. Office-use supply, rather than patient-specific dispensing, lets clinics stock preparations ahead of appointments and supports procedure-based models such as pellet insertion. Building that capability requires current good manufacturing practice systems, validated processes and sustained capital spending. Firms that already operate sterile injectable lines for other product categories hold an advantage, and several have extended facilities and analytical laboratories to serve hormone preparation demand.
Telehealth Prescribing and Mail-Order Fulfilment Models
Telehealth-linked prescribing and direct-to-patient fulfilment create the fastest-expanding distribution opportunity in the market. Virtual consultation platforms route prescriptions to partner pharmacies, removing geographic limits on clinic reach and lifting order frequency. Pharmacies that hold licences across many states can serve national patient populations from a single fulfilment site, which improves asset utilisation. Recurring refill models also deliver more predictable demand signals for inventory and staffing.
The enabling trend is digital infrastructure in pharmacy operations. Electronic prescribing integration, patient portals, identity verification and temperature-controlled courier networks have become standard requirements rather than differentiators. Platform operators invest in order management software that links prescriber, pharmacy and patient records in one workflow. Multi-state licensure, non-resident pharmacy registration and state-specific telehealth rules remain the gating factor, so expansion depends on regulatory affairs capability as much as on technology spending.
Category-wise Insights
Which Hormone Type Accounts for the Largest Share?
Estrogen-based preparations account for the largest share of the market at 38% in 2026, reflecting the depth of menopause symptom prescribing. Estradiol and estriol formulations, often combined with progesterone, form the core of specialty clinic preparation menus. Established prescribing patterns, bulk substance availability and familiar non-sterile production keep this category dominant.
Growth leadership sits elsewhere. Testosterone preparations are projected to expand at an 8.1% CAGR through 2033 as men’s health practices scale into organised clinic networks. Controlled substance scheduling adds record-keeping and storage obligations that limit how many pharmacies compete, supporting margins for those that do. Progesterone holds 24% share, testosterone 21%, DHEA 9% and multi-hormone combinations 8%. The widening mix means pharmacies must manage more active ingredients, more supplier qualification and more analytical testing, raising the operating threshold.
Topical Formats Hold Scale While Pellet Procedures Grow Faster
Topical creams and gels lead the dosage form category with 41% share in 2026, supported by straightforward non-sterile production and low equipment requirements. Most independent pharmacies produce these formats without sterile suites, keeping unit economics favourable and supply broad. Transdermal bases and metered dispensers are widely available from ingredient suppliers.
Subcutaneous pellets hold 23% share and are the fastest-growing format at an 8.4% CAGR through 2033, tied to procedure-based clinic models. Pellet insertion is billed as a clinic procedure, aligning pharmacy supply with recurring appointment cycles and larger orders. Production demands sterile processing, environmental controls and rigorous testing, concentrating supply among fewer operators. Capsules and troches hold 19% share, injectables 11% and other formats, including suppositories and sublingual drops, 6%. The format mix is shifting capital requirements upward across the supply base.
Independent Pharmacies Dominate Supply as Digital Channels Accelerate
Independent compounding pharmacies remain the dominant distribution channel with 46% share in 2026, since patient-specific 503A dispensing matches how most prescriptions are written. They hold direct prescriber relationships, local licensure and flexibility to prepare one-off formulations. Clinic in-office dispensing accounts for 22% share, and registered 503B outsourcing facilities hold 19%.
Online and mail-order pharmacies are the fastest-growing channel at an 8.6% CAGR through 2033, holding 13% share in 2026. Telehealth prescribing, multi-state non-resident licensure and courier logistics let a single site serve national demand. Pharmacies with strong digital front ends and regulatory affairs teams capture volume once tied to local catchment areas. Smaller operators without that infrastructure face pressure on prescription counts and increasingly supply clinic networks as subcontractors rather than compete for patient-level demand.
Women’s Health Clinics Anchor Demand While Men’s Health Scales
Women’s health and menopause clinics are the largest end user group with 44% share in 2026, anchored by the volume of midlife symptom consultations. They generate repeat prescribing across multi-year relationships, giving supplying pharmacies predictable demand. Integrative and functional medicine practices hold 24% share, reflecting their position in cash-pay wellness medicine.
Men’s health and andrology clinics are growing fastest at an 8.3% CAGR through 2033, supported by rapid clinic formation and membership-based programme pricing. Hospitals and ambulatory care settings account for 14% share and remain cautious buyers, since formulary committees weigh the absence of approved-product status heavily. For operators, growth capital is best directed at specialty clinic account management rather than institutional sales. Contract structure, ordering technology and documented quality evidence determine which pharmacies retain those relationships.
Geography Analysis
Which Region Is Leading the Compounded Bioidentical Hormone Therapy Market?
North America leads the market with 58% share in 2026, driven by its compounding pharmacy sector and cash-pay clinic economy. The United States supplies most of this demand, supported by a large base of 503A pharmacies and 503B outsourcing facilities. State boards of pharmacy license and inspect operators, while the U.S. Food and Drug Administration oversees outsourcing facility registration and bulk substance policy. Canada contributes a smaller volume under provincial college oversight.
Regional leadership rests on infrastructure rather than demand alone. Ingredient suppliers, testing laboratories, sterile suite builders and pharmacy software vendors are concentrated here, shortening the path from investment to operating capacity. Specialty menopause and men’s health clinic chains have expanded across metropolitan markets, creating contracted supply relationships that lock in recurring volume.
Europe Advances Under Tighter National Compounding Rules
Europe holds 18% share in 2026, with activity concentrated in Germany, the United Kingdom, Italy and the Netherlands. Magistral and officinal preparation traditions give pharmacists an established legal route to prepare individualised medicines, and Germany in particular retains a dense network of pharmacies equipped for it.
Growth is paced by stricter national oversight. Regulators apply detailed requirements covering ingredient provenance, preparation records and quality assurance, and they scrutinise promotional claims closely. National reimbursement systems rarely cover these preparations, so demand concentrates in private clinics in major cities. Ingredient and equipment suppliers headquartered in the region support capability across borders, while cross-border supply remains constrained by differing national rules. The result is steady, compliance-led expansion rather than the rapid clinic-driven growth seen in North America.
Which Region Is Growing Fastest in the Compounded Bioidentical Hormone Therapy Market?
Asia Pacific is growing fastest at an 8.9% CAGR through 2033, from 14% share in 2026. Expansion is led by Australia, Japan, South Korea, China and India, where private wellness and anti-ageing clinics have multiplied in large urban centres. Rising out-of-pocket health spending among urban middle-income households funds this demand directly.
Supply-side capability is building alongside it. Pharmacies in Australia operate under an established compounding framework with formal accreditation pathways, and regional operators have invested in cleanrooms and analytical testing. Hospital pharmacy modernisation across Japan and South Korea has lifted baseline preparation standards. Regulatory treatment varies widely between countries, and several national authorities have moved to define permitted preparation activity more tightly, which shapes where operators choose to invest capacity.
Latin America Builds Scale Through Private Clinic Networks
Latin America accounts for 6% share in 2026, with Brazil, Mexico, Argentina and Colombia supplying most volume. Brazil has an unusually deep farmácia de manipulação sector, with thousands of licensed compounding pharmacies serving routine prescription demand across many therapy areas.
Hormone preparation demand rides on that existing infrastructure. Private aesthetic, gynaecology and longevity clinics in major cities prescribe into an established local supply base, limiting the need for new capital investment. Economic volatility and currency movement affect imported active ingredient costs, which pressures margins and pushes operators toward local sourcing. National health authorities license and inspect compounding pharmacies, and enforcement capacity varies between countries. Medical tourism in Mexico adds incremental cross-border demand, particularly in cities near the United States border.
Middle East & Africa Demand Concentrates in Gulf Private Care
Middle East & Africa holds 4% share in 2026, the smallest regional position, with demand concentrated in the United Arab Emirates, Saudi Arabia and South Africa. Private hospital groups and premium wellness clinics in Gulf cities serve high-income and expatriate populations able to pay directly for individualised preparations.
Capability is narrow but improving. Gulf health authorities have invested in pharmacy licensing frameworks and inspection capacity, and several private hospital groups operate accredited preparation units. South Africa has a longer-standing compounding pharmacy base serving its private healthcare sector. Across much of the wider region, limited access to qualified ingredient suppliers, analytical testing and trained compounding pharmacists caps growth. Most preparations and ingredients are imported, so supply reliability depends on distribution agreements with manufacturers based elsewhere.
Competitive Landscape
The market is fragmented, with several hundred compounding pharmacies in North America alone and no operator holding dominant national scale. Competitive structure splits between independent 503A pharmacies serving local prescribers, larger multi-state operators with digital fulfilment, and registered 503B outsourcing facilities supplying office-use preparations. Ingredient and equipment suppliers such as Fagron and Medisca occupy a distinct upstream position, selling active substances, bases and training into the pharmacy base. Consolidation has been gradual, limited by the cost of multi-state licensure and by the compliance burden that comes with crossing from patient-specific compounding into outsourcing facility operations.
Competition centres on quality evidence, breadth of preparation menu, fulfilment speed and regulatory reach. Clinic groups with procurement processes compare third-party potency testing, sterility assurance, batch documentation and beyond-use dating practice before awarding supply agreements. Pharmacies differentiate through analytical laboratory capability, cleanroom classification, electronic prescribing integration and the number of states in which they hold non-resident licences. Clinic-support and training businesses, including BioTE Corporation, SottoPelle and EVEXIAS Health Solutions, compete on a different axis, supplying practice models, prescriber education and ordering platforms that route demand toward partner pharmacies.
Strategic activity concentrates on capacity and compliance rather than on product novelty, since these preparations are not approved products and cannot be marketed as such. Operators have invested in sterile suites, environmental monitoring, stability programmes and quality management systems, because those capabilities decide which institutional accounts are reachable. Expansion of state licensure footprints functions as a growth strategy in itself, converting a local pharmacy into a national supplier. Upstream suppliers compete through ingredient qualification, documentation support and pharmacist training that lowers the compliance burden for their customers.
Competitive direction points toward professionalised operations. Buyers increasingly expect manufacturing-grade documentation from pharmacies, and that expectation favours operators with capital to invest in facilities and quality staff.
Industry Leaders
- Empower Pharmacy
- Women’s International Pharmacy
- Belmar Pharma Solutions
- Olympia Pharmaceuticals
- BioTE Corporation
- Fagron
- Medisca
Companies Covered in the Report
- Empower Pharmacy
- Women’s International Pharmacy
- Belmar Pharma Solutions
- Olympia Pharmaceuticals
- BioTE Corporation
- Fagron
- Medisca
- Innovation Compounding
- Hallandale Pharmacy
- Carie Boyd Pharmaceuticals
- QuVa Pharma
- Leiters Health
- Asteria Health
- Nephron Pharmaceuticals
- SottoPelle
- EVEXIAS Health Solutions
Compounded Bioidentical Hormone Therapy Market Report Scope
The market is segmented by hormone type, dosage form, distribution channel, end user and region.
| By Hormone Type | Estrogen (estradiol, estriol), Progesterone, Testosterone, DHEA, Multi-hormone combination preparations |
| By Dosage Form | Topical creams and gels, Subcutaneous pellets, Capsules and troches, Injectables, Others (suppositories, sublingual drops) |
| By Distribution Channel | Independent compounding pharmacies, Clinic in-office dispensing, Outsourcing facilities, Online and mail-order pharmacies |
| By End User | Women’s health and menopause clinics, Integrative and functional medicine practices, Men’s health and andrology clinics, Hospitals and ambulatory care settings |
| By Region | North America, Europe, Asia Pacific, Latin America, Middle East & Africa |
1. Executive Summary
1.1 Compounded Bioidentical Hormone Therapy Market Snapshot
1.2 Future Projections
1.3 Key Market Trends
1.4 Regional Snapshot
2. Market Overview
2.1 Market Definition and Report Scope
2.2 Market Dynamics
2.2.1 Drivers
2.2.2 Restraints
2.2.3 Market Opportunities
3. Global Compounded Bioidentical Hormone Therapy Market Outlook, 2026–2033
3.1 Global Compounded Bioidentical Hormone Therapy Market Outlook, by Hormone Type, Value (US$ Billion), 2026–2033
3.1.1 Estrogen (estradiol, estriol)
3.1.2 Progesterone
3.1.3 Testosterone
3.1.4 DHEA
3.1.5 Multi-hormone combination preparations
3.2 Global Compounded Bioidentical Hormone Therapy Market Outlook, by Dosage Form, Value (US$ Billion), 2026–2033
3.2.1 Topical creams and gels
3.2.2 Subcutaneous pellets
3.2.3 Capsules and troches
3.2.4 Injectables
3.2.5 Others (suppositories, sublingual drops)
3.3 Global Compounded Bioidentical Hormone Therapy Market Outlook, by Distribution Channel, Value (US$ Billion), 2026–2033
3.3.1 Independent compounding pharmacies
3.3.2 Clinic in-office dispensing
3.3.3 Outsourcing facilities
3.3.4 Online and mail-order pharmacies
3.4 Global Compounded Bioidentical Hormone Therapy Market Outlook, by End User, Value (US$ Billion), 2026–2033
3.4.1 Women's health and menopause clinics
3.4.2 Integrative and functional medicine practices
3.4.3 Men's health and andrology clinics
3.4.4 Hospitals and ambulatory care settings
3.5 Global Compounded Bioidentical Hormone Therapy Market Outlook, by Region, Value (US$ Billion), 2026–2033
3.5.1 North America
3.5.2 Europe
3.5.3 Asia Pacific
3.5.4 Latin America
3.5.5 Middle East & Africa
4. North America Compounded Bioidentical Hormone Therapy Market Outlook, 2026–2033
4.1 North America Compounded Bioidentical Hormone Therapy Market Outlook, by Hormone Type, Value (US$ Billion), 2026–2033
4.1.1 Estrogen (estradiol, estriol)
4.1.2 Progesterone
4.1.3 Testosterone
4.1.4 DHEA
4.1.5 Multi-hormone combination preparations
4.2 North America Compounded Bioidentical Hormone Therapy Market Outlook, by Dosage Form, Value (US$ Billion), 2026–2033
4.2.1 Topical creams and gels
4.2.2 Subcutaneous pellets
4.2.3 Capsules and troches
4.2.4 Injectables
4.2.5 Others (suppositories, sublingual drops)
4.3 North America Compounded Bioidentical Hormone Therapy Market Outlook, by Distribution Channel, Value (US$ Billion), 2026–2033
4.3.1 Independent compounding pharmacies
4.3.2 Clinic in-office dispensing
4.3.3 Outsourcing facilities
4.3.4 Online and mail-order pharmacies
4.4 North America Compounded Bioidentical Hormone Therapy Market Outlook, by End User, Value (US$ Billion), 2026–2033
4.4.1 Women's health and menopause clinics
4.4.2 Integrative and functional medicine practices
4.4.3 Men's health and andrology clinics
4.4.4 Hospitals and ambulatory care settings
4.5 North America Compounded Bioidentical Hormone Therapy Market Outlook, by Country, Value (US$ Billion), 2026–2033
4.5.1 United States Compounded Bioidentical Hormone Therapy Market Outlook, by Hormone Type, 2026–2033
4.5.2 United States Compounded Bioidentical Hormone Therapy Market Outlook, by Dosage Form, 2026–2033
4.5.3 United States Compounded Bioidentical Hormone Therapy Market Outlook, by Distribution Channel, 2026–2033
4.5.4 United States Compounded Bioidentical Hormone Therapy Market Outlook, by End User, 2026–2033
4.5.5 Canada Compounded Bioidentical Hormone Therapy Market Outlook, by Hormone Type, 2026–2033
4.5.6 Canada Compounded Bioidentical Hormone Therapy Market Outlook, by Dosage Form, 2026–2033
4.5.7 Canada Compounded Bioidentical Hormone Therapy Market Outlook, by Distribution Channel, 2026–2033
4.5.8 Canada Compounded Bioidentical Hormone Therapy Market Outlook, by End User, 2026–2033
5. Europe Compounded Bioidentical Hormone Therapy Market Outlook, 2026–2033
5.1 Europe Compounded Bioidentical Hormone Therapy Market Outlook, by Hormone Type, Value (US$ Billion), 2026–2033
5.1.1 Estrogen (estradiol, estriol)
5.1.2 Progesterone
5.1.3 Testosterone
5.1.4 DHEA
5.1.5 Multi-hormone combination preparations
5.2 Europe Compounded Bioidentical Hormone Therapy Market Outlook, by Dosage Form, Value (US$ Billion), 2026–2033
5.2.1 Topical creams and gels
5.2.2 Subcutaneous pellets
5.2.3 Capsules and troches
5.2.4 Injectables
5.2.5 Others (suppositories, sublingual drops)
5.3 Europe Compounded Bioidentical Hormone Therapy Market Outlook, by Distribution Channel, Value (US$ Billion), 2026–2033
5.3.1 Independent compounding pharmacies
5.3.2 Clinic in-office dispensing
5.3.3 Outsourcing facilities
5.3.4 Online and mail-order pharmacies
5.4 Europe Compounded Bioidentical Hormone Therapy Market Outlook, by End User, Value (US$ Billion), 2026–2033
5.4.1 Women's health and menopause clinics
5.4.2 Integrative and functional medicine practices
5.4.3 Men's health and andrology clinics
5.4.4 Hospitals and ambulatory care settings
5.5 Europe Compounded Bioidentical Hormone Therapy Market Outlook, by Country, Value (US$ Billion), 2026–2033
5.5.1 Germany Compounded Bioidentical Hormone Therapy Market Outlook, by Hormone Type, 2026–2033
5.5.2 Germany Compounded Bioidentical Hormone Therapy Market Outlook, by Dosage Form, 2026–2033
5.5.3 Germany Compounded Bioidentical Hormone Therapy Market Outlook, by Distribution Channel, 2026–2033
5.5.4 Germany Compounded Bioidentical Hormone Therapy Market Outlook, by End User, 2026–2033
5.5.5 United Kingdom Compounded Bioidentical Hormone Therapy Market Outlook, by Hormone Type, 2026–2033
5.5.6 United Kingdom Compounded Bioidentical Hormone Therapy Market Outlook, by Dosage Form, 2026–2033
5.5.7 United Kingdom Compounded Bioidentical Hormone Therapy Market Outlook, by Distribution Channel, 2026–2033
5.5.8 United Kingdom Compounded Bioidentical Hormone Therapy Market Outlook, by End User, 2026–2033
5.5.9 Italy Compounded Bioidentical Hormone Therapy Market Outlook, by Hormone Type, 2026–2033
5.5.10 Italy Compounded Bioidentical Hormone Therapy Market Outlook, by Dosage Form, 2026–2033
5.5.11 Italy Compounded Bioidentical Hormone Therapy Market Outlook, by Distribution Channel, 2026–2033
5.5.12 Italy Compounded Bioidentical Hormone Therapy Market Outlook, by End User, 2026–2033
5.5.13 Netherlands Compounded Bioidentical Hormone Therapy Market Outlook, by Hormone Type, 2026–2033
5.5.14 Netherlands Compounded Bioidentical Hormone Therapy Market Outlook, by Dosage Form, 2026–2033
5.5.15 Netherlands Compounded Bioidentical Hormone Therapy Market Outlook, by Distribution Channel, 2026–2033
5.5.16 Netherlands Compounded Bioidentical Hormone Therapy Market Outlook, by End User, 2026–2033
6. Asia Pacific Compounded Bioidentical Hormone Therapy Market Outlook, 2026–2033
6.1 Asia Pacific Compounded Bioidentical Hormone Therapy Market Outlook, by Hormone Type, Value (US$ Billion), 2026–2033
6.1.1 Estrogen (estradiol, estriol)
6.1.2 Progesterone
6.1.3 Testosterone
6.1.4 DHEA
6.1.5 Multi-hormone combination preparations
6.2 Asia Pacific Compounded Bioidentical Hormone Therapy Market Outlook, by Dosage Form, Value (US$ Billion), 2026–2033
6.2.1 Topical creams and gels
6.2.2 Subcutaneous pellets
6.2.3 Capsules and troches
6.2.4 Injectables
6.2.5 Others (suppositories, sublingual drops)
6.3 Asia Pacific Compounded Bioidentical Hormone Therapy Market Outlook, by Distribution Channel, Value (US$ Billion), 2026–2033
6.3.1 Independent compounding pharmacies
6.3.2 Clinic in-office dispensing
6.3.3 Outsourcing facilities
6.3.4 Online and mail-order pharmacies
6.4 Asia Pacific Compounded Bioidentical Hormone Therapy Market Outlook, by End User, Value (US$ Billion), 2026–2033
6.4.1 Women's health and menopause clinics
6.4.2 Integrative and functional medicine practices
6.4.3 Men's health and andrology clinics
6.4.4 Hospitals and ambulatory care settings
6.5 Asia Pacific Compounded Bioidentical Hormone Therapy Market Outlook, by Country, Value (US$ Billion), 2026–2033
6.5.1 Australia Compounded Bioidentical Hormone Therapy Market Outlook, by Hormone Type, 2026–2033
6.5.2 Australia Compounded Bioidentical Hormone Therapy Market Outlook, by Dosage Form, 2026–2033
6.5.3 Australia Compounded Bioidentical Hormone Therapy Market Outlook, by Distribution Channel, 2026–2033
6.5.4 Australia Compounded Bioidentical Hormone Therapy Market Outlook, by End User, 2026–2033
6.5.5 Japan Compounded Bioidentical Hormone Therapy Market Outlook, by Hormone Type, 2026–2033
6.5.6 Japan Compounded Bioidentical Hormone Therapy Market Outlook, by Dosage Form, 2026–2033
6.5.7 Japan Compounded Bioidentical Hormone Therapy Market Outlook, by Distribution Channel, 2026–2033
6.5.8 Japan Compounded Bioidentical Hormone Therapy Market Outlook, by End User, 2026–2033
6.5.9 South Korea Compounded Bioidentical Hormone Therapy Market Outlook, by Hormone Type, 2026–2033
6.5.10 South Korea Compounded Bioidentical Hormone Therapy Market Outlook, by Dosage Form, 2026–2033
6.5.11 South Korea Compounded Bioidentical Hormone Therapy Market Outlook, by Distribution Channel, 2026–2033
6.5.12 South Korea Compounded Bioidentical Hormone Therapy Market Outlook, by End User, 2026–2033
6.5.13 China Compounded Bioidentical Hormone Therapy Market Outlook, by Hormone Type, 2026–2033
6.5.14 China Compounded Bioidentical Hormone Therapy Market Outlook, by Dosage Form, 2026–2033
6.5.15 China Compounded Bioidentical Hormone Therapy Market Outlook, by Distribution Channel, 2026–2033
6.5.16 China Compounded Bioidentical Hormone Therapy Market Outlook, by End User, 2026–2033
6.5.17 India Compounded Bioidentical Hormone Therapy Market Outlook, by Hormone Type, 2026–2033
6.5.18 India Compounded Bioidentical Hormone Therapy Market Outlook, by Dosage Form, 2026–2033
6.5.19 India Compounded Bioidentical Hormone Therapy Market Outlook, by Distribution Channel, 2026–2033
6.5.20 India Compounded Bioidentical Hormone Therapy Market Outlook, by End User, 2026–2033
7. Latin America Compounded Bioidentical Hormone Therapy Market Outlook, 2026–2033
7.1 Latin America Compounded Bioidentical Hormone Therapy Market Outlook, by Hormone Type, Value (US$ Billion), 2026–2033
7.1.1 Estrogen (estradiol, estriol)
7.1.2 Progesterone
7.1.3 Testosterone
7.1.4 DHEA
7.1.5 Multi-hormone combination preparations
7.2 Latin America Compounded Bioidentical Hormone Therapy Market Outlook, by Dosage Form, Value (US$ Billion), 2026–2033
7.2.1 Topical creams and gels
7.2.2 Subcutaneous pellets
7.2.3 Capsules and troches
7.2.4 Injectables
7.2.5 Others (suppositories, sublingual drops)
7.3 Latin America Compounded Bioidentical Hormone Therapy Market Outlook, by Distribution Channel, Value (US$ Billion), 2026–2033
7.3.1 Independent compounding pharmacies
7.3.2 Clinic in-office dispensing
7.3.3 Outsourcing facilities
7.3.4 Online and mail-order pharmacies
7.4 Latin America Compounded Bioidentical Hormone Therapy Market Outlook, by End User, Value (US$ Billion), 2026–2033
7.4.1 Women's health and menopause clinics
7.4.2 Integrative and functional medicine practices
7.4.3 Men's health and andrology clinics
7.4.4 Hospitals and ambulatory care settings
7.5 Latin America Compounded Bioidentical Hormone Therapy Market Outlook, by Country, Value (US$ Billion), 2026–2033
7.5.1 Brazil Compounded Bioidentical Hormone Therapy Market Outlook, by Hormone Type, 2026–2033
7.5.2 Brazil Compounded Bioidentical Hormone Therapy Market Outlook, by Dosage Form, 2026–2033
7.5.3 Brazil Compounded Bioidentical Hormone Therapy Market Outlook, by Distribution Channel, 2026–2033
7.5.4 Brazil Compounded Bioidentical Hormone Therapy Market Outlook, by End User, 2026–2033
7.5.5 Mexico Compounded Bioidentical Hormone Therapy Market Outlook, by Hormone Type, 2026–2033
7.5.6 Mexico Compounded Bioidentical Hormone Therapy Market Outlook, by Dosage Form, 2026–2033
7.5.7 Mexico Compounded Bioidentical Hormone Therapy Market Outlook, by Distribution Channel, 2026–2033
7.5.8 Mexico Compounded Bioidentical Hormone Therapy Market Outlook, by End User, 2026–2033
7.5.9 Argentina Compounded Bioidentical Hormone Therapy Market Outlook, by Hormone Type, 2026–2033
7.5.10 Argentina Compounded Bioidentical Hormone Therapy Market Outlook, by Dosage Form, 2026–2033
7.5.11 Argentina Compounded Bioidentical Hormone Therapy Market Outlook, by Distribution Channel, 2026–2033
7.5.12 Argentina Compounded Bioidentical Hormone Therapy Market Outlook, by End User, 2026–2033
7.5.13 Colombia Compounded Bioidentical Hormone Therapy Market Outlook, by Hormone Type, 2026–2033
7.5.14 Colombia Compounded Bioidentical Hormone Therapy Market Outlook, by Dosage Form, 2026–2033
7.5.15 Colombia Compounded Bioidentical Hormone Therapy Market Outlook, by Distribution Channel, 2026–2033
7.5.16 Colombia Compounded Bioidentical Hormone Therapy Market Outlook, by End User, 2026–2033
7.5.17 United States Compounded Bioidentical Hormone Therapy Market Outlook, by Hormone Type, 2026–2033
7.5.18 United States Compounded Bioidentical Hormone Therapy Market Outlook, by Dosage Form, 2026–2033
7.5.19 United States Compounded Bioidentical Hormone Therapy Market Outlook, by Distribution Channel, 2026–2033
7.5.20 United States Compounded Bioidentical Hormone Therapy Market Outlook, by End User, 2026–2033
8. Middle East & Africa Compounded Bioidentical Hormone Therapy Market Outlook, 2026–2033
8.1 Middle East & Africa Compounded Bioidentical Hormone Therapy Market Outlook, by Hormone Type, Value (US$ Billion), 2026–2033
8.1.1 Estrogen (estradiol, estriol)
8.1.2 Progesterone
8.1.3 Testosterone
8.1.4 DHEA
8.1.5 Multi-hormone combination preparations
8.2 Middle East & Africa Compounded Bioidentical Hormone Therapy Market Outlook, by Dosage Form, Value (US$ Billion), 2026–2033
8.2.1 Topical creams and gels
8.2.2 Subcutaneous pellets
8.2.3 Capsules and troches
8.2.4 Injectables
8.2.5 Others (suppositories, sublingual drops)
8.3 Middle East & Africa Compounded Bioidentical Hormone Therapy Market Outlook, by Distribution Channel, Value (US$ Billion), 2026–2033
8.3.1 Independent compounding pharmacies
8.3.2 Clinic in-office dispensing
8.3.3 Outsourcing facilities
8.3.4 Online and mail-order pharmacies
8.4 Middle East & Africa Compounded Bioidentical Hormone Therapy Market Outlook, by End User, Value (US$ Billion), 2026–2033
8.4.1 Women's health and menopause clinics
8.4.2 Integrative and functional medicine practices
8.4.3 Men's health and andrology clinics
8.4.4 Hospitals and ambulatory care settings
8.5 Middle East & Africa Compounded Bioidentical Hormone Therapy Market Outlook, by Country, Value (US$ Billion), 2026–2033
8.5.1 United Arab Emirates Compounded Bioidentical Hormone Therapy Market Outlook, by Hormone Type, 2026–2033
8.5.2 United Arab Emirates Compounded Bioidentical Hormone Therapy Market Outlook, by Dosage Form, 2026–2033
8.5.3 United Arab Emirates Compounded Bioidentical Hormone Therapy Market Outlook, by Distribution Channel, 2026–2033
8.5.4 United Arab Emirates Compounded Bioidentical Hormone Therapy Market Outlook, by End User, 2026–2033
8.5.5 Saudi Arabia Compounded Bioidentical Hormone Therapy Market Outlook, by Hormone Type, 2026–2033
8.5.6 Saudi Arabia Compounded Bioidentical Hormone Therapy Market Outlook, by Dosage Form, 2026–2033
8.5.7 Saudi Arabia Compounded Bioidentical Hormone Therapy Market Outlook, by Distribution Channel, 2026–2033
8.5.8 Saudi Arabia Compounded Bioidentical Hormone Therapy Market Outlook, by End User, 2026–2033
8.5.9 South Africa Compounded Bioidentical Hormone Therapy Market Outlook, by Hormone Type, 2026–2033
8.5.10 South Africa Compounded Bioidentical Hormone Therapy Market Outlook, by Dosage Form, 2026–2033
8.5.11 South Africa Compounded Bioidentical Hormone Therapy Market Outlook, by Distribution Channel, 2026–2033
8.5.12 South Africa Compounded Bioidentical Hormone Therapy Market Outlook, by End User, 2026–2033
9. Competitive Landscape
9.1 Industry Leaders
9.2 Company Profiles
9.2.1 Empower Pharmacy
9.2.2 Women's International Pharmacy
9.2.3 Belmar Pharma Solutions
9.2.4 Olympia Pharmaceuticals
9.2.5 BioTE Corporation
9.2.6 Fagron
9.2.7 Medisca
9.2.8 Innovation Compounding
9.2.9 Hallandale Pharmacy
9.2.10 Carie Boyd Pharmaceuticals
9.2.11 QuVa Pharma
9.2.12 Leiters Health
9.2.13 Asteria Health
9.2.14 Nephron Pharmaceuticals
9.2.15 SottoPelle
9.2.16 EVEXIAS Health Solutions
10. Appendix
10.1 Research Methodology
10.2 Report Assumptions
10.3 Acronyms and Abbreviations
| By Hormone Type | Estrogen (estradiol, estriol), Progesterone, Testosterone, DHEA, Multi-hormone combination preparations |
| By Dosage Form | Topical creams and gels, Subcutaneous pellets, Capsules and troches, Injectables, Others (suppositories, sublingual drops) |
| By Distribution Channel | Independent compounding pharmacies, Clinic in-office dispensing, Outsourcing facilities, Online and mail-order pharmacies |
| By End User | Women’s health and menopause clinics, Integrative and functional medicine practices, Men’s health and andrology clinics, Hospitals and ambulatory care settings |
| By Region | North America, Europe, Asia Pacific, Latin America, Middle East & Africa |
Our Research Methodology
Considering the volatility of business today, traditional approaches to strategizing a game plan can be unfruitful if not detrimental. True ambiguity is no way to determine a forecast. A myriad of predetermined factors must be accounted for such as the degree of risk involved, the magnitude of circumstances, as well as conditions or consequences that are not known or unpredictable. To circumvent binary views that cast uncertainty, the application of market research intelligence to strategically posture, move, and enable actionable outcomes is necessary.
View Methodology
Quality Assured
Rigorous Validation Process

Confidentiality Assured
End-to-end Data Security

Custom Research Services
Tailored To Your Objectives
FAQs
The market is valued at US$ 1.8 billion in 2026 and is projected to reach US$ 2.87 billion by 2033.
The market is expected to grow at a 6.9% CAGR between 2026 and 2033, adding an absolute opportunity of US$ 1.07 billion.
Estrogen-based preparations lead with 38% share in 2026, while testosterone preparations grow fastest at an 8.1% CAGR through 2033 across men’s health clinics.
North America holds 58% share in 2026, supported by its specialty clinic base, while Asia Pacific grows fastest at an 8.9% CAGR through 2033.
Yes, the market is fragmented across independent 503A pharmacies, 503B outsourcing facilities and clinic dispensing networks, with no single operator holding dominant national scale.
Related Reports
Monogenic Diseases Market Size, Share, Insights, Competitive Landscape, and Forecast 2026 to 2033
Explore the monogenic diseases market, forecast to reach US$34.9 billion by 2033 at 9.4% CAGR, with insights on diseases, offerings, technology, and regions.
Juvenile Macular Degeneration Treatment Market Size, Share, Insights, Competitive Landscape, and Forecast 2026 to 2033
Explore the juvenile macular degeneration treatment market, forecast to reach US$2.08 billion by 2033 at 8.4% CAGR, with offering and regional insights.
Iron Deficiency Anemia Treatment Market Size, Share, Insights, Competitive Landscape, and Forecast 2026 to 2033
Explore the iron deficiency anemia treatment market, forecast to reach US$9.08 billion by 2033 at 8.1% CAGR, with therapy, end-user, and regional insights.
Bronchodilators Market Size, Share, Insights, Competitive Landscape, and Forecast 2026 to 2033
Explore the bronchodilators market, forecast to reach US$40.0 billion by 2033 at 4.6% CAGR, with insights on drug classes, devices, channels, and regions.
Asthma Treatment Market Size, Share, Insights, Competitive Landscape, and Forecast 2026 to 2033
Explore the asthma treatment market outlook for 2026–2033, covering drug classes, devices, distribution channels, patient segments, and regions.
AAV Gene Therapy vs Retroviral Gene Therapy Market Size, Share, Insights, Competitive Landscape, and Forecast 2026 to 2033
Explore AAV vs retroviral gene therapy, a market forecast to reach US$23.02 billion by 2033 at 25.4% CAGR, with insights on vectors, uses, and regions.