



Juvenile Macular Degeneration Treatment Market
Juvenile Macular Degeneration Treatment Market Size, Share, Insights, Competitive Landscape, and Forecast 2026 to 2033
Report Overview
Juvenile Macular Degeneration Treatment Market Size and Trend Analysis
What Is Driving Growth in Juvenile Macular Degeneration Care?
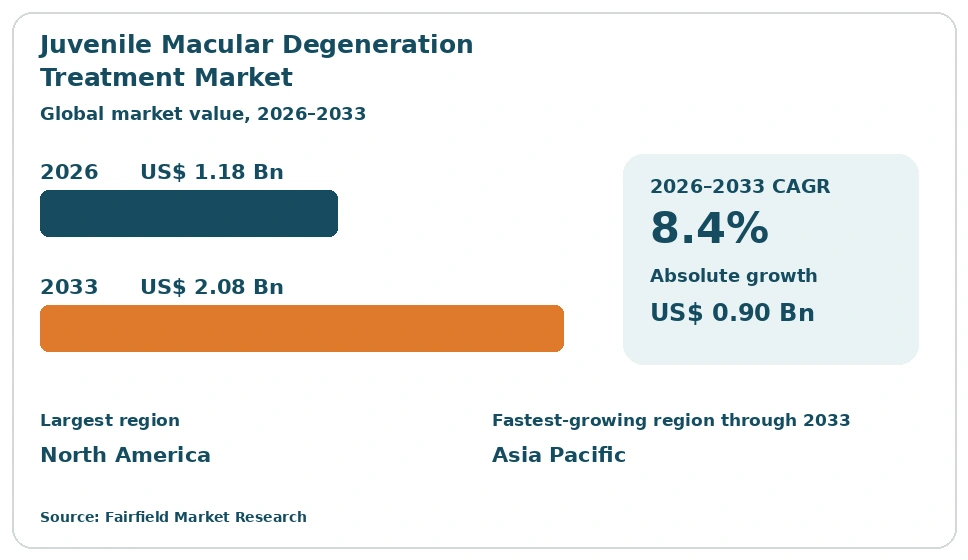
The global Juvenile Macular Degeneration Treatment market size is expected to be valued at US$ 1.18 billion in 2026 and projected to reach US$ 2.08 billion by 2033, growing at a CAGR of 8.4% between 2026 and 2033. Growth rests mainly on wider genetic testing, better retinal imaging access and steady demand for low-vision support, rather than on approved disease-modifying therapy. Most inherited juvenile macular dystrophies still have no approved treatment that alters disease course, so diagnosis, counselling and rehabilitation carry most spending. Research funding for investigational programmes adds a smaller but rising share, lifting the absolute dollar opportunity to US$ 900 million over the period.
Key Report Takeaways
- By Condition Type: Stargardt disease led with 46.8% share in 2026, while X-linked juvenile retinoschisis is projected to expand at a 9.6% CAGR through 2033, driven by wider panel-based genetic confirmation in paediatric ophthalmology clinics.
- By Offering: Diagnostic testing and imaging led with 31.5% share in 2026, while genetic testing and counselling services are projected to expand at a 10.3% CAGR through 2033, driven by falling sequencing costs and growing family cascade testing.
- By Technology or Approach: Retinal imaging and electrophysiology led with 34.2% share in 2026, while gene-based investigational approaches are projected to expand at a 12.1% CAGR through 2033, driven by rising preclinical and clinical research spending on ocular vectors.
- By End User: Specialty ophthalmology and retina centres led with 38.6% share in 2026, while research institutes and clinical trial sites are projected to expand at an 11.2% CAGR through 2033, driven by orphan designation incentives supporting natural history study enrolment.
- By Region: North America led with 42.6% share in 2026, while Asia Pacific is projected to expand at a 10.8% CAGR through 2033; Europe, Latin America and Middle East & Africa follow, driven by widening molecular diagnostic reimbursement.
Market Trends and Insights
Market Growth Drivers
Wider Genetic Testing Is Expanding the Confirmed Patient Base
Broader access to multi-gene retinal panels is lifting demand across the full care pathway. A confirmed molecular diagnosis moves a family from general ophthalmology into specialist retina services, where imaging, counselling and rehabilitation are billed as a continuing episode rather than a single visit. That shift raises revenue per patient without any change in treatment availability, and widens the base that device, laboratory and rehabilitation suppliers serve.
Sequencing costs have fallen, and inherited retinal disease panels now sit within routine laboratory menus rather than research settings. Paediatric ophthalmology units order genotyping when a child presents with unexplained central vision loss, and cascade testing extends the same panel to siblings and parents. Regulators including the FDA and the EMA maintain orphan frameworks that reward well-characterised patient registries, keeping laboratories, imaging vendors and academic centres invested in genotype documentation.
Orphan Frameworks Are Sustaining Research Investment
Orphan designation economics keep capital flowing into juvenile macular dystrophy research even though no disease-modifying therapy is approved for most of these conditions. Development incentives, fee relief and extended exclusivity make small patient populations commercially workable, supporting steady spending on investigational programmes, natural history studies and trial site infrastructure. For suppliers, that spending appears as demand for imaging endpoints, genotyping, reading centre services and specialised clinical operations rather than as product sales.
The FDA and the EMA both operate rare disease pathways, and gene therapy and small-molecule programmes in inherited retinal disease remain investigational rather than approved. Biotechnology firms, academic groups and patient organisations share registry data to define endpoints, since central vision measures in children are difficult to standardise. Investment also goes into manufacturing capacity for ocular vectors, an area where contract development organisations have added capability.
Restraints Impact Analysis of Market
Absence of Approved Disease-Modifying Therapy Caps Revenue Depth
Revenue stays shallow because most juvenile macular dystrophies have no approved therapy that changes disease course. Spending concentrates in one-time diagnostic work and in rehabilitation services that are often reimbursed at modest rates, so the per-patient value of a confirmed case sits far below that of chronic retinal disease treated with repeated injections. Suppliers of imaging systems and genetic panels capture value once, while follow-up visits generate limited incremental billing.
This structure also shapes investment behaviour. Payers in several markets classify low-vision aids and rehabilitation as optional benefits, which leaves families covering part of the cost themselves. Device makers face a small, dispersed buyer base, and distribution economics are difficult outside large referral centres. Because clinical endpoints in slowly progressing dystrophies take years to read out, development timelines stay long, and smaller firms frequently depend on partnership funding to maintain programmes.
Diagnostic Delay and Uneven Specialist Access Restrict Market Reach
Long delays between first symptoms and a molecular diagnosis hold back market reach. Children with early central vision loss are often assessed first for refractive error or behavioural causes, and referral to a retina subspecialist can take years. Every year of delay postpones the imaging, genotyping and rehabilitation spending that defines this market, and reduces the number of families who ever reach a service capable of recording a genotype.
Specialist capacity is concentrated in a small number of academic retina centres, and genetic counselling capacity is scarcer still. Many health systems have few counsellors trained in ophthalmic genetics, so results can be returned without the support families need to understand them. Travel distance, school schedules and the cost of repeated visits add further barriers. In lower-income settings, electrophysiology and high-resolution imaging equipment is limited, leaving many cases genetically unconfirmed.
Market Opportunities
Building Genetic Counselling Capacity Creates a Durable Service Market
Genetic counselling is the clearest unmet service need in this market, and it carries recurring revenue rather than one-time device sales. Families who receive a molecular result need help interpreting inheritance patterns, planning for siblings and understanding what is and is not currently available. Health systems, laboratories and specialist clinics can bill for structured counselling sessions, remote follow-up and family cascade coordination, creating a service line independent of therapeutic approval.
Telegenetics has made this practical, since counselling does not require the patient to be physically present. Laboratories have begun bundling interpretation support with panel results, and several national health services have added ophthalmic genetics posts. Professional bodies have expanded training routes for counsellors, and registries maintained by patient organisations help match families to appropriate centres. Growth here depends on workforce funding and reimbursement codes rather than on scientific progress.
Digital and Optical Low-Vision Technology Opens Recurring Demand
Low-vision technology is the segment where suppliers can sell repeatedly to the same household over many years. Children with central vision loss need magnification, contrast enhancement and reading support that changes as they move through school and into work. Electronic magnifiers, head-worn display systems, screen readers and smartphone-based tools create replacement cycles and subscription revenue, giving manufacturers a commercial base that does not depend on any therapeutic milestone.
Mainstream consumer hardware has absorbed much of this functionality, lowering the price of entry and widening distribution beyond specialist dealers. Education authorities in several countries fund assistive technology for pupils with certified vision impairment, which creates institutional purchasing alongside household spending. Rehabilitation centres increasingly combine device provision with orientation training and workplace assessment. The main constraint is cost coverage, since families without assistive technology benefits meet much of the expense directly.
Category-wise Insights
Which Condition Type Accounts for the Largest Share of Spending?
Stargardt disease accounts for the largest share, at 46.8% of the market in 2026, because it is the most frequently identified juvenile macular dystrophy and carries the broadest diagnostic workload. Confirmed cases draw sustained spending on serial imaging, autofluorescence assessment and low-vision support across childhood and early adulthood. X-linked juvenile retinoschisis is the fastest-growing condition type, at a 9.6% CAGR between 2026 and 2033, as panel testing identifies boys previously recorded only as having unexplained reduced acuity. Investigational programmes target this condition, none of them approved, and that research activity itself increases demand for electroretinography and structural imaging at trial-capable sites. Best disease and the remaining dystrophies divide the balance. For the wider market, diagnostic and monitoring capacity, rather than therapeutic supply, remains the practical constraint on growth.
Diagnostic Testing and Imaging Anchors Offering Revenue
Diagnostic testing and imaging holds 31.5% of offering revenue in 2026, reflecting the central role of optical coherence tomography, fundus autofluorescence and electrophysiology in characterising these conditions. Equipment is durable and already installed in most retina units, so revenue comes from service contracts, software upgrades and procedure volumes. Genetic testing and counselling services grow fastest, at a 10.3% CAGR through 2033, as sequencing prices fall and cascade testing spreads within families. The split matters commercially, since imaging revenue is tied to installed base while counselling revenue is tied to workforce capacity. Suppliers combining panel interpretation with structured family support are better placed than those selling either element alone, and health systems planning rare disease pathways now budget for both lines separately rather than as a single diagnostic item.
Which Technology Approach Is Growing Fastest in This Market?
Gene-based investigational approaches are growing fastest, at a 12.1% CAGR between 2026 and 2033, measured by research and development spending rather than by product sales. None of these approaches is an approved treatment for the conditions covered here, and the expenditure reflects vector manufacturing, trial operations and endpoint development. Retinal imaging and electrophysiology remains the largest approach, at 34.2% share in 2026, because every diagnostic and monitoring pathway depends on it. Assistive optical and digital technologies hold a substantial position, at 20.4% share in 2026, and serve patients regardless of therapeutic status. The practical reading for strategy teams is that near-term revenue sits with imaging, sequencing and assistive technology, while gene-based work represents investment exposure whose commercial outcome is undetermined.
Specialty Retina Centres Remain the Core End User
Specialty ophthalmology and retina centres hold 38.6% of end user demand in 2026, since they concentrate the imaging equipment, subspecialist expertise and genetic referral routes these conditions require. Hospitals follow, mainly where paediatric services and ophthalmology sit under one roof. Research institutes and clinical trial sites are the fastest-growing end user, at an 11.2% CAGR through 2033, reflecting orphan designation incentives and the number of natural history studies now recruiting. Genetic testing laboratories expand alongside both, supported by falling sequencing costs. The concentration of demand in a few centres is a structural weakness as much as a commercial fact, because families outside their catchment often go without confirmation, and suppliers seeking volume growth must support decentralised imaging and remote counselling.
Geography Analysis
Which Region Is Leading the Juvenile Macular Degeneration Treatment Market?
North America leads the market, with 42.6% share in 2026, supported by dense subspecialty retina coverage and established rare disease pathways. The United States contributes most of this, through academic eye institutes, commercial genetic testing laboratories and sustained federal and foundation research funding. Canada adds smaller but stable volumes through provincial genetic services. Orphan designation incentives administered by the FDA have drawn a large share of inherited retinal disease programmes to the region, which concentrates trial site activity and associated imaging demand. Insurance coverage for molecular diagnostics has widened, though low-vision aids remain inconsistently reimbursed, leaving families to meet part of the cost of assistive technology themselves.
Public Rare Disease Networks Underpin European Demand
Europe holds 27.8% share in 2026, built on publicly funded rare disease networks that formalise referral from general ophthalmology to specialist centres. Germany, the United Kingdom, France, Italy and the Netherlands carry most activity, each with designated ophthalmic genetics services and long-running patient registries. The EMA orphan framework and European Reference Networks help standardise diagnostic protocols across borders, supporting consistent panel use and shared natural history data. Reimbursement for genetic testing is broader than in most regions, and several national systems fund low-vision rehabilitation as a statutory benefit. Counsellor shortages and waiting times for specialist appointments remain the main constraints on regional growth.
Which Region Is Growing Fastest in the Juvenile Macular Degeneration Treatment Market?
Asia Pacific is growing fastest, at a 10.8% CAGR between 2026 and 2033, from a 19.4% share in 2026. China, Japan, India, South Korea and Australia drive this, as tertiary hospitals add paediatric retina units and domestic laboratories bring sequencing costs down. Large birth cohorts and improving school vision screening raise the number of children reaching ophthalmic assessment. Japan and Australia already operate established ophthalmic genetics services, while China and India are expanding molecular diagnostic reimbursement and building registry infrastructure. Growth is uneven, since specialist capacity outside major cities is thin, and counselling workforce development lags the pace of testing expansion.
Academic Hospitals Carry Latin American Diagnostic Capacity
Latin America accounts for 5.9% share in 2026, with activity concentrated in Brazil, Mexico, Argentina and Chile. University hospitals in the largest cities host most inherited retinal disease expertise, and several maintain genotype registries built through academic collaboration. Public health systems cover ophthalmic examination more consistently than molecular testing, so many families rely on research studies or philanthropic programmes for sequencing. Imported imaging equipment and assistive devices carry tariff and currency exposure, which keeps unit prices high relative to household income. Growth depends on extending molecular diagnostic reimbursement, on local assembly or distribution agreements for low-vision devices, and on training counsellors outside the main metropolitan centres.
Genomics Investment Shapes Middle East & Africa Uptake
Middle East & Africa holds 4.3% share in 2026, the smallest regional position, though consanguinity in parts of the region raises the frequency of recessive inherited retinal conditions. Saudi Arabia, the United Arab Emirates, Israel and South Africa account for most diagnostic capacity, supported by specialist eye hospitals and national genomics programmes. Gulf states have invested in sequencing infrastructure and premarital screening, which improves case identification. Across much of sub-Saharan Africa, electrophysiology and high-resolution retinal imaging are available at very few sites, and counselling services are minimal. Growth will track national genomics funding, cross-border referral arrangements and the gradual build-out of paediatric ophthalmology networks.
Competitive Landscape
The market is fragmented, and no single company holds a dominant position across its diagnostic, assistive and investigational segments. Established imaging and sequencing manufacturers such as Carl Zeiss Meditec AG, Topcon Corporation, Heidelberg Engineering GmbH and Illumina, Inc. supply the infrastructure on which diagnosis depends, and their positions are stable. The therapeutic side is populated largely by clinical-stage biotechnology firms, which leaves competitive structure there unsettled.
Competition in the diagnostic segment turns on image resolution, analysis software, workflow integration and service coverage rather than on price alone. In genetic testing, laboratories compete on panel breadth, variant interpretation quality and turnaround time. Assistive technology suppliers including Nidek Co., Ltd. and Eschenbach Optik GmbH compete on portability, cost and compatibility with mainstream consumer devices, an area where smartphone-based tools have reset buyer expectations.
Strategic activity centres on capability rather than scale. Large pharmaceutical groups including Novartis AG and Johnson & Johnson have built ocular gene therapy capability through collaboration with specialists such as MeiraGTx Holdings plc, which gives them manufacturing and vector expertise without internal duplication. Smaller firms including Beacon Therapeutics, Atsena Therapeutics, Inc., Nanoscope Therapeutics, Inc., SparingVision SAS, Ocugen, Inc. and 4D Molecular Therapeutics, Inc. maintain investigational programmes in inherited retinal disease, work that has not produced an approved therapy for most juvenile macular dystrophies.
Competitive direction is set by registry access, trial site relationships and the ability to support families through diagnosis rather than by any approved product. Firms that connect genotyping, monitoring and rehabilitation into one pathway sit differently from those supplying a single component.
Industry Leaders
- Novartis AG
- Johnson & Johnson
- MeiraGTx Holdings plc
- Carl Zeiss Meditec AG
- Topcon Corporation
- Heidelberg Engineering GmbH
- Illumina, Inc.
- Nidek Co., Ltd.
Companies Covered in the Report
- Novartis AG
- Johnson & Johnson
- MeiraGTx Holdings plc
- Beacon Therapeutics
- Atsena Therapeutics, Inc.
- Nanoscope Therapeutics, Inc.
- SparingVision SAS
- Ocugen, Inc.
- 4D Molecular Therapeutics, Inc.
- Carl Zeiss Meditec AG
- Topcon Corporation
- Heidelberg Engineering GmbH
- Illumina, Inc.
- Nidek Co., Ltd.
- Eschenbach Optik GmbH
Juvenile Macular Degeneration Treatment Market Report Scope
The market is segmented by condition type, offering, technology or approach, end user and region.
| By Condition Type | Stargardt Disease, Best Disease, X-linked Juvenile Retinoschisis, Other Juvenile Macular Dystrophies |
| By Offering | Diagnostic Testing and Imaging, Genetic Testing and Counselling Services, Low-Vision Aids and Rehabilitation, Supportive Pharmacotherapy and Nutritional Management, Investigational Therapeutics |
| By Technology or Approach | Retinal Imaging and Electrophysiology, Next-Generation Sequencing and Genetic Panels, Assistive Optical and Digital Vision Technologies, Gene-Based Investigational Approaches, Cell-Based and Other Investigational Approaches |
| By End User | Specialty Ophthalmology and Retina Centres, Hospitals, Genetic Testing Laboratories, Low-Vision Rehabilitation Centres and Homecare, Research Institutes and Clinical Trial Sites |
| By Region | North America, Europe, Asia Pacific, Latin America, Middle East & Africa |
1. Executive Summary
1.1 Juvenile Macular Degeneration Treatment Market Snapshot
1.2 Future Projections
1.3 Key Market Trends
1.4 Regional Snapshot
2. Market Overview
2.1 Market Definition and Report Scope
2.2 Historical Market Trends
2.3 Market Dynamics
2.3.1 Drivers
2.3.2 Restraints
2.3.3 Market Opportunities
3. Global Juvenile Macular Degeneration Treatment Market Outlook, 2026–2033
3.1 Global Juvenile Macular Degeneration Treatment Market Outlook, by Condition Type, Value (US$ Billion), 2026–2033
3.1.1 Stargardt Disease
3.1.2 Best Disease
3.1.3 X-linked Juvenile Retinoschisis
3.1.4 Other Juvenile Macular Dystrophies
3.2 Global Juvenile Macular Degeneration Treatment Market Outlook, by Offering, Value (US$ Billion), 2026–2033
3.2.1 Diagnostic Testing and Imaging
3.2.2 Genetic Testing and Counselling Services
3.2.3 Low-Vision Aids and Rehabilitation
3.2.4 Supportive Pharmacotherapy and Nutritional Management
3.2.5 Investigational Therapeutics
3.3 Global Juvenile Macular Degeneration Treatment Market Outlook, by Technology or Approach, Value (US$ Billion), 2026–2033
3.3.1 Retinal Imaging and Electrophysiology
3.3.2 Next-Generation Sequencing and Genetic Panels
3.3.3 Assistive Optical and Digital Vision Technologies
3.3.4 Gene-Based Investigational Approaches
3.3.5 Cell-Based and Other Investigational Approaches
3.4 Global Juvenile Macular Degeneration Treatment Market Outlook, by End User, Value (US$ Billion), 2026–2033
3.4.1 Specialty Ophthalmology and Retina Centres
3.4.2 Hospitals
3.4.3 Genetic Testing Laboratories
3.4.4 Low-Vision Rehabilitation Centres and Homecare
3.4.5 Research Institutes and Clinical Trial Sites
3.5 Global Juvenile Macular Degeneration Treatment Market Outlook, by Region, Value (US$ Billion), 2026–2033
3.5.1 North America
3.5.2 Europe
3.5.3 Asia Pacific
3.5.4 Latin America
3.5.5 Middle East & Africa
4. North America Juvenile Macular Degeneration Treatment Market Outlook, 2026–2033
4.1 North America Juvenile Macular Degeneration Treatment Market Outlook, by Condition Type, Value (US$ Billion), 2026–2033
4.1.1 Stargardt Disease
4.1.2 Best Disease
4.1.3 X-linked Juvenile Retinoschisis
4.1.4 Other Juvenile Macular Dystrophies
4.2 North America Juvenile Macular Degeneration Treatment Market Outlook, by Offering, Value (US$ Billion), 2026–2033
4.2.1 Diagnostic Testing and Imaging
4.2.2 Genetic Testing and Counselling Services
4.2.3 Low-Vision Aids and Rehabilitation
4.2.4 Supportive Pharmacotherapy and Nutritional Management
4.2.5 Investigational Therapeutics
4.3 North America Juvenile Macular Degeneration Treatment Market Outlook, by Technology or Approach, Value (US$ Billion), 2026–2033
4.3.1 Retinal Imaging and Electrophysiology
4.3.2 Next-Generation Sequencing and Genetic Panels
4.3.3 Assistive Optical and Digital Vision Technologies
4.3.4 Gene-Based Investigational Approaches
4.3.5 Cell-Based and Other Investigational Approaches
4.4 North America Juvenile Macular Degeneration Treatment Market Outlook, by End User, Value (US$ Billion), 2026–2033
4.4.1 Specialty Ophthalmology and Retina Centres
4.4.2 Hospitals
4.4.3 Genetic Testing Laboratories
4.4.4 Low-Vision Rehabilitation Centres and Homecare
4.4.5 Research Institutes and Clinical Trial Sites
4.5 North America Juvenile Macular Degeneration Treatment Market Outlook, by Country, Value (US$ Billion), 2026–2033
4.5.1 United States Juvenile Macular Degeneration Treatment Market Outlook, by Condition Type, 2026–2033
4.5.2 United States Juvenile Macular Degeneration Treatment Market Outlook, by Offering, 2026–2033
4.5.3 United States Juvenile Macular Degeneration Treatment Market Outlook, by Technology or Approach, 2026–2033
4.5.4 United States Juvenile Macular Degeneration Treatment Market Outlook, by End User, 2026–2033
4.5.5 Canada Juvenile Macular Degeneration Treatment Market Outlook, by Condition Type, 2026–2033
4.5.6 Canada Juvenile Macular Degeneration Treatment Market Outlook, by Offering, 2026–2033
4.5.7 Canada Juvenile Macular Degeneration Treatment Market Outlook, by Technology or Approach, 2026–2033
4.5.8 Canada Juvenile Macular Degeneration Treatment Market Outlook, by End User, 2026–2033
5. Europe Juvenile Macular Degeneration Treatment Market Outlook, 2026–2033
5.1 Europe Juvenile Macular Degeneration Treatment Market Outlook, by Condition Type, Value (US$ Billion), 2026–2033
5.1.1 Stargardt Disease
5.1.2 Best Disease
5.1.3 X-linked Juvenile Retinoschisis
5.1.4 Other Juvenile Macular Dystrophies
5.2 Europe Juvenile Macular Degeneration Treatment Market Outlook, by Offering, Value (US$ Billion), 2026–2033
5.2.1 Diagnostic Testing and Imaging
5.2.2 Genetic Testing and Counselling Services
5.2.3 Low-Vision Aids and Rehabilitation
5.2.4 Supportive Pharmacotherapy and Nutritional Management
5.2.5 Investigational Therapeutics
5.3 Europe Juvenile Macular Degeneration Treatment Market Outlook, by Technology or Approach, Value (US$ Billion), 2026–2033
5.3.1 Retinal Imaging and Electrophysiology
5.3.2 Next-Generation Sequencing and Genetic Panels
5.3.3 Assistive Optical and Digital Vision Technologies
5.3.4 Gene-Based Investigational Approaches
5.3.5 Cell-Based and Other Investigational Approaches
5.4 Europe Juvenile Macular Degeneration Treatment Market Outlook, by End User, Value (US$ Billion), 2026–2033
5.4.1 Specialty Ophthalmology and Retina Centres
5.4.2 Hospitals
5.4.3 Genetic Testing Laboratories
5.4.4 Low-Vision Rehabilitation Centres and Homecare
5.4.5 Research Institutes and Clinical Trial Sites
5.5 Europe Juvenile Macular Degeneration Treatment Market Outlook, by Country, Value (US$ Billion), 2026–2033
5.5.1 Germany Juvenile Macular Degeneration Treatment Market Outlook, by Condition Type, 2026–2033
5.5.2 Germany Juvenile Macular Degeneration Treatment Market Outlook, by Offering, 2026–2033
5.5.3 Germany Juvenile Macular Degeneration Treatment Market Outlook, by Technology or Approach, 2026–2033
5.5.4 Germany Juvenile Macular Degeneration Treatment Market Outlook, by End User, 2026–2033
5.5.5 United Kingdom Juvenile Macular Degeneration Treatment Market Outlook, by Condition Type, 2026–2033
5.5.6 United Kingdom Juvenile Macular Degeneration Treatment Market Outlook, by Offering, 2026–2033
5.5.7 United Kingdom Juvenile Macular Degeneration Treatment Market Outlook, by Technology or Approach, 2026–2033
5.5.8 United Kingdom Juvenile Macular Degeneration Treatment Market Outlook, by End User, 2026–2033
5.5.9 France Juvenile Macular Degeneration Treatment Market Outlook, by Condition Type, 2026–2033
5.5.10 France Juvenile Macular Degeneration Treatment Market Outlook, by Offering, 2026–2033
5.5.11 France Juvenile Macular Degeneration Treatment Market Outlook, by Technology or Approach, 2026–2033
5.5.12 France Juvenile Macular Degeneration Treatment Market Outlook, by End User, 2026–2033
5.5.13 Italy Juvenile Macular Degeneration Treatment Market Outlook, by Condition Type, 2026–2033
5.5.14 Italy Juvenile Macular Degeneration Treatment Market Outlook, by Offering, 2026–2033
5.5.15 Italy Juvenile Macular Degeneration Treatment Market Outlook, by Technology or Approach, 2026–2033
5.5.16 Italy Juvenile Macular Degeneration Treatment Market Outlook, by End User, 2026–2033
5.5.17 Netherlands Juvenile Macular Degeneration Treatment Market Outlook, by Condition Type, 2026–2033
5.5.18 Netherlands Juvenile Macular Degeneration Treatment Market Outlook, by Offering, 2026–2033
5.5.19 Netherlands Juvenile Macular Degeneration Treatment Market Outlook, by Technology or Approach, 2026–2033
5.5.20 Netherlands Juvenile Macular Degeneration Treatment Market Outlook, by End User, 2026–2033
6. Asia Pacific Juvenile Macular Degeneration Treatment Market Outlook, 2026–2033
6.1 Asia Pacific Juvenile Macular Degeneration Treatment Market Outlook, by Condition Type, Value (US$ Billion), 2026–2033
6.1.1 Stargardt Disease
6.1.2 Best Disease
6.1.3 X-linked Juvenile Retinoschisis
6.1.4 Other Juvenile Macular Dystrophies
6.2 Asia Pacific Juvenile Macular Degeneration Treatment Market Outlook, by Offering, Value (US$ Billion), 2026–2033
6.2.1 Diagnostic Testing and Imaging
6.2.2 Genetic Testing and Counselling Services
6.2.3 Low-Vision Aids and Rehabilitation
6.2.4 Supportive Pharmacotherapy and Nutritional Management
6.2.5 Investigational Therapeutics
6.3 Asia Pacific Juvenile Macular Degeneration Treatment Market Outlook, by Technology or Approach, Value (US$ Billion), 2026–2033
6.3.1 Retinal Imaging and Electrophysiology
6.3.2 Next-Generation Sequencing and Genetic Panels
6.3.3 Assistive Optical and Digital Vision Technologies
6.3.4 Gene-Based Investigational Approaches
6.3.5 Cell-Based and Other Investigational Approaches
6.4 Asia Pacific Juvenile Macular Degeneration Treatment Market Outlook, by End User, Value (US$ Billion), 2026–2033
6.4.1 Specialty Ophthalmology and Retina Centres
6.4.2 Hospitals
6.4.3 Genetic Testing Laboratories
6.4.4 Low-Vision Rehabilitation Centres and Homecare
6.4.5 Research Institutes and Clinical Trial Sites
6.5 Asia Pacific Juvenile Macular Degeneration Treatment Market Outlook, by Country, Value (US$ Billion), 2026–2033
6.5.1 China Juvenile Macular Degeneration Treatment Market Outlook, by Condition Type, 2026–2033
6.5.2 China Juvenile Macular Degeneration Treatment Market Outlook, by Offering, 2026–2033
6.5.3 China Juvenile Macular Degeneration Treatment Market Outlook, by Technology or Approach, 2026–2033
6.5.4 China Juvenile Macular Degeneration Treatment Market Outlook, by End User, 2026–2033
6.5.5 Japan Juvenile Macular Degeneration Treatment Market Outlook, by Condition Type, 2026–2033
6.5.6 Japan Juvenile Macular Degeneration Treatment Market Outlook, by Offering, 2026–2033
6.5.7 Japan Juvenile Macular Degeneration Treatment Market Outlook, by Technology or Approach, 2026–2033
6.5.8 Japan Juvenile Macular Degeneration Treatment Market Outlook, by End User, 2026–2033
6.5.9 India Juvenile Macular Degeneration Treatment Market Outlook, by Condition Type, 2026–2033
6.5.10 India Juvenile Macular Degeneration Treatment Market Outlook, by Offering, 2026–2033
6.5.11 India Juvenile Macular Degeneration Treatment Market Outlook, by Technology or Approach, 2026–2033
6.5.12 India Juvenile Macular Degeneration Treatment Market Outlook, by End User, 2026–2033
6.5.13 South Korea Juvenile Macular Degeneration Treatment Market Outlook, by Condition Type, 2026–2033
6.5.14 South Korea Juvenile Macular Degeneration Treatment Market Outlook, by Offering, 2026–2033
6.5.15 South Korea Juvenile Macular Degeneration Treatment Market Outlook, by Technology or Approach, 2026–2033
6.5.16 South Korea Juvenile Macular Degeneration Treatment Market Outlook, by End User, 2026–2033
6.5.17 Australia Juvenile Macular Degeneration Treatment Market Outlook, by Condition Type, 2026–2033
6.5.18 Australia Juvenile Macular Degeneration Treatment Market Outlook, by Offering, 2026–2033
6.5.19 Australia Juvenile Macular Degeneration Treatment Market Outlook, by Technology or Approach, 2026–2033
6.5.20 Australia Juvenile Macular Degeneration Treatment Market Outlook, by End User, 2026–2033
7. Latin America Juvenile Macular Degeneration Treatment Market Outlook, 2026–2033
7.1 Latin America Juvenile Macular Degeneration Treatment Market Outlook, by Condition Type, Value (US$ Billion), 2026–2033
7.1.1 Stargardt Disease
7.1.2 Best Disease
7.1.3 X-linked Juvenile Retinoschisis
7.1.4 Other Juvenile Macular Dystrophies
7.2 Latin America Juvenile Macular Degeneration Treatment Market Outlook, by Offering, Value (US$ Billion), 2026–2033
7.2.1 Diagnostic Testing and Imaging
7.2.2 Genetic Testing and Counselling Services
7.2.3 Low-Vision Aids and Rehabilitation
7.2.4 Supportive Pharmacotherapy and Nutritional Management
7.2.5 Investigational Therapeutics
7.3 Latin America Juvenile Macular Degeneration Treatment Market Outlook, by Technology or Approach, Value (US$ Billion), 2026–2033
7.3.1 Retinal Imaging and Electrophysiology
7.3.2 Next-Generation Sequencing and Genetic Panels
7.3.3 Assistive Optical and Digital Vision Technologies
7.3.4 Gene-Based Investigational Approaches
7.3.5 Cell-Based and Other Investigational Approaches
7.4 Latin America Juvenile Macular Degeneration Treatment Market Outlook, by End User, Value (US$ Billion), 2026–2033
7.4.1 Specialty Ophthalmology and Retina Centres
7.4.2 Hospitals
7.4.3 Genetic Testing Laboratories
7.4.4 Low-Vision Rehabilitation Centres and Homecare
7.4.5 Research Institutes and Clinical Trial Sites
7.5 Latin America Juvenile Macular Degeneration Treatment Market Outlook, by Country, Value (US$ Billion), 2026–2033
7.5.1 Brazil Juvenile Macular Degeneration Treatment Market Outlook, by Condition Type, 2026–2033
7.5.2 Brazil Juvenile Macular Degeneration Treatment Market Outlook, by Offering, 2026–2033
7.5.3 Brazil Juvenile Macular Degeneration Treatment Market Outlook, by Technology or Approach, 2026–2033
7.5.4 Brazil Juvenile Macular Degeneration Treatment Market Outlook, by End User, 2026–2033
7.5.5 Mexico Juvenile Macular Degeneration Treatment Market Outlook, by Condition Type, 2026–2033
7.5.6 Mexico Juvenile Macular Degeneration Treatment Market Outlook, by Offering, 2026–2033
7.5.7 Mexico Juvenile Macular Degeneration Treatment Market Outlook, by Technology or Approach, 2026–2033
7.5.8 Mexico Juvenile Macular Degeneration Treatment Market Outlook, by End User, 2026–2033
7.5.9 Argentina Juvenile Macular Degeneration Treatment Market Outlook, by Condition Type, 2026–2033
7.5.10 Argentina Juvenile Macular Degeneration Treatment Market Outlook, by Offering, 2026–2033
7.5.11 Argentina Juvenile Macular Degeneration Treatment Market Outlook, by Technology or Approach, 2026–2033
7.5.12 Argentina Juvenile Macular Degeneration Treatment Market Outlook, by End User, 2026–2033
7.5.13 Chile Juvenile Macular Degeneration Treatment Market Outlook, by Condition Type, 2026–2033
7.5.14 Chile Juvenile Macular Degeneration Treatment Market Outlook, by Offering, 2026–2033
7.5.15 Chile Juvenile Macular Degeneration Treatment Market Outlook, by Technology or Approach, 2026–2033
7.5.16 Chile Juvenile Macular Degeneration Treatment Market Outlook, by End User, 2026–2033
8. Middle East & Africa Juvenile Macular Degeneration Treatment Market Outlook, 2026–2033
8.1 Middle East & Africa Juvenile Macular Degeneration Treatment Market Outlook, by Condition Type, Value (US$ Billion), 2026–2033
8.1.1 Stargardt Disease
8.1.2 Best Disease
8.1.3 X-linked Juvenile Retinoschisis
8.1.4 Other Juvenile Macular Dystrophies
8.2 Middle East & Africa Juvenile Macular Degeneration Treatment Market Outlook, by Offering, Value (US$ Billion), 2026–2033
8.2.1 Diagnostic Testing and Imaging
8.2.2 Genetic Testing and Counselling Services
8.2.3 Low-Vision Aids and Rehabilitation
8.2.4 Supportive Pharmacotherapy and Nutritional Management
8.2.5 Investigational Therapeutics
8.3 Middle East & Africa Juvenile Macular Degeneration Treatment Market Outlook, by Technology or Approach, Value (US$ Billion), 2026–2033
8.3.1 Retinal Imaging and Electrophysiology
8.3.2 Next-Generation Sequencing and Genetic Panels
8.3.3 Assistive Optical and Digital Vision Technologies
8.3.4 Gene-Based Investigational Approaches
8.3.5 Cell-Based and Other Investigational Approaches
8.4 Middle East & Africa Juvenile Macular Degeneration Treatment Market Outlook, by End User, Value (US$ Billion), 2026–2033
8.4.1 Specialty Ophthalmology and Retina Centres
8.4.2 Hospitals
8.4.3 Genetic Testing Laboratories
8.4.4 Low-Vision Rehabilitation Centres and Homecare
8.4.5 Research Institutes and Clinical Trial Sites
8.5 Middle East & Africa Juvenile Macular Degeneration Treatment Market Outlook, by Country and Subregion, Value (US$ Billion), 2026–2033
8.5.1 Saudi Arabia Juvenile Macular Degeneration Treatment Market Outlook, by Condition Type, 2026–2033
8.5.2 Saudi Arabia Juvenile Macular Degeneration Treatment Market Outlook, by Offering, 2026–2033
8.5.3 Saudi Arabia Juvenile Macular Degeneration Treatment Market Outlook, by Technology or Approach, 2026–2033
8.5.4 Saudi Arabia Juvenile Macular Degeneration Treatment Market Outlook, by End User, 2026–2033
8.5.5 United Arab Emirates Juvenile Macular Degeneration Treatment Market Outlook, by Condition Type, 2026–2033
8.5.6 United Arab Emirates Juvenile Macular Degeneration Treatment Market Outlook, by Offering, 2026–2033
8.5.7 United Arab Emirates Juvenile Macular Degeneration Treatment Market Outlook, by Technology or Approach, 2026–2033
8.5.8 United Arab Emirates Juvenile Macular Degeneration Treatment Market Outlook, by End User, 2026–2033
8.5.9 Israel Juvenile Macular Degeneration Treatment Market Outlook, by Condition Type, 2026–2033
8.5.10 Israel Juvenile Macular Degeneration Treatment Market Outlook, by Offering, 2026–2033
8.5.11 Israel Juvenile Macular Degeneration Treatment Market Outlook, by Technology or Approach, 2026–2033
8.5.12 Israel Juvenile Macular Degeneration Treatment Market Outlook, by End User, 2026–2033
8.5.13 South Africa Juvenile Macular Degeneration Treatment Market Outlook, by Condition Type, 2026–2033
8.5.14 South Africa Juvenile Macular Degeneration Treatment Market Outlook, by Offering, 2026–2033
8.5.15 South Africa Juvenile Macular Degeneration Treatment Market Outlook, by Technology or Approach, 2026–2033
8.5.16 South Africa Juvenile Macular Degeneration Treatment Market Outlook, by End User, 2026–2033
8.5.17 Gulf states Juvenile Macular Degeneration Treatment Market Outlook, by Condition Type, 2026–2033
8.5.18 Gulf states Juvenile Macular Degeneration Treatment Market Outlook, by Offering, 2026–2033
8.5.19 Gulf states Juvenile Macular Degeneration Treatment Market Outlook, by Technology or Approach, 2026–2033
8.5.20 Gulf states Juvenile Macular Degeneration Treatment Market Outlook, by End User, 2026–2033
9. Competitive Landscape
9.1 Industry Leaders
9.2 Company Profiles
9.2.1 Novartis AG
9.2.2 Johnson & Johnson
9.2.3 MeiraGTx Holdings plc
9.2.4 Beacon Therapeutics
9.2.5 Atsena Therapeutics, Inc.
9.2.6 Nanoscope Therapeutics, Inc.
9.2.7 SparingVision SAS
9.2.8 Ocugen, Inc.
9.2.9 4D Molecular Therapeutics, Inc.
9.2.10 Carl Zeiss Meditec AG
9.2.11 Topcon Corporation
9.2.12 Heidelberg Engineering GmbH
9.2.13 Illumina, Inc.
9.2.14 Nidek Co., Ltd.
9.2.15 Eschenbach Optik GmbH
10. Appendix
10.1 Research Methodology
10.2 Report Assumptions
10.3 Acronyms and Abbreviations
| By Condition Type | Stargardt Disease, Best Disease, X-linked Juvenile Retinoschisis, Other Juvenile Macular Dystrophies |
| By Offering | Diagnostic Testing and Imaging, Genetic Testing and Counselling Services, Low-Vision Aids and Rehabilitation, Supportive Pharmacotherapy and Nutritional Management, Investigational Therapeutics |
| By Technology or Approach | Retinal Imaging and Electrophysiology, Next-Generation Sequencing and Genetic Panels, Assistive Optical and Digital Vision Technologies, Gene-Based Investigational Approaches, Cell-Based and Other Investigational Approaches |
| By End User | Specialty Ophthalmology and Retina Centres, Hospitals, Genetic Testing Laboratories, Low-Vision Rehabilitation Centres and Homecare, Research Institutes and Clinical Trial Sites |
| By Region | North America, Europe, Asia Pacific, Latin America, Middle East & Africa |
Our Research Methodology
Considering the volatility of business today, traditional approaches to strategizing a game plan can be unfruitful if not detrimental. True ambiguity is no way to determine a forecast. A myriad of predetermined factors must be accounted for such as the degree of risk involved, the magnitude of circumstances, as well as conditions or consequences that are not known or unpredictable. To circumvent binary views that cast uncertainty, the application of market research intelligence to strategically posture, move, and enable actionable outcomes is necessary.
View Methodology
Quality Assured
Rigorous Validation Process

Confidentiality Assured
End-to-end Data Security

Custom Research Services
Tailored To Your Objectives
FAQs
The market is valued at US$ 1.18 billion in 2026 and should reach US$ 2.08 billion by 2033, gaining US$ 900 million.
The market is expected to grow at an 8.4% CAGR between 2026 and 2033, against a historical rate of 6.9% over 2020 to 2025.
Stargardt disease and diagnostic testing and imaging lead, while genetic testing and counselling services and gene-based investigational approaches record the fastest growth through 2033.
North America leads with 42.6% share in 2026, supported by subspecialty retina coverage, while Asia Pacific grows fastest at a 10.8% CAGR through 2033.
Most juvenile macular dystrophies have no approved disease-modifying therapy, so market revenue centres on diagnosis, genetic testing, monitoring and low-vision support services.
Related Reports
Monogenic Diseases Market Size, Share, Insights, Competitive Landscape, and Forecast 2026 to 2033
Explore the monogenic diseases market, forecast to reach US$34.9 billion by 2033 at 9.4% CAGR, with insights on diseases, offerings, technology, and regions.
Iron Deficiency Anemia Treatment Market Size, Share, Insights, Competitive Landscape, and Forecast 2026 to 2033
Explore the iron deficiency anemia treatment market, forecast to reach US$9.08 billion by 2033 at 8.1% CAGR, with therapy, end-user, and regional insights.
Compounded Bioidentical Hormone Therapy Market Size, Share, Insights, Competitive Landscape, and Forecast 2026 to 2033
Explore the compounded bioidentical hormone therapy market, forecast to reach US$2.87 billion by 2033 at 6.9% CAGR, with hormone, dosage, and regional insights.
Bronchodilators Market Size, Share, Insights, Competitive Landscape, and Forecast 2026 to 2033
Explore the bronchodilators market, forecast to reach US$40.0 billion by 2033 at 4.6% CAGR, with insights on drug classes, devices, channels, and regions.
Asthma Treatment Market Size, Share, Insights, Competitive Landscape, and Forecast 2026 to 2033
Explore the asthma treatment market outlook for 2026–2033, covering drug classes, devices, distribution channels, patient segments, and regions.
AAV Gene Therapy vs Retroviral Gene Therapy Market Size, Share, Insights, Competitive Landscape, and Forecast 2026 to 2033
Explore AAV vs retroviral gene therapy, a market forecast to reach US$23.02 billion by 2033 at 25.4% CAGR, with insights on vectors, uses, and regions.