



Monogenic Diseases Market
Monogenic Diseases Market Size, Share, Insights, Competitive Landscape, and Forecast 2026 to 2033
Report Overview
Monogenic Diseases Market Size and Trend Analysis
How Fast Is the Monogenic Diseases Market Growing?
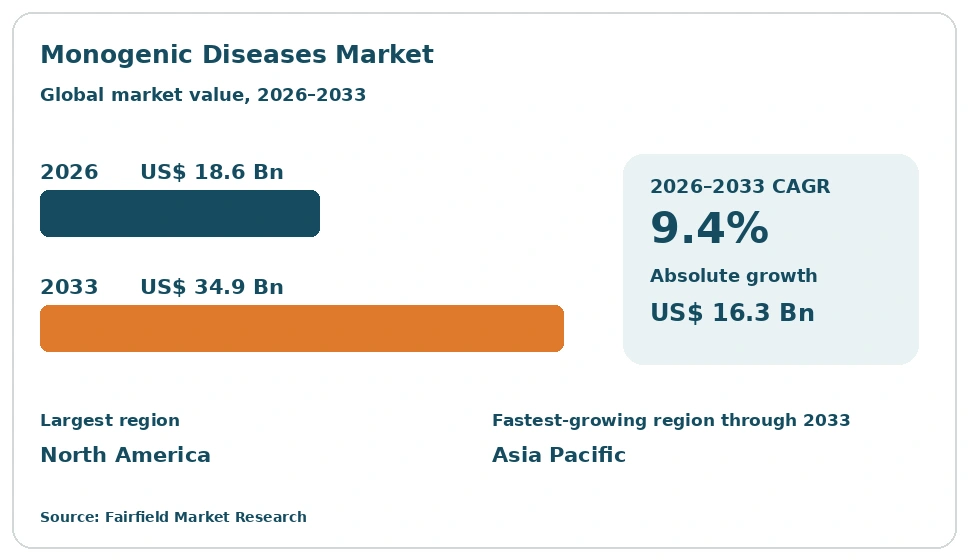
The global monogenic diseases market size is expected to be valued at US$ 18.6 billion in 2026 and projected to reach US$ 34.9 billion by 2033, growing at a CAGR of 9.4% between 2026 and 2033. Growth traces to cheaper sequencing, wider newborn and carrier screening, and a slowly expanding set of approved treatments for single-gene disorders. The historical period recorded a 7.6% CAGR between 2020 and 2025, when testing volumes rose faster than reimbursed spending. An absolute dollar opportunity of US$ 16.3 billion sits between 2026 and 2033. Diagnostic reach, not treatment availability, still sets the pace, since most single-gene conditions are identified long before any disease-specific therapy exists.
Key Report Takeaways
- By Disease Class: Metabolic disorders led with 31.5% share in 2026, while ophthalmic disorders are projected to expand at a 12.8% CAGR through 2033, driven by high diagnostic yield from retinal gene panels and tightly concentrated specialist referral networks.
- By Offering Type: Therapeutics led with 42.0% share in 2026, while genetic counselling and care coordination services are projected to expand at a 13.1% CAGR through 2033, driven by health systems funding structured follow-up after a confirmed genetic result.
- By Technology: Targeted gene panels led with 32.0% share in 2026, while whole-genome sequencing is projected to expand at a 14.2% CAGR through 2033, driven by falling per-sample costs and reanalysis workflows that revisit previously unresolved cases.
- By End User: Hospitals and specialty centres led with 38.0% share in 2026, while public health screening programmes are projected to expand at a 12.2% CAGR through 2033, driven by national decisions to add more conditions to newborn screening panels.
- By Region: North America led with 41.5% share in 2026, while Asia Pacific is projected to expand at a 12.6% CAGR through 2033, driven by new national genomics programmes and fast growth in domestic sequencing laboratory capacity.
Market Trends and Insights
Market Growth Drivers
Falling Sequencing Costs Move Genetic Testing Into Routine Care
Lower sequencing cost is the largest volume driver in this market. Testing that once sat inside research budgets is now ordered from general paediatrics, neurology and ophthalmology clinics, so the addressable population widens far beyond specialist genetics centres. Each additional test carries interpretation, reporting and counselling revenue, which turns a single laboratory sale into a longer service relationship for diagnostic providers.
The underlying shift is industrial. Sequencer throughput has risen while reagent and consumable prices have fallen, and automated library preparation has cut labour per sample. Cloud-based interpretation platforms and shared variant databases have eased the analytical bottleneck that previously limited laboratory capacity. Accreditation schemes now cover clinical sequencing in most large health systems, which lets hospital laboratories bring testing in house rather than sending samples abroad to reference providers for analysis.
Expanding Newborn Screening Panels Enlarge the Diagnosed Population
National newborn screening decisions set the demand floor in this market. Each condition added to a panel converts an entire birth cohort into screened volume, and a screened cohort generates confirmatory testing, specialist referral and long-term follow-up. Because screening is publicly funded in most countries, that volume is stable and bought through multi-year tenders rather than case by case.
Panel expansion has been steady across high-income systems and is now spreading into middle-income ones. Tandem mass spectrometry remains the workhorse for inherited metabolic conditions, while genomic newborn screening pilots test whether sequencing can widen coverage further. Suppliers of dried blood spot consumables, reagents and laboratory information systems gain directly. Public health laboratories also invest in confirmatory capacity, since a positive screen must be resolved quickly and communicated carefully to families.
Restraints Impact Analysis of Market
Uneven Reimbursement Leaves Many Diagnostic Tests Unfunded
Coverage decisions, not clinical demand, cap realised revenue across much of this market. Payers in many systems reimburse a narrow list of single-gene tests and apply prior authorisation to broader panels, so laboratories carry unpaid or partly paid work. Families in out-of-pocket settings often fund testing themselves, which keeps measured spending well below the number of people living with an undiagnosed single-gene condition.
The problem is structural rather than temporary. Health technology assessment frameworks were built around treatments with measurable outcomes, and a diagnosis that ends uncertainty without leading to a treatment is hard to value inside them. Billing codes also lag the pace of panel design, so newer assays are claimed under generic codes at low rates. Laboratories respond with assistance schemes, direct-to-provider pricing and appeals teams, all of which raise cost to serve.
Scarce Specialist Capacity Slows the Path From Test to Care
Limited clinical genetics capacity constrains how fast testing volume converts into revenue. Genetic counsellors, metabolic physicians and variant scientists are in short supply, and waits for specialist appointments stretch across many health systems. Laboratories can process more samples than the downstream pathway can absorb, so orders are rationed at the referral stage and growth runs below what sequencing capacity alone would allow.
Training pipelines respond slowly, since clinical genetics and laboratory genomics both require long qualification periods. Workforce shortages are sharpest outside large academic centres and in countries where the counselling profession is young. Providers are adopting tiered models that combine digital pre-test education, nurse-led consent and remote counselling with automated variant triage. These measures spread existing specialists further, yet they do not remove the bottleneck within the forecast period.
Market Opportunities
Shortening the Diagnostic Odyssey Creates Durable Service Revenue
Years often pass between first symptoms and a confirmed genetic diagnosis, and closing that gap is the clearest commercial opening in this market. Providers offering rapid broad-spectrum testing, structured reanalysis of earlier negative results and coordinated reporting can win hospital contracts on turnaround and resolution rate. The value sits in a repeatable service rather than a single assay, which supports subscription and per-pathway pricing.
Health systems have begun to measure time to diagnosis as a performance indicator, and several national genomics programmes fund broad testing early instead of sequential single-gene steps. Reanalysis is becoming a paid service, because variant knowledge keeps improving after a first negative report. Laboratory information systems, curated variant databases and long-term data storage are the supporting investments. For families, a faster answer ends years of uncertainty, which is why public funders back it.
Patient Registries and Case Finding Open Underserved Disease Classes
Most single-gene conditions still have no disease-modifying treatment, and the people affected are widely scattered. Registries, natural history studies and genotype-level case finding turn that dispersed population into an identifiable one, which is what makes study recruitment, supportive care planning and targeted supply practical. Companies funding this infrastructure gain early standing in the disease classes where a treatment may eventually reach the market.
Patient organisations, academic consortia and national genomics programmes already hold much of the phenotype and variant data required. Partnerships that link laboratory results to consented registries are becoming a standard route to building these cohorts. Regulators including the U.S. Food and Drug Administration and the European Medicines Agency operate orphan designation frameworks that support work in small populations. Diagnostic providers, biopharmaceutical sponsors and care centres share the cost of that data infrastructure.
Category-wise Insights
Which Disease Class Accounts for the Largest Share of Monogenic Disease Spending?
Metabolic disorders hold the largest share, at 31.5% of global monogenic disease spending in 2026. The position rests on newborn screening, which detects inherited metabolic conditions at population scale, and on long-running specialist services that manage them across a lifetime. Haematological disorders follow at 26.0%, neuromuscular disorders at 21.0%, other monogenic conditions at 13.0% and ophthalmic disorders at 8.5%. Growth leadership sits elsewhere. Ophthalmic disorders are forecast to expand at a 12.8% CAGR to 2033, from the smallest base. Inherited retinal conditions suit panel testing, specialist referral concentrates in a small number of centres, and imaging gives a clear route to case finding. For the wider market, the split shows that established screening builds share while concentrated specialist pathways build growth.
Therapeutics Carry Market Value While Counselling Services Scale Fastest
Therapeutics account for 42.0% of market value in 2026, the largest offering category, because cost per patient is high in the few disease areas where approved options exist. Diagnostic testing and kits hold 34.0%, screening services 14.0%, and genetic counselling and care coordination services 10.0%. Counselling and coordination is the growth leader at a 13.1% CAGR through 2033. Health systems increasingly fund structured follow-up after a result, covering family cascade testing, care planning and support for conditions that have no treatment option. Remote delivery has made the service billable at scale. The commercial implication is a widening gap between value and volume. A small treated population drives most revenue, while the far larger diagnosed and undiagnosed population drives service demand.
Targeted Panels Carry Diagnostic Volume as Whole-Genome Sequencing Expands
Targeted gene panels lead technology spending with 32.0% share in 2026, since they answer defined clinical questions at predictable cost and turnaround. Whole-exome sequencing holds 19.5%, whole-genome sequencing 15.0%, PCR and targeted genotyping 14.5%, tandem mass spectrometry 12.0%, and microarray and cytogenetic analysis 7.0%. Whole-genome sequencing is the fastest-growing technology at a 14.2% CAGR through 2033. Falling per-sample cost, broader variant coverage and the ability to reanalyse stored data without a fresh sample explain the shift. National genomics programmes have also standardised genome-first protocols for children with suspected genetic conditions, and tandem mass spectrometry retains its place in publicly funded newborn screening. For suppliers, the move changes market economics, since revenue migrates from one-off assay sales toward interpretation, long-term storage and recurring reanalysis services.
Hospitals Anchor Demand While Public Screening Programmes Grow Quickest
Hospitals and specialty centres lead end-user demand with 38.0% share in 2026, because diagnosis, confirmatory testing and long-term management of single-gene conditions concentrate in tertiary units. Clinical diagnostic laboratories hold 30.5%, public health screening programmes 18.0%, and academic and research institutes 13.5%. Public health screening programmes are the fastest-growing end user at a 12.2% CAGR through 2033. National decisions to add conditions to newborn panels, alongside pilots testing genomic screening at birth, lift publicly funded volume on a multi-year contract basis. Equipment, consumable and informatics suppliers gain predictable demand from it, usually through competitive tender. For the wider market, the shift moves purchasing power toward public procurement, where price is tightly managed but volume commitments are large, contracted well in advance and durable.
Geography Analysis
Which Region Is Leading the Monogenic Diseases Market?
North America leads the monogenic diseases market with 41.5% share in 2026, supported by the United States and Canada. The position reflects dense clinical genetics infrastructure, high-throughput commercial laboratories and insurance structures that fund specialty treatment where options exist. Newborn screening operates in every state and province, and the U.S. Food and Drug Administration maintains established review routes for rare disease products. Coverage for broad panels remains inconsistent across private plans, which leaves part of diagnostic demand unpaid. Growth now comes from genome-first testing protocols, reanalysis services and the gradual extension of screening panels, rather than from new volume in an already well-served insured population.
Europe Pairs Universal Coverage With Uneven Screening Policy
Europe holds 27.0% share in 2026, with Germany, France, the United Kingdom, Italy and Spain contributing most regional value. Universal coverage brings diagnosed patients into funded pathways and keeps payment risk low. National genomics programmes in the United Kingdom and France have standardised broad testing for children with suspected genetic conditions. The European Medicines Agency operates a centralised authorisation route and an orphan designation framework used across member states. Newborn screening panels still differ widely between countries, so a condition screened in one state may go undetected in another. Growth depends on panel harmonisation, wider sequencing capacity and assessment decisions that set which diagnostics are funded.
Which Region Is Growing Fastest in the Monogenic Diseases Market?
Asia Pacific is growing fastest, at a 12.6% CAGR between 2026 and 2033, from 21.5% share in 2026. China, India, Japan, South Korea and Australia drive the expansion. National genomics programmes and public insurance reform have brought genetic testing into hospital pathways that previously had none. Domestic sequencing capacity has grown quickly, cutting the cost and turnaround of locally run tests. Large birth cohorts in China and India make even modest screening coverage commercially significant. Japan, South Korea and Australia add higher-value specialist and therapeutic demand. Workforce capacity in counselling and variant interpretation remains the main limit on how fast testing converts into managed care.
Latin America Builds Capacity Through Public Health Laboratories
Latin America accounts for 5.5% share in 2026, led by Brazil, Mexico, Argentina, Chile and Colombia. Public health laboratories run most newborn screening, and panel coverage has widened steadily in Brazil and Argentina. Private laboratory groups supply broader panel and exome testing to insured urban populations, often sending complex cases abroad for interpretation. Currency movement and import dependence for reagents constrain pricing and continuity of supply. Specialist genetics capacity concentrates in a few large cities, which lengthens the path from first suspicion to confirmed diagnosis. Regional regulatory harmonisation and investment in local sequencing and interpretation capacity are the main routes to faster growth.
Middle East & Africa Advances From a Small Serviced Base
Middle East & Africa holds 4.5% share in 2026, the smallest regional position, with Saudi Arabia, the United Arab Emirates, Qatar, Israel and South Africa supplying most measured value. Gulf states fund national genome programmes and premarital and newborn screening through public health systems, giving the region high testing coverage relative to its size. Recessive single-gene conditions carry a heavier burden in populations with founder variants, which has made screening a stated public health priority. Across much of sub-Saharan Africa, limited laboratory and specialist capacity leaves most affected people undiagnosed. Local sequencing investment and regional reference laboratories are the practical route to wider coverage.
Competitive Landscape
The monogenic diseases market is fragmented, and its structure differs sharply between diagnosis and treatment. Testing is contested by global laboratory networks, sequencing platform suppliers and a long tail of specialist and national reference laboratories, so no provider holds a commanding global share. Therapeutic supply is far more concentrated, because only a small number of companies hold approved products in any given disease class. Consolidation has been steadier on the diagnostic side, where scale lowers cost per sample and widens test menus, while therapeutic positions change through portfolio acquisition rather than gradual share shifts.
Diagnostic competition rests on turnaround time, test menu breadth, variant interpretation capability, accreditation across jurisdictions and the ability to deliver results into hospital systems. Curated variant databases and reanalysis capacity have become genuine points of difference, since the value of a laboratory increasingly sits in its interpretation layer rather than its instruments. Platform suppliers compete on cost per sample, automation and informatics. New entrants are most visible among regional laboratories in Asia Pacific and the Middle East building domestic capacity, and among informatics companies selling interpretation software to laboratories they do not own.
Strategic activity follows those capabilities. Laboratory groups have been adding specialist testing businesses to widen menus and absorb referral volume. Platform suppliers invest in sample preparation automation, informatics and work with national genomics programmes, which secures multi-year volume. Biopharmaceutical companies build registry, case-finding and diagnostic collaborations, because identifying a dispersed patient population is a precondition for any commercial rare disease programme. Several fund sponsored testing initiatives run through independent laboratories rather than operating testing themselves.
Competitive direction is set by three themes: interpretation and data assets rather than instruments, public programme contracts as a route to durable volume, and closer partnership between diagnostic and therapeutic companies across the pathway from screening to long-term care.
Industry Leaders
- Illumina, Inc.
- F. Hoffmann-La Roche Ltd
- Laboratory Corporation of America Holdings
- Revvity, Inc.
- BioMarin Pharmaceutical Inc.
- Vertex Pharmaceuticals Incorporated
Companies Covered in the Report
- Illumina, Inc.
- F. Hoffmann-La Roche Ltd
- Thermo Fisher Scientific Inc.
- Revvity, Inc.
- QIAGEN N.V.
- Laboratory Corporation of America Holdings
- Quest Diagnostics Incorporated
- Myriad Genetics, Inc.
- Natera, Inc.
- Fulgent Genetics, Inc.
- Centogene N.V.
- BGI Genomics Co., Ltd.
- MedGenome Labs Ltd.
- BioMarin Pharmaceutical Inc.
- Vertex Pharmaceuticals Incorporated
- Sarepta Therapeutics, Inc.
- Alnylam Pharmaceuticals, Inc.
- Takeda Pharmaceutical Company Limited
Monogenic Diseases Market Report Scope
The monogenic diseases market is segmented by disease class, offering type, technology, end user and region.
| By Disease Class | Metabolic Disorders, Haematological Disorders, Neuromuscular Disorders, Ophthalmic Disorders, Other Monogenic Disorders |
| By Offering Type | Therapeutics, Diagnostic Testing and Kits, Screening Services, Genetic Counselling and Care Coordination Services |
| By Technology | Targeted Gene Panels, Whole-Exome Sequencing, Whole-Genome Sequencing, PCR and Targeted Genotyping, Tandem Mass Spectrometry, Microarray and Cytogenetic Analysis |
| By End User | Hospitals and Specialty Centres, Clinical Diagnostic Laboratories, Public Health Screening Programmes, Academic and Research Institutes |
| By Region | North America, Europe, Asia Pacific, Latin America, Middle East & Africa |
1. Executive Summary
1.1 Monogenic Diseases Market Snapshot
1.2 Future Projections
1.3 Key Market Trends
1.4 Regional Snapshot
2. Market Overview
2.1 Market Definition and Report Scope
2.2 Historical Market Trends
2.3 Market Dynamics
2.3.1 Drivers
2.3.1.1 Falling Sequencing Costs Move Genetic Testing Into Routine Care
2.3.1.2 Expanding Newborn Screening Panels Enlarge the Diagnosed Population
2.3.2 Restraints
2.3.2.1 Uneven Reimbursement Leaves Many Diagnostic Tests Unfunded
2.3.2.2 Scarce Specialist Capacity Slows the Path From Test to Care
2.3.3 Market Opportunities
2.3.3.1 Shortening the Diagnostic Odyssey Creates Durable Service Revenue
2.3.3.2 Patient Registries and Case Finding Open Underserved Disease Classes
3. Global Monogenic Diseases Market Outlook, 2026–2033
3.1 Global Monogenic Diseases Market Outlook, by Disease Class, Value (US$ Billion), 2026–2033
3.1.1 Metabolic Disorders
3.1.2 Haematological Disorders
3.1.3 Neuromuscular Disorders
3.1.4 Ophthalmic Disorders
3.1.5 Other Monogenic Disorders
3.2 Global Monogenic Diseases Market Outlook, by Offering Type, Value (US$ Billion), 2026–2033
3.2.1 Therapeutics
3.2.2 Diagnostic Testing and Kits
3.2.3 Screening Services
3.2.4 Genetic Counselling and Care Coordination Services
3.3 Global Monogenic Diseases Market Outlook, by Technology, Value (US$ Billion), 2026–2033
3.3.1 Targeted Gene Panels
3.3.2 Whole-Exome Sequencing
3.3.3 Whole-Genome Sequencing
3.3.4 PCR and Targeted Genotyping
3.3.5 Tandem Mass Spectrometry
3.3.6 Microarray and Cytogenetic Analysis
3.4 Global Monogenic Diseases Market Outlook, by End User, Value (US$ Billion), 2026–2033
3.4.1 Hospitals and Specialty Centres
3.4.2 Clinical Diagnostic Laboratories
3.4.3 Public Health Screening Programmes
3.4.4 Academic and Research Institutes
3.5 Global Monogenic Diseases Market Outlook, by Region, Value (US$ Billion), 2026–2033
3.5.1 North America
3.5.2 Europe
3.5.3 Asia Pacific
3.5.4 Latin America
3.5.5 Middle East & Africa
4. North America Monogenic Diseases Market Outlook, 2026–2033
4.1 North America Monogenic Diseases Market Outlook, by Disease Class, Value (US$ Billion), 2026–2033
4.1.1 Metabolic Disorders
4.1.2 Haematological Disorders
4.1.3 Neuromuscular Disorders
4.1.4 Ophthalmic Disorders
4.1.5 Other Monogenic Disorders
4.2 North America Monogenic Diseases Market Outlook, by Offering Type, Value (US$ Billion), 2026–2033
4.2.1 Therapeutics
4.2.2 Diagnostic Testing and Kits
4.2.3 Screening Services
4.2.4 Genetic Counselling and Care Coordination Services
4.3 North America Monogenic Diseases Market Outlook, by Technology, Value (US$ Billion), 2026–2033
4.3.1 Targeted Gene Panels
4.3.2 Whole-Exome Sequencing
4.3.3 Whole-Genome Sequencing
4.3.4 PCR and Targeted Genotyping
4.3.5 Tandem Mass Spectrometry
4.3.6 Microarray and Cytogenetic Analysis
4.4 North America Monogenic Diseases Market Outlook, by End User, Value (US$ Billion), 2026–2033
4.4.1 Hospitals and Specialty Centres
4.4.2 Clinical Diagnostic Laboratories
4.4.3 Public Health Screening Programmes
4.4.4 Academic and Research Institutes
4.5 North America Monogenic Diseases Market Outlook, by Country, Value (US$ Billion), 2026–2033
4.5.1 United States Monogenic Diseases Market Outlook, by Disease Class, 2026–2033
4.5.2 United States Monogenic Diseases Market Outlook, by Offering Type, 2026–2033
4.5.3 United States Monogenic Diseases Market Outlook, by Technology, 2026–2033
4.5.4 United States Monogenic Diseases Market Outlook, by End User, 2026–2033
4.5.5 Canada Monogenic Diseases Market Outlook, by Disease Class, 2026–2033
4.5.6 Canada Monogenic Diseases Market Outlook, by Offering Type, 2026–2033
4.5.7 Canada Monogenic Diseases Market Outlook, by Technology, 2026–2033
4.5.8 Canada Monogenic Diseases Market Outlook, by End User, 2026–2033
5. Europe Monogenic Diseases Market Outlook, 2026–2033
5.1 Europe Monogenic Diseases Market Outlook, by Disease Class, Value (US$ Billion), 2026–2033
5.1.1 Metabolic Disorders
5.1.2 Haematological Disorders
5.1.3 Neuromuscular Disorders
5.1.4 Ophthalmic Disorders
5.1.5 Other Monogenic Disorders
5.2 Europe Monogenic Diseases Market Outlook, by Offering Type, Value (US$ Billion), 2026–2033
5.2.1 Therapeutics
5.2.2 Diagnostic Testing and Kits
5.2.3 Screening Services
5.2.4 Genetic Counselling and Care Coordination Services
5.3 Europe Monogenic Diseases Market Outlook, by Technology, Value (US$ Billion), 2026–2033
5.3.1 Targeted Gene Panels
5.3.2 Whole-Exome Sequencing
5.3.3 Whole-Genome Sequencing
5.3.4 PCR and Targeted Genotyping
5.3.5 Tandem Mass Spectrometry
5.3.6 Microarray and Cytogenetic Analysis
5.4 Europe Monogenic Diseases Market Outlook, by End User, Value (US$ Billion), 2026–2033
5.4.1 Hospitals and Specialty Centres
5.4.2 Clinical Diagnostic Laboratories
5.4.3 Public Health Screening Programmes
5.4.4 Academic and Research Institutes
5.5 Europe Monogenic Diseases Market Outlook, by Country, Value (US$ Billion), 2026–2033
5.5.1 Germany Monogenic Diseases Market Outlook, by Disease Class, 2026–2033
5.5.2 Germany Monogenic Diseases Market Outlook, by Offering Type, 2026–2033
5.5.3 Germany Monogenic Diseases Market Outlook, by Technology, 2026–2033
5.5.4 Germany Monogenic Diseases Market Outlook, by End User, 2026–2033
5.5.5 France Monogenic Diseases Market Outlook, by Disease Class, 2026–2033
5.5.6 France Monogenic Diseases Market Outlook, by Offering Type, 2026–2033
5.5.7 France Monogenic Diseases Market Outlook, by Technology, 2026–2033
5.5.8 France Monogenic Diseases Market Outlook, by End User, 2026–2033
5.5.9 United Kingdom Monogenic Diseases Market Outlook, by Disease Class, 2026–2033
5.5.10 United Kingdom Monogenic Diseases Market Outlook, by Offering Type, 2026–2033
5.5.11 United Kingdom Monogenic Diseases Market Outlook, by Technology, 2026–2033
5.5.12 United Kingdom Monogenic Diseases Market Outlook, by End User, 2026–2033
5.5.13 Italy Monogenic Diseases Market Outlook, by Disease Class, 2026–2033
5.5.14 Italy Monogenic Diseases Market Outlook, by Offering Type, 2026–2033
5.5.15 Italy Monogenic Diseases Market Outlook, by Technology, 2026–2033
5.5.16 Italy Monogenic Diseases Market Outlook, by End User, 2026–2033
5.5.17 Spain Monogenic Diseases Market Outlook, by Disease Class, 2026–2033
5.5.18 Spain Monogenic Diseases Market Outlook, by Offering Type, 2026–2033
5.5.19 Spain Monogenic Diseases Market Outlook, by Technology, 2026–2033
5.5.20 Spain Monogenic Diseases Market Outlook, by End User, 2026–2033
6. Asia Pacific Monogenic Diseases Market Outlook, 2026–2033
6.1 Asia Pacific Monogenic Diseases Market Outlook, by Disease Class, Value (US$ Billion), 2026–2033
6.1.1 Metabolic Disorders
6.1.2 Haematological Disorders
6.1.3 Neuromuscular Disorders
6.1.4 Ophthalmic Disorders
6.1.5 Other Monogenic Disorders
6.2 Asia Pacific Monogenic Diseases Market Outlook, by Offering Type, Value (US$ Billion), 2026–2033
6.2.1 Therapeutics
6.2.2 Diagnostic Testing and Kits
6.2.3 Screening Services
6.2.4 Genetic Counselling and Care Coordination Services
6.3 Asia Pacific Monogenic Diseases Market Outlook, by Technology, Value (US$ Billion), 2026–2033
6.3.1 Targeted Gene Panels
6.3.2 Whole-Exome Sequencing
6.3.3 Whole-Genome Sequencing
6.3.4 PCR and Targeted Genotyping
6.3.5 Tandem Mass Spectrometry
6.3.6 Microarray and Cytogenetic Analysis
6.4 Asia Pacific Monogenic Diseases Market Outlook, by End User, Value (US$ Billion), 2026–2033
6.4.1 Hospitals and Specialty Centres
6.4.2 Clinical Diagnostic Laboratories
6.4.3 Public Health Screening Programmes
6.4.4 Academic and Research Institutes
6.5 Asia Pacific Monogenic Diseases Market Outlook, by Country, Value (US$ Billion), 2026–2033
6.5.1 China Monogenic Diseases Market Outlook, by Disease Class, 2026–2033
6.5.2 China Monogenic Diseases Market Outlook, by Offering Type, 2026–2033
6.5.3 China Monogenic Diseases Market Outlook, by Technology, 2026–2033
6.5.4 China Monogenic Diseases Market Outlook, by End User, 2026–2033
6.5.5 India Monogenic Diseases Market Outlook, by Disease Class, 2026–2033
6.5.6 India Monogenic Diseases Market Outlook, by Offering Type, 2026–2033
6.5.7 India Monogenic Diseases Market Outlook, by Technology, 2026–2033
6.5.8 India Monogenic Diseases Market Outlook, by End User, 2026–2033
6.5.9 Japan Monogenic Diseases Market Outlook, by Disease Class, 2026–2033
6.5.10 Japan Monogenic Diseases Market Outlook, by Offering Type, 2026–2033
6.5.11 Japan Monogenic Diseases Market Outlook, by Technology, 2026–2033
6.5.12 Japan Monogenic Diseases Market Outlook, by End User, 2026–2033
6.5.13 South Korea Monogenic Diseases Market Outlook, by Disease Class, 2026–2033
6.5.14 South Korea Monogenic Diseases Market Outlook, by Offering Type, 2026–2033
6.5.15 South Korea Monogenic Diseases Market Outlook, by Technology, 2026–2033
6.5.16 South Korea Monogenic Diseases Market Outlook, by End User, 2026–2033
6.5.17 Australia Monogenic Diseases Market Outlook, by Disease Class, 2026–2033
6.5.18 Australia Monogenic Diseases Market Outlook, by Offering Type, 2026–2033
6.5.19 Australia Monogenic Diseases Market Outlook, by Technology, 2026–2033
6.5.20 Australia Monogenic Diseases Market Outlook, by End User, 2026–2033
7. Latin America Monogenic Diseases Market Outlook, 2026–2033
7.1 Latin America Monogenic Diseases Market Outlook, by Disease Class, Value (US$ Billion), 2026–2033
7.1.1 Metabolic Disorders
7.1.2 Haematological Disorders
7.1.3 Neuromuscular Disorders
7.1.4 Ophthalmic Disorders
7.1.5 Other Monogenic Disorders
7.2 Latin America Monogenic Diseases Market Outlook, by Offering Type, Value (US$ Billion), 2026–2033
7.2.1 Therapeutics
7.2.2 Diagnostic Testing and Kits
7.2.3 Screening Services
7.2.4 Genetic Counselling and Care Coordination Services
7.3 Latin America Monogenic Diseases Market Outlook, by Technology, Value (US$ Billion), 2026–2033
7.3.1 Targeted Gene Panels
7.3.2 Whole-Exome Sequencing
7.3.3 Whole-Genome Sequencing
7.3.4 PCR and Targeted Genotyping
7.3.5 Tandem Mass Spectrometry
7.3.6 Microarray and Cytogenetic Analysis
7.4 Latin America Monogenic Diseases Market Outlook, by End User, Value (US$ Billion), 2026–2033
7.4.1 Hospitals and Specialty Centres
7.4.2 Clinical Diagnostic Laboratories
7.4.3 Public Health Screening Programmes
7.4.4 Academic and Research Institutes
7.5 Latin America Monogenic Diseases Market Outlook, by Country, Value (US$ Billion), 2026–2033
7.5.1 Brazil Monogenic Diseases Market Outlook, by Disease Class, 2026–2033
7.5.2 Brazil Monogenic Diseases Market Outlook, by Offering Type, 2026–2033
7.5.3 Brazil Monogenic Diseases Market Outlook, by Technology, 2026–2033
7.5.4 Brazil Monogenic Diseases Market Outlook, by End User, 2026–2033
7.5.5 Mexico Monogenic Diseases Market Outlook, by Disease Class, 2026–2033
7.5.6 Mexico Monogenic Diseases Market Outlook, by Offering Type, 2026–2033
7.5.7 Mexico Monogenic Diseases Market Outlook, by Technology, 2026–2033
7.5.8 Mexico Monogenic Diseases Market Outlook, by End User, 2026–2033
7.5.9 Argentina Monogenic Diseases Market Outlook, by Disease Class, 2026–2033
7.5.10 Argentina Monogenic Diseases Market Outlook, by Offering Type, 2026–2033
7.5.11 Argentina Monogenic Diseases Market Outlook, by Technology, 2026–2033
7.5.12 Argentina Monogenic Diseases Market Outlook, by End User, 2026–2033
7.5.13 Chile Monogenic Diseases Market Outlook, by Disease Class, 2026–2033
7.5.14 Chile Monogenic Diseases Market Outlook, by Offering Type, 2026–2033
7.5.15 Chile Monogenic Diseases Market Outlook, by Technology, 2026–2033
7.5.16 Chile Monogenic Diseases Market Outlook, by End User, 2026–2033
7.5.17 Colombia Monogenic Diseases Market Outlook, by Disease Class, 2026–2033
7.5.18 Colombia Monogenic Diseases Market Outlook, by Offering Type, 2026–2033
7.5.19 Colombia Monogenic Diseases Market Outlook, by Technology, 2026–2033
7.5.20 Colombia Monogenic Diseases Market Outlook, by End User, 2026–2033
8. Middle East & Africa Monogenic Diseases Market Outlook, 2026–2033
8.1 Middle East & Africa Monogenic Diseases Market Outlook, by Disease Class, Value (US$ Billion), 2026–2033
8.1.1 Metabolic Disorders
8.1.2 Haematological Disorders
8.1.3 Neuromuscular Disorders
8.1.4 Ophthalmic Disorders
8.1.5 Other Monogenic Disorders
8.2 Middle East & Africa Monogenic Diseases Market Outlook, by Offering Type, Value (US$ Billion), 2026–2033
8.2.1 Therapeutics
8.2.2 Diagnostic Testing and Kits
8.2.3 Screening Services
8.2.4 Genetic Counselling and Care Coordination Services
8.3 Middle East & Africa Monogenic Diseases Market Outlook, by Technology, Value (US$ Billion), 2026–2033
8.3.1 Targeted Gene Panels
8.3.2 Whole-Exome Sequencing
8.3.3 Whole-Genome Sequencing
8.3.4 PCR and Targeted Genotyping
8.3.5 Tandem Mass Spectrometry
8.3.6 Microarray and Cytogenetic Analysis
8.4 Middle East & Africa Monogenic Diseases Market Outlook, by End User, Value (US$ Billion), 2026–2033
8.4.1 Hospitals and Specialty Centres
8.4.2 Clinical Diagnostic Laboratories
8.4.3 Public Health Screening Programmes
8.4.4 Academic and Research Institutes
8.5 Middle East & Africa Monogenic Diseases Market Outlook, by Country and Subregion, Value (US$ Billion), 2026–2033
8.5.1 Saudi Arabia Monogenic Diseases Market Outlook, by Disease Class, 2026–2033
8.5.2 Saudi Arabia Monogenic Diseases Market Outlook, by Offering Type, 2026–2033
8.5.3 Saudi Arabia Monogenic Diseases Market Outlook, by Technology, 2026–2033
8.5.4 Saudi Arabia Monogenic Diseases Market Outlook, by End User, 2026–2033
8.5.5 United Arab Emirates Monogenic Diseases Market Outlook, by Disease Class, 2026–2033
8.5.6 United Arab Emirates Monogenic Diseases Market Outlook, by Offering Type, 2026–2033
8.5.7 United Arab Emirates Monogenic Diseases Market Outlook, by Technology, 2026–2033
8.5.8 United Arab Emirates Monogenic Diseases Market Outlook, by End User, 2026–2033
8.5.9 Qatar Monogenic Diseases Market Outlook, by Disease Class, 2026–2033
8.5.10 Qatar Monogenic Diseases Market Outlook, by Offering Type, 2026–2033
8.5.11 Qatar Monogenic Diseases Market Outlook, by Technology, 2026–2033
8.5.12 Qatar Monogenic Diseases Market Outlook, by End User, 2026–2033
8.5.13 Israel Monogenic Diseases Market Outlook, by Disease Class, 2026–2033
8.5.14 Israel Monogenic Diseases Market Outlook, by Offering Type, 2026–2033
8.5.15 Israel Monogenic Diseases Market Outlook, by Technology, 2026–2033
8.5.16 Israel Monogenic Diseases Market Outlook, by End User, 2026–2033
8.5.17 South Africa Monogenic Diseases Market Outlook, by Disease Class, 2026–2033
8.5.18 South Africa Monogenic Diseases Market Outlook, by Offering Type, 2026–2033
8.5.19 South Africa Monogenic Diseases Market Outlook, by Technology, 2026–2033
8.5.20 South Africa Monogenic Diseases Market Outlook, by End User, 2026–2033
8.5.21 Gulf states Monogenic Diseases Market Outlook, by Disease Class, 2026–2033
8.5.22 Gulf states Monogenic Diseases Market Outlook, by Offering Type, 2026–2033
8.5.23 Gulf states Monogenic Diseases Market Outlook, by Technology, 2026–2033
8.5.24 Gulf states Monogenic Diseases Market Outlook, by End User, 2026–2033
9. Competitive Landscape
9.1 Industry Leaders
9.2 Company Profiles
9.2.1 Illumina, Inc.
9.2.2 F. Hoffmann-La Roche Ltd
9.2.3 Thermo Fisher Scientific Inc.
9.2.4 Revvity, Inc.
9.2.5 QIAGEN N.V.
9.2.6 Laboratory Corporation of America Holdings
9.2.7 Quest Diagnostics Incorporated
9.2.8 Myriad Genetics, Inc.
9.2.9 Natera, Inc.
9.2.10 Fulgent Genetics, Inc.
9.2.11 Centogene N.V.
9.2.12 BGI Genomics Co., Ltd.
9.2.13 MedGenome Labs Ltd.
9.2.14 BioMarin Pharmaceutical Inc.
9.2.15 Vertex Pharmaceuticals Incorporated
9.2.16 Sarepta Therapeutics, Inc.
9.2.17 Alnylam Pharmaceuticals, Inc.
9.2.18 Takeda Pharmaceutical Company Limited
10. Appendix
10.1 Research Methodology
10.2 Report Assumptions
10.3 Acronyms and Abbreviations
| By Disease Class | Metabolic Disorders, Haematological Disorders, Neuromuscular Disorders, Ophthalmic Disorders, Other Monogenic Disorders |
| By Offering Type | Therapeutics, Diagnostic Testing and Kits, Screening Services, Genetic Counselling and Care Coordination Services |
| By Technology | Targeted Gene Panels, Whole-Exome Sequencing, Whole-Genome Sequencing, PCR and Targeted Genotyping, Tandem Mass Spectrometry, Microarray and Cytogenetic Analysis |
| By End User | Hospitals and Specialty Centres, Clinical Diagnostic Laboratories, Public Health Screening Programmes, Academic and Research Institutes |
| By Region | North America, Europe, Asia Pacific, Latin America, Middle East & Africa |
Our Research Methodology
Considering the volatility of business today, traditional approaches to strategizing a game plan can be unfruitful if not detrimental. True ambiguity is no way to determine a forecast. A myriad of predetermined factors must be accounted for such as the degree of risk involved, the magnitude of circumstances, as well as conditions or consequences that are not known or unpredictable. To circumvent binary views that cast uncertainty, the application of market research intelligence to strategically posture, move, and enable actionable outcomes is necessary.
View Methodology
Quality Assured
Rigorous Validation Process

Confidentiality Assured
End-to-end Data Security

Custom Research Services
Tailored To Your Objectives
FAQs
The monogenic diseases market is valued at US$ 18.6 billion in 2026, covering genetic testing, screening programmes, therapeutics and related support services.
The market is forecast to grow at a 9.4% CAGR between 2026 and 2033, reaching US$ 34.9 billion and adding US$ 16.3 billion.
Metabolic disorders lead with 31.5% share in 2026, while ophthalmic disorders grow fastest at a 12.8% CAGR through 2033 on concentrated specialist referral.
North America holds 41.5% share in 2026, while Asia Pacific grows fastest at a 12.6% CAGR between 2026 and 2033.
The market is fragmented in diagnostics, where many laboratories compete, and concentrated in therapeutics, where few companies hold approved products per disease class.
Related Reports
Juvenile Macular Degeneration Treatment Market Size, Share, Insights, Competitive Landscape, and Forecast 2026 to 2033
Explore the juvenile macular degeneration treatment market, forecast to reach US$2.08 billion by 2033 at 8.4% CAGR, with offering and regional insights.
Iron Deficiency Anemia Treatment Market Size, Share, Insights, Competitive Landscape, and Forecast 2026 to 2033
Explore the iron deficiency anemia treatment market, forecast to reach US$9.08 billion by 2033 at 8.1% CAGR, with therapy, end-user, and regional insights.
Compounded Bioidentical Hormone Therapy Market Size, Share, Insights, Competitive Landscape, and Forecast 2026 to 2033
Explore the compounded bioidentical hormone therapy market, forecast to reach US$2.87 billion by 2033 at 6.9% CAGR, with hormone, dosage, and regional insights.
Bronchodilators Market Size, Share, Insights, Competitive Landscape, and Forecast 2026 to 2033
Explore the bronchodilators market, forecast to reach US$40.0 billion by 2033 at 4.6% CAGR, with insights on drug classes, devices, channels, and regions.
Asthma Treatment Market Size, Share, Insights, Competitive Landscape, and Forecast 2026 to 2033
Explore the asthma treatment market outlook for 2026–2033, covering drug classes, devices, distribution channels, patient segments, and regions.
AAV Gene Therapy vs Retroviral Gene Therapy Market Size, Share, Insights, Competitive Landscape, and Forecast 2026 to 2033
Explore AAV vs retroviral gene therapy, a market forecast to reach US$23.02 billion by 2033 at 25.4% CAGR, with insights on vectors, uses, and regions.