



Dye Intermediates Market
Dye Intermediates Market Size, Share, Insights, Competitive Landscape, and Forecast 2026 to 2033
Report Overview
Dye Intermediates Market Size and Trend Analysis
How Fast Will Dye Intermediates Demand Grow to 2033?
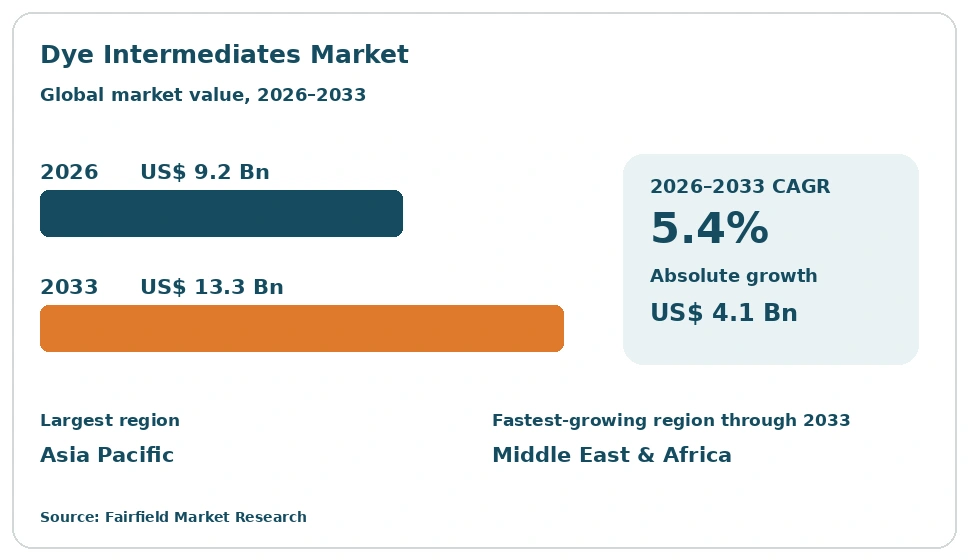
The global Dye Intermediates market size is expected to be valued at US$ 9.2 billion in 2026 and projected to reach US$ 13.3 billion by 2033, growing at a CAGR of 5.4% between 2026 and 2033. Growth rests on steady textile dyeing volumes, with Asia Pacific supplying most of the world’s intermediate tonnage. Demand for reactive and disperse dye building blocks is rising faster than average, while tighter environmental rules keep capacity among compliant producers. Historical expansion was slower, at a 3.8% CAGR between 2020 and 2025, held back by feedstock volatility and production curtailment. The absolute dollar opportunity stands at US$ 4.1 billion.
Key Report Takeaways
- By Product Type: Aniline and its derivatives led with a 31% share in 2026, while vinyl sulphone-based intermediates are projected to expand at a 6.6% CAGR through 2033, driven by rising reactive dyeing of cotton knitwear.
- By Application: Reactive dye intermediates held 30% of revenue in 2026, while pigment intermediates are set to grow at a 6.4% CAGR through 2033, driven by wider use of digital textile printing inks.
- By End-use Industry: Textiles accounted for 58% of demand in 2026, while printing inks and coatings should advance at a 6.5% CAGR through 2033, driven by packaging converters moving to higher-performance colourants.
- By Grade: Standard grade material represented 62% of volume in 2026, while high-purity grade is forecast to rise at a 7.1% CAGR through 2033, driven by stricter colour consistency specifications from global apparel brands.
- By Region: Asia Pacific led with a 66% share in 2026, ahead of Europe at 12%, North America at 10%, Latin America at 6% and Middle East & Africa at 6%, which is the fastest grower at a 6.4% CAGR through 2033.
Market Trends and Insights
Market Growth Drivers
Rising Asian Textile Output Keeps Intermediate Offtake Firm
Dye intermediate demand tracks textile dyeing volumes, and those volumes keep expanding across Asia. Mills in India, China, Bangladesh and Vietnam continue to add capacity for cotton knits, polyester blends and home textiles. Every incremental tonne of finished fabric pulls through a predictable quantity of aromatic amines, naphthalene sulphonates and related building blocks. Because dyeing is a consumable step, demand repeats with each production cycle.
Apparel sourcing has shifted toward shorter runs and more frequent colour changes, which raises intermediate consumption per metre of fabric. Brand programmes for traceable supply chains also push mills toward documented, consistent dye chemistry rather than ad hoc blending. That favours established intermediate suppliers with stable quality records. Regional trade arrangements and duty structures further concentrate garment finishing in Asia, keeping intermediate offtake close to the plants that make it.
Shift Toward Reactive and Disperse Dyes Narrows Demand
The dye mix is moving toward reactive and disperse chemistry, and that shift changes which intermediates sell. Cotton and cotton blends increasingly use reactive dyes for wash fastness, which pulls vinyl sulphone and H-acid based building blocks. Polyester growth in sportswear and home furnishing lifts disperse dye intermediates built on anthraquinone and azo chemistry. Older direct and sulphur dye classes lose ground, so demand concentrates in a narrower set of molecules.
Performance expectations from global apparel brands reinforce the trend. Wash and light fastness requirements in brand specifications favour dye classes that bond more durably, and mills adopt them to avoid costly reprocessing. Effluent considerations matter too, because better fixation leaves less unfixed dye in wastewater. Producers that aligned capacity with reactive and disperse demand see steadier utilisation than those tied to legacy classes.
Restraints Impact Analysis of Market
Environmental Compliance Costs Squeeze Producer Margins
Environmental compliance is the largest cost variable for dye intermediate producers. Several intermediates are effluent-intensive, and treating spent liquor, recovering salts and meeting discharge standards absorb capital that smaller units struggle to fund. Where regulators tighten oversight of industrial clusters, operating rates fall and some lines stop for extended periods. The result is intermittent supply and higher landed costs for dye makers, capping volume growth even when textile demand is healthy.
The compliance burden also reshapes who can compete. Producers with in-house effluent treatment and continuous monitoring trade through regulatory review cycles, while asset-light converters cannot. That pushes consolidation toward integrated sites inside designated chemical zones. Buyers also audit supplier environmental performance within brand sourcing programmes, adding scrutiny beyond statutory requirements. Over time this raises entry costs for new capacity and keeps pricing structurally above historical norms.
Feedstock Price Swings Destabilise Contract Pricing
Dye intermediates sit one step away from benzene, toluene, naphthalene and aniline, so crude oil and coal tar movements pass through quickly. Intermediate makers usually sell on quarterly or half-yearly contracts while buying feedstock on spot terms. When aromatics spike, margin compresses well before contract prices can reset. Dye formulators then delay orders and draw down inventory, amplifying the swing and leaving plants running below nameplate for a quarter or longer.
Coal tar availability adds a second layer of uncertainty, since naphthalene and anthracene streams depend on steel industry output rather than on dye demand. Shifts in steelmaking routes change the volume of tar distillates reaching the chemical chain. Freight rates compound the effect for exporters shipping to distant dye houses. Producers respond with longer feedstock arrangements and dual sourcing, yet few fully insulate pricing, so earnings remain cyclical.
Market Opportunities
Supply Base Diversification Opens Room for New Producers
Buyers outside Asia are broadening their intermediate supplier base, creating openings for producers able to document reliable, compliant output. Dye and pigment houses in Europe and North America that once relied on one supplier now qualify second and third sources. That shift rewards Indian producers with integrated upstream positions and encourages new capacity in Southeast Asia and the Middle East. For suppliers with audit-ready plants, the prize is converting spot business into contracted volume.
The commercial value lies less in price and more in assurance. Customers pay for consistent shade strength, documented impurity profiles and predictable lead times. Suppliers offering technical service, documentation and local warehousing take share from purely transactional exporters. Integration into upstream aromatics improves cost position and traceability, which matters for brands mapping chemical supply chains. These capabilities, rather than tonnage alone, decide who captures diversification spending.
High-Purity Grades Create a Durable Premium Niche
High-purity and low-salt intermediate grades are the clearest premium niche in this market. Digital textile printing, high-performance pigments and speciality coatings all need tighter impurity control than conventional exhaust dyeing. These applications accept materially higher prices because colour consistency and print head reliability depend on feed quality. For producers, margin per tonne is several times commodity material, and relationships are stickier because requalification is slow and costly.
Capturing the niche needs analytical capability more than new tonnage. Suppliers require consistent batch documentation, trace metal control and the ability to hold specifications across campaigns. Apparel and packaging brands tightening restricted substance expectations push mills toward these grades, which pulls demand upstream. Companies already serving pharmaceutical or agrochemical intermediate customers hold an advantage, since the quality systems transfer directly. The opportunity favours focused producers rather than the largest volume players.
Category-wise Insights
Which Product Type Holds the Largest Share of Dye Intermediates Demand?
Aniline and its derivatives hold the largest position, at 31% of revenue in 2026. The class feeds azo dye and pigment chemistry alike, giving it broad, stable offtake rather than exposure to a single dye family. Integrated producers in India and China run aniline-linked capacity at scale, keeping unit costs low and supply dependable. Naphthalene derivatives, including H-acid, follow at 26%, supported by reactive dye demand. Growth leadership sits elsewhere. Vinyl sulphone-based intermediates are the fastest-growing product type at a 6.6% CAGR to 2033, tracking reactive dyeing of cotton knitwear. Anthraquinone derivatives account for 14%, tied to disperse and vat dyes, while other chemistries make up the remaining 11%. The practical implication for strategy teams is that scale volume and incremental growth sit in different parts of the portfolio.
Reactive Dye Chemistry Dominates Intermediate Consumption
Reactive dye intermediates led applications with 30% of revenue in 2026, reflecting cotton’s continued weight in global fibre consumption. Wash fastness requirements from apparel brands keep mills committed to reactive chemistry despite its higher water use. Disperse dye intermediates follow at 24%, lifted by polyester in activewear and furnishing fabrics. Acid dye intermediates hold 14%, direct dyes 11% and vat and sulphur dyes 10%. The fastest-growing application is pigment intermediates at a 6.4% CAGR to 2033, driven by digital textile printing, packaging inks and coloured plastics. Pigment chemistry rewards finer particle control and cleaner feedstock, which shifts value toward producers with tighter process control. For the wider market, growth in pigments dilutes dependence on wet dyeing cycles and gives intermediate suppliers a second, less water-constrained demand channel.
Textile Mills Set the Pace While Inks and Coatings Accelerate
Textiles dominated end use with 58% of demand in 2026, a share that reflects how little of the dye chain sits outside fabric processing. Dyeing and printing houses in India, China, Bangladesh and Turkey absorb most intermediate tonnage. Printing inks and coatings take 12%, leather 11%, paper 9%, plastics 6% and other uses 4%. Growth leadership belongs to printing inks and coatings at a 6.5% CAGR to 2033, as packaging converters move to higher-performance colourants and brand owners demand better fade resistance on shelf. Leather and paper grow more slowly, constrained by substitution and digital media. The spread matters commercially because non-textile users buy smaller volumes at better prices and on steadier schedules, improving the earnings quality of suppliers that serve both channels.
Purity Specifications Become a Commercial Dividing Line
Standard grade intermediates accounted for 62% of volume in 2026, serving bulk exhaust dyeing where cost per shade outweighs specification detail. This grade is where price competition is sharpest and where Chinese and Indian capacity sets the global reference. High-purity grade holds 27% and is the fastest-growing category at a 7.1% CAGR to 2033, pulled by digital printing inks, high-performance pigments and brand restricted substance programmes. Specialty low-metal grades make up the remaining 11%. The divide is widening because purity demands analytical infrastructure, documented batch records and disciplined campaign management rather than extra reactor capacity. Producers able to move volume upward along this ladder protect margin when commodity pricing softens, which is why grade mix increasingly explains the profitability gap between otherwise similar intermediate manufacturers.
Geography Analysis
North America Depends on Imports for Most Intermediate Supply
North America held a 10% share in 2026 and is projected to grow at a 3.7% CAGR to 2033, the slowest among regions. Domestic textile dyeing is limited, so intermediate consumption concentrates in pigments, printing inks, coatings and speciality colourants. The United States accounts for most regional demand, with Mexico supporting apparel finishing linked to nearshoring. Local production of dye intermediates is modest, and buyers import the bulk of requirements from Asia. Environmental permitting and high operating costs discourage new commodity capacity, so investment focuses on formulation, blending and technical service. Supply security has become a board-level concern, prompting dual sourcing and larger safety stocks. The region therefore matters more as a quality-setting customer than as a production base.
Europe Concentrates on Compliance-Led, Lower-Volume Production
Europe accounted for 12% of revenue in 2026 with a 3.9% CAGR to 2033. Germany, Switzerland, Italy and Spain anchor demand through speciality dye and pigment makers serving automotive coatings, printing inks and technical textiles. Regional producers have largely exited commodity intermediates and retained higher-value, tightly specified chemistry where compliance expertise is a competitive asset. Strict chemical registration and discharge expectations raise operating costs but also create a defensible position, since customers value documented conformity. Textile dyeing capacity continues to sit mainly in Turkey and Portugal, which pulls intermediate imports into the wider region. European buyers increasingly audit upstream suppliers directly, extending their compliance reach into Asian production sites and shaping global quality norms.
Which Region Is Leading the Dye Intermediates Market?
Asia Pacific leads the dye intermediates market with a 66% share in 2026 and a 5.9% CAGR to 2033. China and India together form the production base, combining upstream aromatics access, large integrated sites and dense downstream dye capacity. India has gained ground as buyers diversify sourcing, supported by chemical park infrastructure and established effluent treatment clusters in Gujarat and Maharashtra. China retains unmatched scale and cost position, though periodic environmental enforcement curtails output at times. Demand strength comes from garment finishing in Bangladesh, Vietnam and Indonesia, which pulls intermediates through regional trade routes. Proximity between intermediate plants, dye makers and mills shortens lead times and lowers landed cost, reinforcing the region’s structural advantage.
Latin American Demand Follows Domestic Apparel and Leather
Latin America represented 6% of the market in 2026 and should grow at a 5.0% CAGR to 2033. Brazil is the principal consumer, supported by a sizeable domestic apparel sector, footwear manufacturing and a leather industry that uses acid and direct dye chemistry. Mexico, Colombia and Argentina add smaller but steady volumes. Regional intermediate production is limited, so dye formulators rely on imports from Asia, leaving them exposed to freight costs and currency movements. Investment is concentrated in blending and finishing rather than base chemistry. Growth depends largely on domestic consumer demand and on apparel export programmes serving North America, both of which have improved as brands shorten supply chains and look for nearer sourcing options.
Which Region Is Growing Fastest in the Dye Intermediates Market?
Middle East & Africa is the fastest-growing region, advancing at a 6.4% CAGR to 2033 from a 6% share in 2026. Growth starts from a small base and is led by textile manufacturing investment in Turkey, Egypt and Ethiopia, where governments have supported industrial zones aimed at garment exports. Turkey is the most developed market, with integrated dyeing and finishing capacity serving European buyers on short lead times. Gulf economies offer competitive feedstock positions and have shown interest in moving downstream from aromatics into speciality chemicals. South Africa contributes through pigments and coatings. Infrastructure gaps, power reliability and effluent treatment capacity remain practical constraints, so growth is likely to stay concentrated in a handful of established clusters.
Competitive Landscape
The dye intermediates market is moderately fragmented, with a sizeable group of mid-cap producers rather than a few global leaders. Capacity is concentrated in India and China, where several companies operate integrated sites covering intermediates and finished dyes. Downstream dye houses such as Archroma and DyStar Group secure part of their intermediate needs internally, which blurs the line between supplier and customer. Consolidation is gradual and driven mostly by environmental economics, as sites unable to fund effluent infrastructure exit or are absorbed by larger neighbours. The outcome is a market where scale and compliance capability, rather than brand, determine durable position.
Competition turns on cost of production, consistency and environmental credentials. Buyers evaluate shade strength reproducibility, impurity profiles and documentation quality alongside price, because a failed batch costs a mill far more than the intermediate itself. Producers with backward integration into aromatics defend margin better through feedstock cycles. Newer entrants tend to target speciality and high-purity niches, where analytical discipline matters more than tonnage, rather than challenging commodity producers directly. Sustainability performance, including water recovery and salt management, has become a visible point of differentiation in customer audits.
Strategic activity centres on debottlenecking existing plants, extending product range into adjacent intermediates and investing in effluent and recovery infrastructure. These moves matter competitively because they lift usable capacity without triggering lengthy new-site approvals. Several producers are also strengthening technical service and regional stockholding to serve diversification-minded buyers. Research effort concentrates on cleaner processing and on grades suited to digital printing and high-performance pigments. Looking ahead, vendor strategy is shaped by three themes: securing compliant capacity, improving grade mix toward higher-purity material, and building supply assurance that customers can verify.
Industry Leaders
- Zhejiang Longsheng Group Co., Ltd.
- Atul Ltd
- Aarti Industries Limited
- Kiri Industries Limited
- Archroma
- DyStar Group
- Huntsman Corporation
- LANXESS AG
Companies Covered in the Report
- Zhejiang Longsheng Group Co., Ltd.
- Zhejiang Runtu Co., Ltd.
- Atul Ltd
- Aarti Industries Limited
- Kiri Industries Limited
- Bodal Chemicals Limited
- Deepak Nitrite Limited
- Shree Pushkar Chemicals & Fertilisers Limited
- Jaysynth Dyestuff (India) Ltd.
- Sudarshan Chemical Industries Limited
- Archroma
- DyStar Group
- Huntsman Corporation
- LANXESS AG
- Nippon Kayaku Co., Ltd.
- Sumitomo Chemical Co., Ltd.
Dye Intermediates Market Report Scope
The dye intermediates market is segmented by product type, application, end-use industry, grade and region.
| By Product Type | Aniline and Derivatives, Naphthalene Derivatives, Vinyl Sulphone-based Intermediates, Anthraquinone Derivatives, Others |
| By Application | Reactive Dyes, Disperse Dyes, Acid Dyes, Direct Dyes, Vat and Sulphur Dyes, Pigments |
| By End-use Industry | Textiles, Printing Inks and Coatings, Leather, Paper, Plastics, Others |
| By Grade | Standard Grade, High-purity Grade, Specialty Low-metal Grade |
| By Region | North America, Europe, Asia Pacific, Latin America, Middle East & Africa |
1. Executive Summary
1.1 Dye Intermediates Market Snapshot
1.2 Future Projections
1.3 Key Market Trends
1.4 Regional Snapshot
2. Market Overview
2.1 Market Definition and Report Scope
2.2 Historical Market Trends
2.3 Market Dynamics
2.3.1 Drivers
2.3.1.1 Rising Asian Textile Output Keeps Intermediate Offtake Firm
2.3.1.2 Shift Toward Reactive and Disperse Dyes Narrows Demand
2.3.2 Restraints
2.3.2.1 Environmental Compliance Costs Squeeze Producer Margins
2.3.2.2 Feedstock Price Swings Destabilise Contract Pricing
2.3.3 Market Opportunities
2.3.3.1 Supply Base Diversification Opens Room for New Producers
2.3.3.2 High-Purity Grades Create a Durable Premium Niche
3. Global Dye Intermediates Market Outlook, 2026–2033
3.1 Global Dye Intermediates Market Outlook, by Product Type, Value (US$ Billion), 2026–2033
3.1.1 Aniline and Derivatives
3.1.2 Naphthalene Derivatives
3.1.3 Vinyl Sulphone-based Intermediates
3.1.4 Anthraquinone Derivatives
3.1.5 Others
3.2 Global Dye Intermediates Market Outlook, by Application, Value (US$ Billion), 2026–2033
3.2.1 Reactive Dyes
3.2.2 Disperse Dyes
3.2.3 Acid Dyes
3.2.4 Direct Dyes
3.2.5 Vat and Sulphur Dyes
3.2.6 Pigments
3.3 Global Dye Intermediates Market Outlook, by End-use Industry, Value (US$ Billion), 2026–2033
3.3.1 Textiles
3.3.2 Printing Inks and Coatings
3.3.3 Leather
3.3.4 Paper
3.3.5 Plastics
3.3.6 Others
3.4 Global Dye Intermediates Market Outlook, by Grade, Value (US$ Billion), 2026–2033
3.4.1 Standard Grade
3.4.2 High-purity Grade
3.4.3 Specialty Low-metal Grade
3.5 Global Dye Intermediates Market Outlook, by Region, Value (US$ Billion), 2026–2033
3.5.1 North America
3.5.2 Europe
3.5.3 Asia Pacific
3.5.4 Latin America
3.5.5 Middle East & Africa
4. North America Dye Intermediates Market Outlook, 2026–2033
4.1 North America Dye Intermediates Market Outlook, by Product Type, Value (US$ Billion), 2026–2033
4.1.1 Aniline and Derivatives
4.1.2 Naphthalene Derivatives
4.1.3 Vinyl Sulphone-based Intermediates
4.1.4 Anthraquinone Derivatives
4.1.5 Others
4.2 North America Dye Intermediates Market Outlook, by Application, Value (US$ Billion), 2026–2033
4.2.1 Reactive Dyes
4.2.2 Disperse Dyes
4.2.3 Acid Dyes
4.2.4 Direct Dyes
4.2.5 Vat and Sulphur Dyes
4.2.6 Pigments
4.3 North America Dye Intermediates Market Outlook, by End-use Industry, Value (US$ Billion), 2026–2033
4.3.1 Textiles
4.3.2 Printing Inks and Coatings
4.3.3 Leather
4.3.4 Paper
4.3.5 Plastics
4.3.6 Others
4.4 North America Dye Intermediates Market Outlook, by Grade, Value (US$ Billion), 2026–2033
4.4.1 Standard Grade
4.4.2 High-purity Grade
4.4.3 Specialty Low-metal Grade
4.5 North America Dye Intermediates Market Outlook, by Country, Value (US$ Billion), 2026–2033
4.5.1 United States Dye Intermediates Market Outlook, by Product Type, 2026–2033
4.5.2 United States Dye Intermediates Market Outlook, by Application, 2026–2033
4.5.3 United States Dye Intermediates Market Outlook, by End-use Industry, 2026–2033
4.5.4 United States Dye Intermediates Market Outlook, by Grade, 2026–2033
4.5.5 Mexico Dye Intermediates Market Outlook, by Product Type, 2026–2033
4.5.6 Mexico Dye Intermediates Market Outlook, by Application, 2026–2033
4.5.7 Mexico Dye Intermediates Market Outlook, by End-use Industry, 2026–2033
4.5.8 Mexico Dye Intermediates Market Outlook, by Grade, 2026–2033
5. Europe Dye Intermediates Market Outlook, 2026–2033
5.1 Europe Dye Intermediates Market Outlook, by Product Type, Value (US$ Billion), 2026–2033
5.1.1 Aniline and Derivatives
5.1.2 Naphthalene Derivatives
5.1.3 Vinyl Sulphone-based Intermediates
5.1.4 Anthraquinone Derivatives
5.1.5 Others
5.2 Europe Dye Intermediates Market Outlook, by Application, Value (US$ Billion), 2026–2033
5.2.1 Reactive Dyes
5.2.2 Disperse Dyes
5.2.3 Acid Dyes
5.2.4 Direct Dyes
5.2.5 Vat and Sulphur Dyes
5.2.6 Pigments
5.3 Europe Dye Intermediates Market Outlook, by End-use Industry, Value (US$ Billion), 2026–2033
5.3.1 Textiles
5.3.2 Printing Inks and Coatings
5.3.3 Leather
5.3.4 Paper
5.3.5 Plastics
5.3.6 Others
5.4 Europe Dye Intermediates Market Outlook, by Grade, Value (US$ Billion), 2026–2033
5.4.1 Standard Grade
5.4.2 High-purity Grade
5.4.3 Specialty Low-metal Grade
5.5 Europe Dye Intermediates Market Outlook, by Country, Value (US$ Billion), 2026–2033
5.5.1 Germany Dye Intermediates Market Outlook, by Product Type, 2026–2033
5.5.2 Germany Dye Intermediates Market Outlook, by Application, 2026–2033
5.5.3 Germany Dye Intermediates Market Outlook, by End-use Industry, 2026–2033
5.5.4 Germany Dye Intermediates Market Outlook, by Grade, 2026–2033
5.5.5 Switzerland Dye Intermediates Market Outlook, by Product Type, 2026–2033
5.5.6 Switzerland Dye Intermediates Market Outlook, by Application, 2026–2033
5.5.7 Switzerland Dye Intermediates Market Outlook, by End-use Industry, 2026–2033
5.5.8 Switzerland Dye Intermediates Market Outlook, by Grade, 2026–2033
5.5.9 Italy Dye Intermediates Market Outlook, by Product Type, 2026–2033
5.5.10 Italy Dye Intermediates Market Outlook, by Application, 2026–2033
5.5.11 Italy Dye Intermediates Market Outlook, by End-use Industry, 2026–2033
5.5.12 Italy Dye Intermediates Market Outlook, by Grade, 2026–2033
5.5.13 Spain Dye Intermediates Market Outlook, by Product Type, 2026–2033
5.5.14 Spain Dye Intermediates Market Outlook, by Application, 2026–2033
5.5.15 Spain Dye Intermediates Market Outlook, by End-use Industry, 2026–2033
5.5.16 Spain Dye Intermediates Market Outlook, by Grade, 2026–2033
5.5.17 Turkey Dye Intermediates Market Outlook, by Product Type, 2026–2033
5.5.18 Turkey Dye Intermediates Market Outlook, by Application, 2026–2033
5.5.19 Turkey Dye Intermediates Market Outlook, by End-use Industry, 2026–2033
5.5.20 Turkey Dye Intermediates Market Outlook, by Grade, 2026–2033
5.5.21 Portugal Dye Intermediates Market Outlook, by Product Type, 2026–2033
5.5.22 Portugal Dye Intermediates Market Outlook, by Application, 2026–2033
5.5.23 Portugal Dye Intermediates Market Outlook, by End-use Industry, 2026–2033
5.5.24 Portugal Dye Intermediates Market Outlook, by Grade, 2026–2033
6. Asia Pacific Dye Intermediates Market Outlook, 2026–2033
6.1 Asia Pacific Dye Intermediates Market Outlook, by Product Type, Value (US$ Billion), 2026–2033
6.1.1 Aniline and Derivatives
6.1.2 Naphthalene Derivatives
6.1.3 Vinyl Sulphone-based Intermediates
6.1.4 Anthraquinone Derivatives
6.1.5 Others
6.2 Asia Pacific Dye Intermediates Market Outlook, by Application, Value (US$ Billion), 2026–2033
6.2.1 Reactive Dyes
6.2.2 Disperse Dyes
6.2.3 Acid Dyes
6.2.4 Direct Dyes
6.2.5 Vat and Sulphur Dyes
6.2.6 Pigments
6.3 Asia Pacific Dye Intermediates Market Outlook, by End-use Industry, Value (US$ Billion), 2026–2033
6.3.1 Textiles
6.3.2 Printing Inks and Coatings
6.3.3 Leather
6.3.4 Paper
6.3.5 Plastics
6.3.6 Others
6.4 Asia Pacific Dye Intermediates Market Outlook, by Grade, Value (US$ Billion), 2026–2033
6.4.1 Standard Grade
6.4.2 High-purity Grade
6.4.3 Specialty Low-metal Grade
6.5 Asia Pacific Dye Intermediates Market Outlook, by Country, Value (US$ Billion), 2026–2033
6.5.1 China Dye Intermediates Market Outlook, by Product Type, 2026–2033
6.5.2 China Dye Intermediates Market Outlook, by Application, 2026–2033
6.5.3 China Dye Intermediates Market Outlook, by End-use Industry, 2026–2033
6.5.4 China Dye Intermediates Market Outlook, by Grade, 2026–2033
6.5.5 India Dye Intermediates Market Outlook, by Product Type, 2026–2033
6.5.6 India Dye Intermediates Market Outlook, by Application, 2026–2033
6.5.7 India Dye Intermediates Market Outlook, by End-use Industry, 2026–2033
6.5.8 India Dye Intermediates Market Outlook, by Grade, 2026–2033
6.5.9 Bangladesh Dye Intermediates Market Outlook, by Product Type, 2026–2033
6.5.10 Bangladesh Dye Intermediates Market Outlook, by Application, 2026–2033
6.5.11 Bangladesh Dye Intermediates Market Outlook, by End-use Industry, 2026–2033
6.5.12 Bangladesh Dye Intermediates Market Outlook, by Grade, 2026–2033
6.5.13 Vietnam Dye Intermediates Market Outlook, by Product Type, 2026–2033
6.5.14 Vietnam Dye Intermediates Market Outlook, by Application, 2026–2033
6.5.15 Vietnam Dye Intermediates Market Outlook, by End-use Industry, 2026–2033
6.5.16 Vietnam Dye Intermediates Market Outlook, by Grade, 2026–2033
6.5.17 Indonesia Dye Intermediates Market Outlook, by Product Type, 2026–2033
6.5.18 Indonesia Dye Intermediates Market Outlook, by Application, 2026–2033
6.5.19 Indonesia Dye Intermediates Market Outlook, by End-use Industry, 2026–2033
6.5.20 Indonesia Dye Intermediates Market Outlook, by Grade, 2026–2033
7. Latin America Dye Intermediates Market Outlook, 2026–2033
7.1 Latin America Dye Intermediates Market Outlook, by Product Type, Value (US$ Billion), 2026–2033
7.1.1 Aniline and Derivatives
7.1.2 Naphthalene Derivatives
7.1.3 Vinyl Sulphone-based Intermediates
7.1.4 Anthraquinone Derivatives
7.1.5 Others
7.2 Latin America Dye Intermediates Market Outlook, by Application, Value (US$ Billion), 2026–2033
7.2.1 Reactive Dyes
7.2.2 Disperse Dyes
7.2.3 Acid Dyes
7.2.4 Direct Dyes
7.2.5 Vat and Sulphur Dyes
7.2.6 Pigments
7.3 Latin America Dye Intermediates Market Outlook, by End-use Industry, Value (US$ Billion), 2026–2033
7.3.1 Textiles
7.3.2 Printing Inks and Coatings
7.3.3 Leather
7.3.4 Paper
7.3.5 Plastics
7.3.6 Others
7.4 Latin America Dye Intermediates Market Outlook, by Grade, Value (US$ Billion), 2026–2033
7.4.1 Standard Grade
7.4.2 High-purity Grade
7.4.3 Specialty Low-metal Grade
7.5 Latin America Dye Intermediates Market Outlook, by Country, Value (US$ Billion), 2026–2033
7.5.1 Brazil Dye Intermediates Market Outlook, by Product Type, 2026–2033
7.5.2 Brazil Dye Intermediates Market Outlook, by Application, 2026–2033
7.5.3 Brazil Dye Intermediates Market Outlook, by End-use Industry, 2026–2033
7.5.4 Brazil Dye Intermediates Market Outlook, by Grade, 2026–2033
7.5.5 Mexico Dye Intermediates Market Outlook, by Product Type, 2026–2033
7.5.6 Mexico Dye Intermediates Market Outlook, by Application, 2026–2033
7.5.7 Mexico Dye Intermediates Market Outlook, by End-use Industry, 2026–2033
7.5.8 Mexico Dye Intermediates Market Outlook, by Grade, 2026–2033
7.5.9 Colombia Dye Intermediates Market Outlook, by Product Type, 2026–2033
7.5.10 Colombia Dye Intermediates Market Outlook, by Application, 2026–2033
7.5.11 Colombia Dye Intermediates Market Outlook, by End-use Industry, 2026–2033
7.5.12 Colombia Dye Intermediates Market Outlook, by Grade, 2026–2033
7.5.13 Argentina Dye Intermediates Market Outlook, by Product Type, 2026–2033
7.5.14 Argentina Dye Intermediates Market Outlook, by Application, 2026–2033
7.5.15 Argentina Dye Intermediates Market Outlook, by End-use Industry, 2026–2033
7.5.16 Argentina Dye Intermediates Market Outlook, by Grade, 2026–2033
8. Middle East & Africa Dye Intermediates Market Outlook, 2026–2033
8.1 Middle East & Africa Dye Intermediates Market Outlook, by Product Type, Value (US$ Billion), 2026–2033
8.1.1 Aniline and Derivatives
8.1.2 Naphthalene Derivatives
8.1.3 Vinyl Sulphone-based Intermediates
8.1.4 Anthraquinone Derivatives
8.1.5 Others
8.2 Middle East & Africa Dye Intermediates Market Outlook, by Application, Value (US$ Billion), 2026–2033
8.2.1 Reactive Dyes
8.2.2 Disperse Dyes
8.2.3 Acid Dyes
8.2.4 Direct Dyes
8.2.5 Vat and Sulphur Dyes
8.2.6 Pigments
8.3 Middle East & Africa Dye Intermediates Market Outlook, by End-use Industry, Value (US$ Billion), 2026–2033
8.3.1 Textiles
8.3.2 Printing Inks and Coatings
8.3.3 Leather
8.3.4 Paper
8.3.5 Plastics
8.3.6 Others
8.4 Middle East & Africa Dye Intermediates Market Outlook, by Grade, Value (US$ Billion), 2026–2033
8.4.1 Standard Grade
8.4.2 High-purity Grade
8.4.3 Specialty Low-metal Grade
8.5 Middle East & Africa Dye Intermediates Market Outlook, by Country, Value (US$ Billion), 2026–2033
8.5.1 Turkey Dye Intermediates Market Outlook, by Product Type, 2026–2033
8.5.2 Turkey Dye Intermediates Market Outlook, by Application, 2026–2033
8.5.3 Turkey Dye Intermediates Market Outlook, by End-use Industry, 2026–2033
8.5.4 Turkey Dye Intermediates Market Outlook, by Grade, 2026–2033
8.5.5 Egypt Dye Intermediates Market Outlook, by Product Type, 2026–2033
8.5.6 Egypt Dye Intermediates Market Outlook, by Application, 2026–2033
8.5.7 Egypt Dye Intermediates Market Outlook, by End-use Industry, 2026–2033
8.5.8 Egypt Dye Intermediates Market Outlook, by Grade, 2026–2033
8.5.9 Ethiopia Dye Intermediates Market Outlook, by Product Type, 2026–2033
8.5.10 Ethiopia Dye Intermediates Market Outlook, by Application, 2026–2033
8.5.11 Ethiopia Dye Intermediates Market Outlook, by End-use Industry, 2026–2033
8.5.12 Ethiopia Dye Intermediates Market Outlook, by Grade, 2026–2033
8.5.13 South Africa Dye Intermediates Market Outlook, by Product Type, 2026–2033
8.5.14 South Africa Dye Intermediates Market Outlook, by Application, 2026–2033
8.5.15 South Africa Dye Intermediates Market Outlook, by End-use Industry, 2026–2033
8.5.16 South Africa Dye Intermediates Market Outlook, by Grade, 2026–2033
9. Competitive Landscape
9.1 Industry Leaders
9.2 Company Profiles
9.2.1 Zhejiang Longsheng Group Co., Ltd.
9.2.2 Zhejiang Runtu Co., Ltd.
9.2.3 Atul Ltd
9.2.4 Aarti Industries Limited
9.2.5 Kiri Industries Limited
9.2.6 Bodal Chemicals Limited
9.2.7 Deepak Nitrite Limited
9.2.8 Shree Pushkar Chemicals & Fertilisers Limited
9.2.9 Jaysynth Dyestuff (India) Ltd.
9.2.10 Sudarshan Chemical Industries Limited
9.2.11 Archroma
9.2.12 DyStar Group
9.2.13 Huntsman Corporation
9.2.14 LANXESS AG
9.2.15 Nippon Kayaku Co., Ltd.
9.2.16 Sumitomo Chemical Co., Ltd.
10. Appendix
10.1 Research Methodology
10.2 Report Assumptions
10.3 Acronyms and Abbreviations
| By Product Type | Aniline and Derivatives, Naphthalene Derivatives, Vinyl Sulphone-based Intermediates, Anthraquinone Derivatives, Others |
| By Application | Reactive Dyes, Disperse Dyes, Acid Dyes, Direct Dyes, Vat and Sulphur Dyes, Pigments |
| By End-use Industry | Textiles, Printing Inks and Coatings, Leather, Paper, Plastics, Others |
| By Grade | Standard Grade, High-purity Grade, Specialty Low-metal Grade |
| By Region | North America, Europe, Asia Pacific, Latin America, Middle East & Africa |
Our Research Methodology
Considering the volatility of business today, traditional approaches to strategizing a game plan can be unfruitful if not detrimental. True ambiguity is no way to determine a forecast. A myriad of predetermined factors must be accounted for such as the degree of risk involved, the magnitude of circumstances, as well as conditions or consequences that are not known or unpredictable. To circumvent binary views that cast uncertainty, the application of market research intelligence to strategically posture, move, and enable actionable outcomes is necessary.
View Methodology
Quality Assured
Rigorous Validation Process

Confidentiality Assured
End-to-end Data Security

Custom Research Services
Tailored To Your Objectives
FAQs
The global dye intermediates market is valued at US$ 9.2 billion in 2026, supported mainly by textile dyeing demand across Asia Pacific production clusters.
The market is projected to reach US$ 13.3 billion by 2033, expanding at a 5.4% CAGR and adding US$ 4.1 billion in absolute opportunity.
Aniline and its derivatives led with a 31% share in 2026, because the class supports both azo dye and pigment chemistry at scale.
Asia Pacific dominates with a 66% share in 2026, led by integrated producers in China and India sitting close to downstream dye capacity.
Principal producers include Zhejiang Longsheng Group Co., Ltd., Atul Ltd, Aarti Industries Limited, Kiri Industries Limited, Archroma, DyStar Group and LANXESS AG.
Related Reports
Bio-based Epoxy Resin Market Size, Share, Insights, Competitive Landscape, and Forecast 2026 to 2033
The global bio-based epoxy resin market is valued at US$1.28 billion in 2026, reaching US$2.58 billion by 2033, growing at a 10.5% CAGR
Metallic Stearates Market Size, Share, Insights, Competitive Landscape, and Forecast 2026 to 2033
Explore the metallic stearates market, forecast to reach US$2.34 billion by 2033 at 5.9% CAGR, with insights on types, grades, applications, and regions.
Ketones Market Size, Share, Insights, Competitive Landscape, and Forecast 2026 to 2033
Explore the ketones market, projected to reach US$34.45 billion by 2033 at 4.3% CAGR, with insights on types, applications, regions, and key companies.
Ethyl Benzene Market Size, Share, Insights, Competitive Landscape, and Forecast 2026 to 2033
Explore the Ethyl Benzene market, projected to reach US$52.6 billion by 2033 at 4.6% CAGR, with insights on applications, regions, and key companies.
Polyurethane Elastomers Market Size, Share, Insights, Competitive Landscape, and Forecast 2026 to 2033
The global polyurethane elastomers market is valued at US$9.8 billion in 2026, reaching US$14.9 billion by 2033, growing at a 6.2% CAGR
Medical Flexible Packaging Market Size, Share, Insights, Competitive Landscape, and Forecast 2026 to 2033
The global medical flexible packaging market is valued at US$33.27 billion in 2026, reaching US$47.66 billion by 2033, growing at a 5.3% CAGR