



FDM Candle Market
FDM Candle Market Size, Share, Insights, Competitive Landscape, and Forecast 2026 to 2033
Report Overview
FDM Candle Market Size and Trend Analysis
How Fast Will FDM Candle Sales Grow Through 2033?
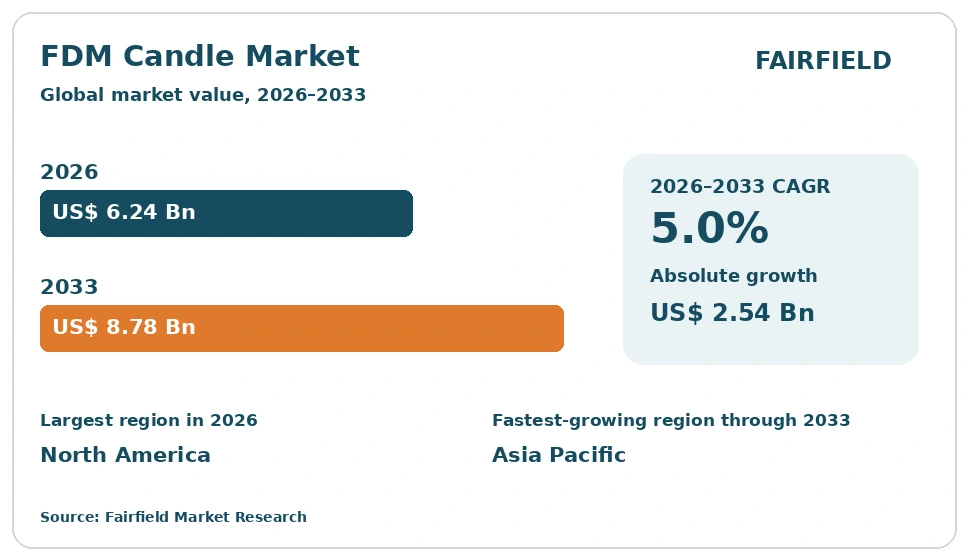
The global FDM Candle market size is expected to be valued at US$ 6.24 billion in 2026 and projected to reach US$ 8.78 billion by 2033, growing at a CAGR of 5.0% between 2026 and 2033. Growth rests on the food, drug and mass retail channel, where candles sell as everyday home items rather than gift purchases. Wider planograms, steady seasonal resets and sharper private-label programs keep unit volumes rising across grocery, drugstore and mass merchandise shelves. Shoppers buy scented jars for routine mood and odor control, so repeat purchase cycles shorten. Value pricing protects demand when household budgets tighten, and the absolute dollar opportunity of US$ 2.54 billion reflects steady basket penetration rather than one seasonal spike.
Key Report Takeaways
- By Product Type: Jar and container candles led with 42.0% share in 2026, while wax melts and warmers are projected to expand at a 6.4% CAGR through 2033, driven by rental housing rules that bar open flames indoors.
- By Wax Type: Paraffin led with 48.0% share in 2026, while soy and vegetable wax is projected to expand at a 7.1% CAGR through 2033, driven by plant-based content claims printed on mass-channel front-of-pack labels.
- By Price Tier: The mid-tier band led with 46.0% share in 2026, while the upper-mass tier is projected to expand at a 6.2% CAGR through 2033, driven by designer-led collections placed inside retailer own-brand ranges.
- By Retail Format: Mass merchandise and supercenters led with 38.0% share in 2026, while value and dollar stores are projected to expand at a 6.0% CAGR through 2033, driven by chain store openings across smaller towns.
- By Region: North America led with 41.0% share in 2026, while Asia Pacific is projected to expand at a 6.8% CAGR through 2033; coverage spans North America, Europe, Asia Pacific, Latin America and Middle East & Africa.
Market Trends and Insights
Market Growth Drivers
Everyday Scent Routines Move Candles Into Weekly Grocery Baskets
Routine home fragrance use is the largest single demand lift for candles sold through food, drug and mass retail. Shoppers treat a scented jar as a household staple, close to air fresheners and cleaning supplies, rather than a gift. That shift moves candles out of occasional gift aisles and into weekly grocery baskets, which raises purchase frequency and steadies volume across the calendar.
Store planograms now place candles beside home care and seasonal décor, so the category picks up traffic it did not previously capture. Fragrance houses supply mass brands with scent profiles tuned to kitchens, bathrooms and laundry rooms, which widens the number of use occasions in a single home. Smaller jar sizes and multi-packs lower the trial barrier for first-time buyers. Shelf signage and in-store media keep the category visible outside the autumn peak, supporting year-round turns.
Private-Label Programs Widen Candle Shelf Space in Mass Retail
Retailer own-brand candle programs are expanding the shelf space the category receives across grocery, drugstore and mass merchandise formats. Private label gives chains better margin per facing than many national brands, so buyers allocate more linear footage to candles. Broader assortments, in turn, raise category sales without requiring a higher average price, which suits the value positioning of the channel.
Contract manufacturers in North America, Europe and Asia now supply finished candles built to retailer-specified vessels, fragrance oils and labeling. That capability lets chains refresh scent stories two or three times a year at modest cost. National brands answer with licensed scents, improved wax blends and clearer burn-time claims to defend their facings. The result is a deeper candle set in stores that once carried a single seasonal endcap for a few autumn weeks.
Restraints Impact Analysis of Market
Wax and Fragrance Input Costs Squeeze Opening Price Tiers
Input cost volatility limits growth at the opening price points that drive unit volume in the channel. Paraffin is tied to refinery output, soy and palm waxes track agricultural cycles, and fragrance oils carry their own supply constraints. When these costs rise together, manufacturers cannot pass the increase through on a candle priced below US$ 5 without losing the shopper who buys on price alone.
Glass vessels, metal lids and freight add further pressure, since candles are heavy and costly to ship relative to their value. Makers respond by trimming fill weight, simplifying décor or switching to lighter containers, which can weaken the perceived value that mass shoppers expect. Some retailers narrow the opening price assortment instead, protecting margin while reducing the entry ramp that brings new households into the category each year.
Safety Rules and Flame-Free Alternatives Cap Candle Volume
Fire safety concerns and tightening product rules restrain candle volume across parts of the channel. Rental housing, student accommodation and many care settings restrict open flames outright, which removes whole groups of potential buyers from the addressable base. Households with young children or pets often reach the same decision on their own. The outcome is a ceiling on penetration that promotional pricing alone cannot lift.
Candle makers must meet fire-safety and labeling expectations shaped through bodies such as ASTM International, the National Candle Association and the European Candle Association, alongside fragrance ingredient practice guided by the International Fragrance Association. Compliance work raises testing and documentation costs, particularly for smaller private-label suppliers. Plug-in warmers, reed diffusers and battery-operated alternatives then compete for the same home fragrance budget on the same aisle.
Market Opportunities
Seasonal Resets Create Room for Limited-Edition Mass Collections
Scheduled seasonal resets give the category repeatable revenue that does not depend on winning permanent shelf space. Mass and grocery chains refresh home décor sets several times a year, and candles fit each reset with new scents, colors and vessel designs. Limited-edition runs sell above core items, lifting category value without disturbing the everyday price ladder that shoppers rely on.
Short production cycles suit candle manufacturing, since fragrance and label changes cost far less than retooling a rigid moulded product. Suppliers holding spare wax capacity and fast filling lines can quote narrow lead times, which buyers reward with larger orders. Retail buyers plan these windows a year in advance. Collections tied to holidays, regional traditions and food-inspired scents also create social media interest that pulls younger shoppers into grocery and drug aisles they might otherwise skip.
Flame-Free Formats Open New Space Beside Traditional Candles
Wax melts, warmers and refill systems create incremental revenue beside the traditional candle set rather than cannibalizing it. These formats reach households that avoid open flames, and they generate repeat refill purchases at higher frequency than a single jar delivers. For retailers, the razor-and-blade pattern improves sales per foot across the whole home fragrance aisle.
Manufacturing overlaps closely with candle production, so existing wax blending, fragrance dosing and filling assets can be reused with limited new capital. Private-label suppliers can enter quickly as a result, matching retailer scent stories across both formats. Refill packs also raise the number of purchase occasions each year. Pairing a warmer with a familiar jar fragrance builds brand memory at low cost. Electrical safety and packaging requirements add work, yet the category economics stay attractive for mass channel buyers.
Category-wise Insights
Jar Formats Anchor Mass Candle Shelves While Melts Accelerate
Jar and container candles hold the largest position in the channel, with 42.0% share in 2026. The format ships well, stacks cleanly on shelf and carries a printed lid that communicates scent and brand at a glance. Mass and grocery buyers favor it because breakage is low and the vessel supports both opening price and mid-tier versions of the same fragrance. Wax melts and warmers are the fastest-growing product type, set to advance at a 6.4% CAGR through 2033. Demand comes from flame-free households and from refill economics that bring shoppers back more often. Votive and tealight multi-packs remain the volume entry point, while pillar and taper candles hold steady dining and seasonal roles. For suppliers the implication is direct: defend jar facings, and use melts to claim incremental aisle space.
Which Wax Type Dominates FDM Candle Shelves?
Paraffin dominates FDM candle shelves, holding 48.0% share in 2026 on the strength of cost, scent throw and supply reliability. Refined paraffin melts predictably and carries high fragrance loads, which matters when a candle must perform at a mass price point. Large private-label runs depend on that consistency. Soy and vegetable wax is the fastest-growing wax type, projected to rise at a 7.1% CAGR through 2033, as shoppers read front-of-pack claims about plant-based and renewable content. Blended waxes let manufacturers balance burn quality against cost, and they now carry much of the mid-tier assortment. Beeswax and palm wax stay niche, held back by price and sourcing scrutiny. The practical effect is a two-track shelf, where paraffin and blends protect volume while soy builds the claims that lift average selling price.
Mid-Tier Price Points Hold the Center of Candle Planograms
The mid-tier band, covering candles priced between US$ 5 and US$ 12, leads with 46.0% share in 2026. This is where fragrance quality, vessel design and burn time meet the spending comfort of the mass shopper. Retail buyers build the core planogram here because the band sustains promotion without eroding margin. The upper-mass tier, above US$ 12, is the fastest grower at a 6.2% CAGR through 2033, carried by larger multi-wick jars, designer collaborations and gift-ready packaging that chains now place inside their own brands. Opening price candles below US$ 5 still recruit new households and anchor seasonal volume. Spreading demand across three bands gives suppliers room to trade shoppers up within a single aisle, which protects category value when unit growth slows.
Supercenters Lead Candle Distribution as Value Stores Gain Share
Mass merchandise and supercenter formats account for 38.0% of channel sales in 2026, the largest retail format share. Their floor space supports full home fragrance sets, seasonal endcaps and private-label tiers side by side. Supermarkets and grocery stores follow, converting high visit frequency into steady replenishment of smaller jars and tealights. Value and dollar stores are the fastest-growing format, expanding at a 6.0% CAGR through 2033, as chains add locations in smaller towns and hold candles at fixed low price points that suit tight budgets. Warehouse clubs move large multi-packs, while drug stores carry edited sets built around gifting and impulse. Assortment depth varies widely from one format to the next. For manufacturers, format choice now dictates pack size, vessel cost and fragrance strength more than brand positioning does.
Geography Analysis
Which Region Is Leading the FDM Candle Market?
North America leads the market with 41.0% share in 2026, supported by the deepest mass retail network for home fragrance anywhere. The United States contributes most of that total, where supercenters, grocery chains, drug stores and club formats all carry candle sets year round. Canadian demand follows similar seasonal patterns at smaller scale. Domestic filling capacity across the Midwest and the Carolinas lets suppliers serve retailer resets with short lead times. Fire-safety labeling practice shaped through ASTM International and the National Candle Association is well established, so compliance is routine rather than a barrier to entry. Cold winters, strong holiday gifting and a settled household habit of scenting living spaces keep repeat purchase high across all three price bands.
Europe Balances Mature Grocery Demand With Strict Product Rules
Europe holds 28.0% share in 2026, anchored by Germany, the United Kingdom, France, Poland and the Netherlands. Discount grocery chains are central here, and their rapid own-brand turnover keeps candle assortments fresh and keenly priced. Poland serves as the regional manufacturing base, supplying private-label jars, tealights and pillars to retailers across the continent. Chemical labeling and fragrance allergen disclosure rules are detailed, and practice guided by the European Candle Association and the International Fragrance Association shapes formulation choices. Volume demand is mature, so value growth comes from trading shoppers up to larger vessels and natural wax blends. Church, dining and winter rituals also sustain pillar and taper sales that have faded in other regions.
Which Region Is Growing Fastest in the FDM Candle Market?
Asia Pacific is growing fastest, at a 6.8% CAGR from 2026 to 2033 on a 19.0% share base in 2026. China, India, Japan, Australia and South Korea drive the gain as modern grocery and drugstore formats spread beyond the largest cities. Rising apartment ownership, smaller households and growing interest in home scenting lift first-time purchase rates. China and Vietnam also host large candle manufacturing capacity, which keeps landed costs low for regional retailers and supports export volume. Local fragrance preferences lean toward lighter floral, citrus and tea profiles, so brands reformulate rather than copy Western scent sets. Festival calendars across the region add several demand peaks each year.
Latin America Builds Candle Volume Through Discount Grocery Growth
Latin America represents 7.0% of the market in 2026, with Brazil and Mexico supplying most of the demand. Growth tracks the spread of discount grocery and pharmacy chains into secondary cities, where candles enter the basket at opening price points. Devotional and household use both matter, which keeps tealights, votives and small pillars central to the assortment. Regional manufacturers in Brazil cover much of the volume, limiting exposure to import costs and currency swings. Power reliability gaps in some markets sustain practical candle demand alongside scented lines. Retailers keep pack sizes small and pricing stable, since affordability governs purchase more than fragrance novelty across most of the region.
Middle East & Africa Leans on Hospitality and Seasonal Demand
Middle East & Africa accounts for 5.0% of the market in 2026, the smallest regional position. The United Arab Emirates, Saudi Arabia, Egypt, Turkey and South Africa hold most of the organized retail base. Hypermarket chains in the Gulf carry broad home fragrance sets, and strong local attachment to oud, amber and incense notes shapes scent selection. Ramadan, Eid and the winter hosting season create concentrated demand peaks that retailers plan their buying around. In parts of Africa, utility candles still serve households facing intermittent power, supporting volume at the lowest price tier. Import dependence raises shelf prices, so growth leans on grocery expansion and local filling capacity.
Competitive Landscape
The market is moderately fragmented. A small group of consumer goods companies controls the branded home fragrance space in mass retail, while a long tail of contract manufacturers supplies retailer own brands. That split matters because shelf space is won through retailer relationships and reset performance rather than advertising weight alone. Private-label share has climbed as chains build tiered own-brand ranges, which pushes branded suppliers to defend facings with scent innovation and clearer burn claims.
Competition centers on fragrance quality, burn performance, vessel design and cost per unit. Wax blending know-how decides whether a candle throws scent at a mass price, and automated filling lines decide whether a supplier can quote the volumes a national reset requires. Sustainability claims, including plant-based waxes, recycled glass and recyclable cartons, now appear on front-of-pack across every price tier. Smaller regional fillers compete on speed and flexibility, winning limited-edition programs that larger plants find awkward to schedule.
Strategic activity concentrates on capacity, formats and proximity to retail customers. Suppliers add filling capacity and warehouse space close to distribution hubs, since freight is a large share of delivered cost for a heavy, low-value item. Several have extended from candles into wax melts, warmers and diffusers to hold a wider share of the aisle. Investment in fragrance development partnerships and in safety testing capability is rising, because retailers audit supplier documentation closely before awarding a program.
Vendor strategy is moving toward dual-track portfolios that serve branded and private-label demand from the same plants, paired with faster seasonal development cycles and clearer substantiation behind sustainability claims.
Industry Leaders
- Newell Brands Inc.
- S. C. Johnson & Son, Inc.
- Reckitt Benckiser Group plc
- The Procter & Gamble Company
- Candle-lite Company
- MVP Group International, Inc.
- Korona Candles S.A.
Companies Covered in the Report
- Newell Brands Inc.
- S. C. Johnson & Son, Inc.
- Reckitt Benckiser Group plc
- The Procter & Gamble Company
- Candle-lite Company
- MVP Group International, Inc.
- Korona Candles S.A.
- Bolsius International B.V.
- Gies Kerzen GmbH
- Bispol Sp. z o.o.
- Empire Candle Co., LLC
- Hanna’s Candle Company
- The A. I. Root Company
- Luminex Home Décor & Fragrance Holdings Corp.
FDM Candle Market Report Scope
The market is segmented by product type, wax type, price tier, retail format and region.
| By Product Type | Jar and container candles, Votive and tealight candles, Pillar candles, Wax melts and warmers, Taper candles, Other formats |
| By Wax Type | Paraffin wax, Soy and vegetable wax, Blended wax, Palm wax, Beeswax |
| By Price Tier | Opening price, Mid-tier, Upper-mass |
| By Retail Format | Mass merchandise and supercenters, Supermarkets and grocery stores, Value and dollar stores, Warehouse clubs, Drug stores and pharmacies |
| By Region | North America, Europe, Asia Pacific, Latin America, Middle East & Africa |
1. Executive Summary
1.1 FDM Candle Market Snapshot
1.2 Future Projections
1.3 Key Industry Highlights
1.4 Geographical Snapshot
2. Market Overview
2.1 Market Definition and Segmentation
2.2 Market Dynamics
2.2.1 Drivers
2.2.1.1 Everyday Scent Routines Move Candles Into Weekly Grocery Baskets
2.2.1.2 Private-Label Programs Widen Candle Shelf Space in Mass Retail
2.2.2 Restraints
2.2.2.1 Wax and Fragrance Input Costs Squeeze Opening Price Tiers
2.2.2.2 Safety Rules and Flame-Free Alternatives Cap Candle Volume
2.2.3 Market Opportunities
2.2.3.1 Seasonal Resets Create Room for Limited-Edition Mass Collections
2.2.3.2 Flame-Free Formats Open New Space Beside Traditional Candles
3. Global FDM Candle Market Outlook, 2026–2033
3.1 Global FDM Candle Market Outlook, by Product Type, Value (US$ Billion), 2026–2033
3.1.1 Jar and container candles
3.1.2 Votive and tealight candles
3.1.3 Pillar candles
3.1.4 Wax melts and warmers
3.1.5 Taper candles
3.1.6 Other formats
3.2 Global FDM Candle Market Outlook, by Wax Type, Value (US$ Billion), 2026–2033
3.2.1 Paraffin wax
3.2.2 Soy and vegetable wax
3.2.3 Blended wax
3.2.4 Palm wax
3.2.5 Beeswax
3.3 Global FDM Candle Market Outlook, by Price Tier, Value (US$ Billion), 2026–2033
3.3.1 Opening price
3.3.2 Mid-tier
3.3.3 Upper-mass
3.4 Global FDM Candle Market Outlook, by Retail Format, Value (US$ Billion), 2026–2033
3.4.1 Mass merchandise and supercenters
3.4.2 Supermarkets and grocery stores
3.4.3 Value and dollar stores
3.4.4 Warehouse clubs
3.4.5 Drug stores and pharmacies
3.5 Global FDM Candle Market Outlook, by Region, Value (US$ Billion), 2026–2033
3.5.1 North America
3.5.2 Europe
3.5.3 Asia Pacific
3.5.4 Latin America
3.5.5 Middle East & Africa
4. North America FDM Candle Market Outlook, 2026–2033
4.1 North America FDM Candle Market Outlook, by Product Type, Value (US$ Billion), 2026–2033
4.1.1 Jar and container candles
4.1.2 Votive and tealight candles
4.1.3 Pillar candles
4.1.4 Wax melts and warmers
4.1.5 Taper candles
4.1.6 Other formats
4.2 North America FDM Candle Market Outlook, by Wax Type, Value (US$ Billion), 2026–2033
4.2.1 Paraffin wax
4.2.2 Soy and vegetable wax
4.2.3 Blended wax
4.2.4 Palm wax
4.2.5 Beeswax
4.3 North America FDM Candle Market Outlook, by Price Tier, Value (US$ Billion), 2026–2033
4.3.1 Opening price
4.3.2 Mid-tier
4.3.3 Upper-mass
4.4 North America FDM Candle Market Outlook, by Retail Format, Value (US$ Billion), 2026–2033
4.4.1 Mass merchandise and supercenters
4.4.2 Supermarkets and grocery stores
4.4.3 Value and dollar stores
4.4.4 Warehouse clubs
4.4.5 Drug stores and pharmacies
4.5 North America FDM Candle Market Outlook, by Country, Value (US$ Billion), 2026–2033
4.5.1 United States FDM Candle Market Outlook, by Product Type, 2026–2033
4.5.2 United States FDM Candle Market Outlook, by Wax Type, 2026–2033
4.5.3 United States FDM Candle Market Outlook, by Price Tier, 2026–2033
4.5.4 United States FDM Candle Market Outlook, by Retail Format, 2026–2033
5. Europe FDM Candle Market Outlook, 2026–2033
5.1 Europe FDM Candle Market Outlook, by Product Type, Value (US$ Billion), 2026–2033
5.1.1 Jar and container candles
5.1.2 Votive and tealight candles
5.1.3 Pillar candles
5.1.4 Wax melts and warmers
5.1.5 Taper candles
5.1.6 Other formats
5.2 Europe FDM Candle Market Outlook, by Wax Type, Value (US$ Billion), 2026–2033
5.2.1 Paraffin wax
5.2.2 Soy and vegetable wax
5.2.3 Blended wax
5.2.4 Palm wax
5.2.5 Beeswax
5.3 Europe FDM Candle Market Outlook, by Price Tier, Value (US$ Billion), 2026–2033
5.3.1 Opening price
5.3.2 Mid-tier
5.3.3 Upper-mass
5.4 Europe FDM Candle Market Outlook, by Retail Format, Value (US$ Billion), 2026–2033
5.4.1 Mass merchandise and supercenters
5.4.2 Supermarkets and grocery stores
5.4.3 Value and dollar stores
5.4.4 Warehouse clubs
5.4.5 Drug stores and pharmacies
5.5 Europe FDM Candle Market Outlook, by Country, Value (US$ Billion), 2026–2033
5.5.1 Germany FDM Candle Market Outlook, by Product Type, 2026–2033
5.5.2 Germany FDM Candle Market Outlook, by Wax Type, 2026–2033
5.5.3 Germany FDM Candle Market Outlook, by Price Tier, 2026–2033
5.5.4 Germany FDM Candle Market Outlook, by Retail Format, 2026–2033
5.5.5 United Kingdom FDM Candle Market Outlook, by Product Type, 2026–2033
5.5.6 United Kingdom FDM Candle Market Outlook, by Wax Type, 2026–2033
5.5.7 United Kingdom FDM Candle Market Outlook, by Price Tier, 2026–2033
5.5.8 United Kingdom FDM Candle Market Outlook, by Retail Format, 2026–2033
5.5.9 France FDM Candle Market Outlook, by Product Type, 2026–2033
5.5.10 France FDM Candle Market Outlook, by Wax Type, 2026–2033
5.5.11 France FDM Candle Market Outlook, by Price Tier, 2026–2033
5.5.12 France FDM Candle Market Outlook, by Retail Format, 2026–2033
5.5.13 Poland FDM Candle Market Outlook, by Product Type, 2026–2033
5.5.14 Poland FDM Candle Market Outlook, by Wax Type, 2026–2033
5.5.15 Poland FDM Candle Market Outlook, by Price Tier, 2026–2033
5.5.16 Poland FDM Candle Market Outlook, by Retail Format, 2026–2033
5.5.17 Netherlands FDM Candle Market Outlook, by Product Type, 2026–2033
5.5.18 Netherlands FDM Candle Market Outlook, by Wax Type, 2026–2033
5.5.19 Netherlands FDM Candle Market Outlook, by Price Tier, 2026–2033
5.5.20 Netherlands FDM Candle Market Outlook, by Retail Format, 2026–2033
6. Asia Pacific FDM Candle Market Outlook, 2026–2033
6.1 Asia Pacific FDM Candle Market Outlook, by Product Type, Value (US$ Billion), 2026–2033
6.1.1 Jar and container candles
6.1.2 Votive and tealight candles
6.1.3 Pillar candles
6.1.4 Wax melts and warmers
6.1.5 Taper candles
6.1.6 Other formats
6.2 Asia Pacific FDM Candle Market Outlook, by Wax Type, Value (US$ Billion), 2026–2033
6.2.1 Paraffin wax
6.2.2 Soy and vegetable wax
6.2.3 Blended wax
6.2.4 Palm wax
6.2.5 Beeswax
6.3 Asia Pacific FDM Candle Market Outlook, by Price Tier, Value (US$ Billion), 2026–2033
6.3.1 Opening price
6.3.2 Mid-tier
6.3.3 Upper-mass
6.4 Asia Pacific FDM Candle Market Outlook, by Retail Format, Value (US$ Billion), 2026–2033
6.4.1 Mass merchandise and supercenters
6.4.2 Supermarkets and grocery stores
6.4.3 Value and dollar stores
6.4.4 Warehouse clubs
6.4.5 Drug stores and pharmacies
6.5 Asia Pacific FDM Candle Market Outlook, by Country, Value (US$ Billion), 2026–2033
6.5.1 China FDM Candle Market Outlook, by Product Type, 2026–2033
6.5.2 China FDM Candle Market Outlook, by Wax Type, 2026–2033
6.5.3 China FDM Candle Market Outlook, by Price Tier, 2026–2033
6.5.4 China FDM Candle Market Outlook, by Retail Format, 2026–2033
6.5.5 India FDM Candle Market Outlook, by Product Type, 2026–2033
6.5.6 India FDM Candle Market Outlook, by Wax Type, 2026–2033
6.5.7 India FDM Candle Market Outlook, by Price Tier, 2026–2033
6.5.8 India FDM Candle Market Outlook, by Retail Format, 2026–2033
6.5.9 Japan FDM Candle Market Outlook, by Product Type, 2026–2033
6.5.10 Japan FDM Candle Market Outlook, by Wax Type, 2026–2033
6.5.11 Japan FDM Candle Market Outlook, by Price Tier, 2026–2033
6.5.12 Japan FDM Candle Market Outlook, by Retail Format, 2026–2033
6.5.13 Australia FDM Candle Market Outlook, by Product Type, 2026–2033
6.5.14 Australia FDM Candle Market Outlook, by Wax Type, 2026–2033
6.5.15 Australia FDM Candle Market Outlook, by Price Tier, 2026–2033
6.5.16 Australia FDM Candle Market Outlook, by Retail Format, 2026–2033
6.5.17 South Korea FDM Candle Market Outlook, by Product Type, 2026–2033
6.5.18 South Korea FDM Candle Market Outlook, by Wax Type, 2026–2033
6.5.19 South Korea FDM Candle Market Outlook, by Price Tier, 2026–2033
6.5.20 South Korea FDM Candle Market Outlook, by Retail Format, 2026–2033
6.5.21 Vietnam FDM Candle Market Outlook, by Product Type, 2026–2033
6.5.22 Vietnam FDM Candle Market Outlook, by Wax Type, 2026–2033
6.5.23 Vietnam FDM Candle Market Outlook, by Price Tier, 2026–2033
6.5.24 Vietnam FDM Candle Market Outlook, by Retail Format, 2026–2033
7. Latin America FDM Candle Market Outlook, 2026–2033
7.1 Latin America FDM Candle Market Outlook, by Product Type, Value (US$ Billion), 2026–2033
7.1.1 Jar and container candles
7.1.2 Votive and tealight candles
7.1.3 Pillar candles
7.1.4 Wax melts and warmers
7.1.5 Taper candles
7.1.6 Other formats
7.2 Latin America FDM Candle Market Outlook, by Wax Type, Value (US$ Billion), 2026–2033
7.2.1 Paraffin wax
7.2.2 Soy and vegetable wax
7.2.3 Blended wax
7.2.4 Palm wax
7.2.5 Beeswax
7.3 Latin America FDM Candle Market Outlook, by Price Tier, Value (US$ Billion), 2026–2033
7.3.1 Opening price
7.3.2 Mid-tier
7.3.3 Upper-mass
7.4 Latin America FDM Candle Market Outlook, by Retail Format, Value (US$ Billion), 2026–2033
7.4.1 Mass merchandise and supercenters
7.4.2 Supermarkets and grocery stores
7.4.3 Value and dollar stores
7.4.4 Warehouse clubs
7.4.5 Drug stores and pharmacies
7.5 Latin America FDM Candle Market Outlook, by Country, Value (US$ Billion), 2026–2033
7.5.1 Brazil FDM Candle Market Outlook, by Product Type, 2026–2033
7.5.2 Brazil FDM Candle Market Outlook, by Wax Type, 2026–2033
7.5.3 Brazil FDM Candle Market Outlook, by Price Tier, 2026–2033
7.5.4 Brazil FDM Candle Market Outlook, by Retail Format, 2026–2033
7.5.5 Mexico FDM Candle Market Outlook, by Product Type, 2026–2033
7.5.6 Mexico FDM Candle Market Outlook, by Wax Type, 2026–2033
7.5.7 Mexico FDM Candle Market Outlook, by Price Tier, 2026–2033
7.5.8 Mexico FDM Candle Market Outlook, by Retail Format, 2026–2033
8. Middle East & Africa FDM Candle Market Outlook, 2026–2033
8.1 Middle East & Africa FDM Candle Market Outlook, by Product Type, Value (US$ Billion), 2026–2033
8.1.1 Jar and container candles
8.1.2 Votive and tealight candles
8.1.3 Pillar candles
8.1.4 Wax melts and warmers
8.1.5 Taper candles
8.1.6 Other formats
8.2 Middle East & Africa FDM Candle Market Outlook, by Wax Type, Value (US$ Billion), 2026–2033
8.2.1 Paraffin wax
8.2.2 Soy and vegetable wax
8.2.3 Blended wax
8.2.4 Palm wax
8.2.5 Beeswax
8.3 Middle East & Africa FDM Candle Market Outlook, by Price Tier, Value (US$ Billion), 2026–2033
8.3.1 Opening price
8.3.2 Mid-tier
8.3.3 Upper-mass
8.4 Middle East & Africa FDM Candle Market Outlook, by Retail Format, Value (US$ Billion), 2026–2033
8.4.1 Mass merchandise and supercenters
8.4.2 Supermarkets and grocery stores
8.4.3 Value and dollar stores
8.4.4 Warehouse clubs
8.4.5 Drug stores and pharmacies
8.5 Middle East & Africa FDM Candle Market Outlook, by Country, Value (US$ Billion), 2026–2033
8.5.1 United Arab Emirates FDM Candle Market Outlook, by Product Type, 2026–2033
8.5.2 United Arab Emirates FDM Candle Market Outlook, by Wax Type, 2026–2033
8.5.3 United Arab Emirates FDM Candle Market Outlook, by Price Tier, 2026–2033
8.5.4 United Arab Emirates FDM Candle Market Outlook, by Retail Format, 2026–2033
8.5.5 Saudi Arabia FDM Candle Market Outlook, by Product Type, 2026–2033
8.5.6 Saudi Arabia FDM Candle Market Outlook, by Wax Type, 2026–2033
8.5.7 Saudi Arabia FDM Candle Market Outlook, by Price Tier, 2026–2033
8.5.8 Saudi Arabia FDM Candle Market Outlook, by Retail Format, 2026–2033
8.5.9 Egypt FDM Candle Market Outlook, by Product Type, 2026–2033
8.5.10 Egypt FDM Candle Market Outlook, by Wax Type, 2026–2033
8.5.11 Egypt FDM Candle Market Outlook, by Price Tier, 2026–2033
8.5.12 Egypt FDM Candle Market Outlook, by Retail Format, 2026–2033
8.5.13 Turkey FDM Candle Market Outlook, by Product Type, 2026–2033
8.5.14 Turkey FDM Candle Market Outlook, by Wax Type, 2026–2033
8.5.15 Turkey FDM Candle Market Outlook, by Price Tier, 2026–2033
8.5.16 Turkey FDM Candle Market Outlook, by Retail Format, 2026–2033
8.5.17 South Africa FDM Candle Market Outlook, by Product Type, 2026–2033
8.5.18 South Africa FDM Candle Market Outlook, by Wax Type, 2026–2033
8.5.19 South Africa FDM Candle Market Outlook, by Price Tier, 2026–2033
8.5.20 South Africa FDM Candle Market Outlook, by Retail Format, 2026–2033
9. Competitive Landscape
9.1 Industry Leaders
9.2 Company Profiles
9.2.1 Newell Brands Inc.
9.2.2 S. C. Johnson & Son, Inc.
9.2.3 Reckitt Benckiser Group plc
9.2.4 The Procter & Gamble Company
9.2.5 Candle-lite Company
9.2.6 MVP Group International, Inc.
9.2.7 Korona Candles S.A.
9.2.8 Bolsius International B.V.
9.2.9 Gies Kerzen GmbH
9.2.10 Bispol Sp. z o.o.
9.2.11 Empire Candle Co., LLC
9.2.12 Hanna's Candle Company
9.2.13 The A. I. Root Company
9.2.14 Luminex Home Décor & Fragrance Holdings Corp.
10. Appendix
10.1 Research Methodology
10.2 Report Assumptions
10.3 Acronyms and Abbreviations
| By Product Type | Jar and container candles, Votive and tealight candles, Pillar candles, Wax melts and warmers, Taper candles, Other formats |
| By Wax Type | Paraffin wax, Soy and vegetable wax, Blended wax, Palm wax, Beeswax |
| By Price Tier | Opening price, Mid-tier, Upper-mass |
| By Retail Format | Mass merchandise and supercenters, Supermarkets and grocery stores, Value and dollar stores, Warehouse clubs, Drug stores and pharmacies |
| By Region | North America, Europe, Asia Pacific, Latin America, Middle East & Africa |
Our Research Methodology
Considering the volatility of business today, traditional approaches to strategizing a game plan can be unfruitful if not detrimental. True ambiguity is no way to determine a forecast. A myriad of predetermined factors must be accounted for such as the degree of risk involved, the magnitude of circumstances, as well as conditions or consequences that are not known or unpredictable. To circumvent binary views that cast uncertainty, the application of market research intelligence to strategically posture, move, and enable actionable outcomes is necessary.
View Methodology
Quality Assured
Rigorous Validation Process

Confidentiality Assured
End-to-end Data Security

Custom Research Services
Tailored To Your Objectives
FAQs
The global FDM Candle market is valued at US$ 6.24 billion in 2026, and is projected to reach US$ 8.78 billion by 2033.
Jar and container candles lead with 42.0% share in 2026, while wax melts and warmers grow fastest at a 6.4% CAGR through 2033.
North America holds the largest share at 41.0% in 2026, supported by its dense mass retail network and year-round candle assortments in grocery stores.
Soy and vegetable wax grows fastest at a 7.1% CAGR through 2033, as mass shoppers respond to plant-based content claims printed on pack.
The market is moderately fragmented, with branded consumer goods companies competing beside contract manufacturers that supply retailer private-label candle ranges across mass formats.
Related Reports
Bathroom Renovation Market Size, Share, Insights, Competitive Landscape, and Forecast 2026 to 2033
The global bathroom renovation market is valued at US$433.43 billion in 2026, reaching US$574.21 billion by 2033, growing at a 4.1% CAGR
Baby Wipes Market Size, Share, Insights, Competitive Landscape, and Forecast 2026 to 2033
The global baby wipes market is valued at US$6.64 billion in 2026, reaching US$11.29 billion by 2033, growing at a 7.9% CAGR
Baby Safety Products Market Size, Share, Insights, Competitive Landscape, and Forecast 2026 to 2033
Explore the baby safety products market outlook for 2026–2033, covering car seats, monitors, age groups, sales channels, regions, and key companies.
Aloe Vera Gel Market Size, Share, Insights, Competitive Landscape, and Forecast 2026 to 2033
Explore the aloe vera gel market outlook for 2026–2033, including organic grades, application trends, regional insights, and competitive analysis.
Food Waste Disposers Market Size, Share, Insights, Competitive Landscape, and Forecast 2026 to 2033
The global food waste disposers market is valued at US$3.2 billion in 2026, reaching US$5.1 billion by 2033, growing at a 6.9% CAGR
Baby Car Seat Market Size, Share, Insights, Competitive Landscape, and Forecast 2026 to 2033
The baby car seat market is forecast to grow from US$ 6.12 billion in 2026 to US$ 10.09 billion by 2033 at a 7.4% CAGR.