



Immunotherapy Market
Immunotherapy Market Size, Share, Insights, Competitive Landscape, and Forecast 2026 to 2033
Immunotherapy Market Size and Trend Analysis
What Is Driving Immunotherapy Market Growth Through 2033?
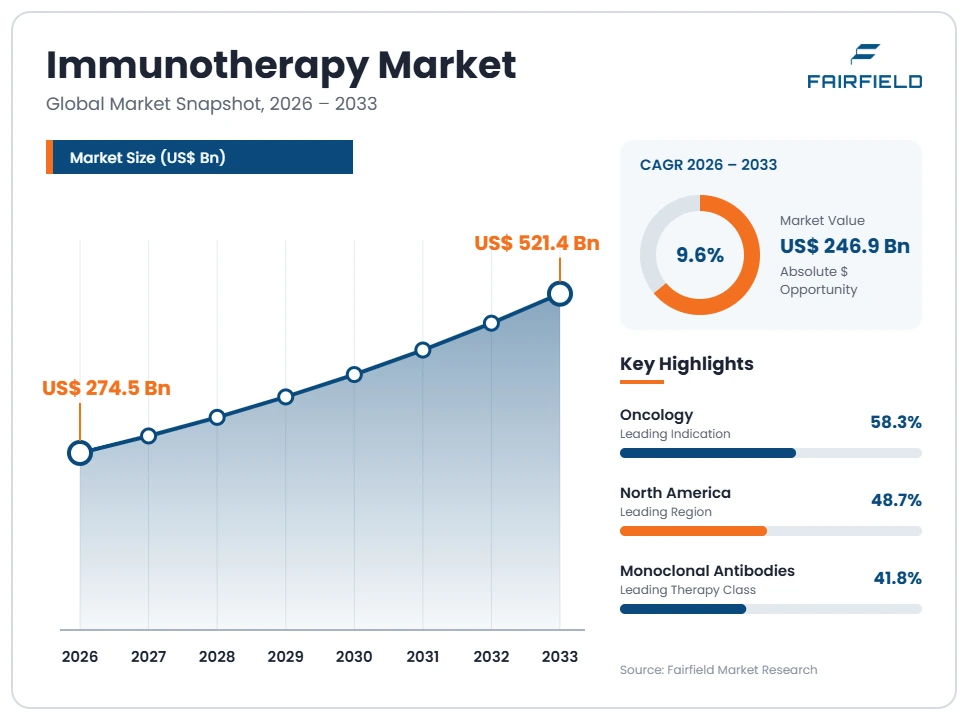
The global Immunotherapy market size is expected to be valued at US$ 274.5 billion in 2026 and projected to reach US$ 521.4 billion by 2033, growing at a CAGR of 9.6% between 2026 and 2033. The market expanded at a historical CAGR of 8.1% between 2020 and 2025, and the forecast period adds an absolute dollar opportunity of US$ 246.9 billion. Growth rests on three practical factors. Oncology case volumes keep rising as populations age. Biologics manufacturing capacity has widened, which steadies supply of antibody and cell-based products. Payers in developed markets have built reimbursement pathways that make high-cost biologics routinely accessible inside hospital systems.
Key Report Takeaways
- By Therapy Class: Monoclonal antibodies led with 41.8% share in 2026, while cell therapies are projected to expand at a 16.4% CAGR through 2033, driven by wider specialist centre accreditation for autologous product handling.
- By Indication: Oncology led with 58.3% share in 2026, while infectious disease applications are projected to expand at a 12.1% CAGR through 2033, driven by renewed public funding for antibody-based preparedness stockpiles.
- By Distribution Channel and End User: Hospital pharmacies led with 52.6% share in 2026, while specialty pharmacies are projected to grow at an 11.4% CAGR through 2033, driven by the shift of infusion volume into ambulatory and outpatient settings.
- By Region: North America led with 48.7% share in 2026, while Asia Pacific is projected to expand at a 13.2% CAGR through 2033; Europe, Latin America and Middle East & Africa add steady volume as national procurement rules widen biologic coverage.
Global Immunotherapy Market Trends and Insights
Market Growth Drivers
Rising Oncology Case Volumes Lift Immunotherapy Demand
Rising cancer incidence among ageing populations is the strongest single pull on immunotherapy demand. Treatment protocols in large oncology centres now position immune-directed agents alongside established surgical and systemic options. That placement moves a growing share of oncology drug spending toward monoclonal antibodies, checkpoint inhibitors and adoptive cell products. Hospital formularies have widened biologics budgets to match, and infusion capacity planning now assumes sustained biologic throughput.
A deeper diagnostic base sits underneath this pattern. Wider use of biomarker testing and molecular pathology lets care teams identify which patients carry the targets these agents address. National cancer registries across North America, Europe and Japan have improved case capture, which supports earlier detection and longer treatment courses. Manufacturers have answered by widening indication coverage across tumour types and by building regional commercial teams. The outcome is a broader and more predictable demand base across every therapy class.
Expanded Biologics Manufacturing Capacity Steadies Global Supply
Added biologics manufacturing capacity has removed a long-standing ceiling on immunotherapy revenue. Large-molecule drug substance plants commissioned over the past decade now run at commercial scale across the United States, Ireland, Singapore and China. Reliable supply lets commercial teams launch in more countries at once instead of staging entry over several years. It also shortens the gap between regulatory clearance and first commercial shipment, which pulls revenue forward.
Contract development and manufacturing organisations carry much of this capacity. Their single-use bioreactor suites let sponsors add volume without building owned plants, which lowers the capital hurdle for mid-sized developers. Cell therapy has followed a parallel path, with dedicated viral vector and cell processing facilities built close to treatment centres. Together these investments turn immunotherapy from a supply-constrained category into one where commercial reach sets the pace of growth.
Market Restraints
High Treatment Costs Restrict Payer and Patient Access
Treatment cost remains the clearest brake on immunotherapy volume growth. Course prices for antibody and cell-based products sit far above small-molecule alternatives, which places them outside routine budgets in many health systems. Payers respond with prior authorisation rules, restricted prescriber lists and step requirements that slow uptake. In countries without broad insurance coverage, out-of-pocket exposure keeps eligible patient numbers well below clinical demand.
Health technology assessment bodies across Europe and parts of Asia Pacific now apply formal cost-effectiveness thresholds before granting national reimbursement. Negotiations can run for extended periods after regulatory clearance, during which commercial volume stays limited. Manufacturers have replied with managed entry agreements, outcome-linked contracts and tiered pricing for middle-income markets. These mechanisms widen access but compress realised revenue per patient. The practical effect is slower conversion of approved indications into billed treatment volume across much of the world.
Manufacturing Complexity and Cold Chain Needs Constrain Scale
Production complexity limits how quickly supply can answer demand, particularly for cell-based products. Autologous therapies require patient-specific collection, processing and return within tight handling windows, which caps throughput per facility. Batch cycles are long, release testing is extensive and any deviation removes a full batch from supply. These constraints keep unit costs high and make rapid geographic expansion difficult for the newest therapy classes.
Distribution adds a second layer of difficulty. Antibody and cell products need validated cold chain handling from plant to infusion suite, with continuous temperature monitoring and qualified couriers. Many hospitals outside major metropolitan centres lack the cryogenic storage and trained pharmacy staff that these products require. Until more treatment sites qualify, administration stays concentrated in a limited network of centres, which holds back volume growth in secondary cities and rural regions.
Market Opportunities
Emerging Market Access Programmes Open New Revenue Pools
Middle-income countries represent the largest untapped revenue pool in immunotherapy. Public insurance schemes in China, India, Brazil and Southeast Asia have steadily widened coverage for serious disease, and oncology biologics now appear on several national reimbursement lists. Patient numbers in these markets are large, and even modest penetration adds meaningful volume. Manufacturers that price for local affordability can build durable positions before competitor entry.
Several practical routes support this expansion. Tiered pricing and volume-based national tenders let sponsors trade margin for scale. Local fill-finish partnerships reduce import duties and shorten supply routes. Patient assistance programmes run with hospital networks help bridge affordability gaps where coverage stays partial. Regional regulatory convergence has also reduced duplicate dossier work across Asia Pacific and Latin America. Together these steps turn markets once treated as long-term prospects into near-term contributors to global immunotherapy revenue.
Biosimilars and Next-Generation Formats Create New Commercial Space
Patent expiry across the first wave of therapeutic antibodies creates commercial space for biosimilar developers and for reformulated products. Lower-priced biosimilar versions widen the treated population in cost-sensitive systems, which grows total category volume rather than simply shifting it. Originators respond with subcutaneous formulations, fixed-dose combinations and extended-interval dosing that reduce chair time and suit outpatient delivery models.
Newer structural formats carry the second part of this opportunity. Bispecific antibodies, antibody-drug conjugates and allogeneic cell platforms are moving from development pipelines into commercial portfolios across major developers. Off-the-shelf allogeneic approaches in particular address the throughput limits of patient-specific manufacturing. Companies with established biologics capacity can add these formats using existing plants and commercial channels. The combined effect broadens the product mix, extends the life of established franchises and supports pricing flexibility across the forecast period.
Segment Analysis
- Which Therapy Class Holds the Largest Market Share?
Monoclonal antibodies hold the largest therapy class position, with 41.8% of global immunotherapy revenue in 2026. Scale explains the lead. Antibody products have the longest commercial history, the widest indication coverage and the most mature manufacturing base, which keeps supply steady and unit economics workable across many markets. Checkpoint inhibitors follow at 24.6%, concentrated in oncology prescribing within tertiary centres. Growth leadership sits elsewhere. Cell therapies are set to expand at a 16.4% CAGR between 2026 and 2033, the fastest rate in the category, as more treatment centres gain accreditation to handle autologous products and as allogeneic platforms reduce per-patient processing load. Cytokines and therapeutic vaccines hold smaller shares at 9.4% and 6.7%. For strategy teams, the split is clear: antibodies fund current earnings, while cell platforms determine portfolio position after 2030.
- Oncology Anchors Revenue While Infectious Disease Programmes Accelerate
Oncology is the anchor indication, accounting for 58.3% of immunotherapy revenue in 2026. Tumour treatment protocols across developed health systems place immune-directed agents in standard care pathways, and the breadth of approved tumour types keeps prescribing volume high. Autoimmune and inflammatory disorders follow at 27.4%, supported by long treatment durations in rheumatology, dermatology and gastroenterology that produce repeat revenue. Growth leadership belongs to infectious disease applications, projected to expand at a 12.1% CAGR through 2033 from a 8.9% base share. Public health agencies have renewed funding for antibody-based preparedness capacity after recent outbreak cycles, and several governments now hold standing supply agreements. That procurement pattern gives developers a buyer with predictable budgets. For the wider market, it means revenue becomes less dependent on oncology prescribing cycles alone.
- Hospital Pharmacies Dominate While Specialty Channels Scale Faster
Hospital pharmacies control distribution, handling 52.6% of immunotherapy product flow in 2026. The reason is operational. Most immunotherapy products need supervised administration, cold chain custody and on-site clinical monitoring, all of which sit naturally inside hospital pharmacy systems. Specialty pharmacies hold 28.1% and carry the fastest growth, at an 11.4% CAGR through 2033. Their rise follows the movement of infusion volume into ambulatory settings, where payers in North America and Europe reimburse outpatient administration at lower facility cost. Specialty operators have invested in cryogenic storage, nurse networks and benefit coordination that hospitals struggle to match on cost. Retail and online pharmacies remain limited at 11.7% and 7.6%, serving mainly subcutaneous and self-administered formats. The channel shift gives manufacturers a lower-cost route to the same patient base.
- Hospitals Carry Volume as Infusion Centres Take Share
Hospitals and clinics remain the primary end user, with 46.9% of immunotherapy administration in 2026. Concentration follows capability: hospitals hold the pharmacy infrastructure, emergency support and trained staff that supervised biologic administration requires. Specialty cancer centres account for 24.3%, handling the most complex cell therapy cases under formal accreditation. Ambulatory care and infusion centres are the growth leader, set to expand at a 12.6% CAGR through 2033 from an 18.5% base. Payers favour them because site-of-care costs run materially lower than hospital outpatient departments, and patients favour shorter visits closer to home. Research institutes and other users hold 10.3%. The migration matters commercially because it changes the buying unit. Manufacturers increasingly negotiate with infusion network operators rather than individual hospital formularies, which concentrates purchasing power.
Geography Analysis
- Which Region Is Leading the Immunotherapy Market?
North America leads the immunotherapy market with 48.7% share in 2026. The United States supplies most of that volume, with Canada adding a smaller but stable contribution. Three structural factors explain the position. Private and public insurance coverage absorbs high per-course costs that would be unaffordable elsewhere, which keeps treated patient numbers high. The country holds the densest network of accredited cell therapy centres and hospital pharmacies equipped for cryogenic handling. Clinical research activity concentrates here, so new indications reach commercial use early. The FDA operates established review pathways for biologics and cell-based products, giving developers predictable timelines. Large biologics manufacturing sites across the United States and Puerto Rico keep domestic supply secure. Regional growth is projected at an 8.4% CAGR through 2033, slower than the global average as the base matures.
- Europe Holds Steady Share on Health Technology Assessment Discipline
Europe holds 24.1% share in 2026, with Germany, France, the United Kingdom, Italy and Spain generating most regional revenue. National health systems provide broad population coverage, which supports consistent treatment volume once reimbursement is agreed. The EMA runs a centralised authorisation route that gives a single clearance across member states, reducing duplicate regulatory work. Formal health technology assessment bodies then set price and access terms country by country, which delays launch revenue but produces durable volume afterwards. Biologics manufacturing capacity in Ireland, Switzerland, Germany and Denmark anchors regional supply and export flow. Hospital networks in Western Europe have added accredited cell therapy sites, while Central and Eastern European access remains narrower. Regional growth is projected at an 8.9% CAGR through 2033, supported by biosimilar uptake that widens the treated population.
- Which Region Is Growing Fastest in the Immunotherapy Market?
Asia Pacific is growing fastest, at a 13.2% CAGR between 2026 and 2033 from an 18.6% share in 2026. China drives most of the expansion, with Japan, South Korea, India and Australia adding significant volume. Several forces combine. China has widened its national reimbursement list to include oncology biologics, which converts a very large patient population into billable demand. Domestic developers have built substantial antibody and cell therapy manufacturing capacity, lowering local prices and widening access. Japan and South Korea contribute through established biologics industries and ageing populations with high cancer incidence. India adds volume through biosimilar production and expanding private hospital networks. Regulatory agencies across the region have shortened review timelines and accepted more foreign clinical data. Rising hospital investment in cryogenic infrastructure supports continued uptake.
- Latin America Builds Capacity Through Public Procurement Reform
Latin America holds 5.2% share in 2026 and is projected to grow at a 10.4% CAGR through 2033. Brazil and Mexico generate most regional revenue, with Argentina, Colombia and Chile contributing smaller volumes. Public health systems dominate purchasing, and centralised tender processes have increasingly included oncology biologics on national lists. Those tenders trade price concessions for guaranteed volume, which suits manufacturers seeking scale. Brazil has supported local fill-finish and technology transfer arrangements that reduce import costs and shorten supply routes. Private hospital networks in major cities have added infusion capacity and specialty pharmacy services. Access outside large urban centres stays limited by cold chain gaps and specialist shortages. Biosimilar entry has widened affordability in antibody categories, pulling more patients into treatment across public systems.
- Middle East & Africa Expands Access Through Specialty Centres
Middle East & Africa accounts for 3.4% share in 2026, with growth projected at a 9.8% CAGR through 2033. Saudi Arabia, the United Arab Emirates, Israel, Turkey and South Africa generate most regional activity. Gulf states fund advanced oncology centres directly through national health budgets, and several have built accredited facilities capable of handling cell-based products. Medical tourism into these centres adds further volume. Israel and Turkey contribute established pharmaceutical manufacturing and specialist hospital capacity. Across much of Sub-Saharan Africa, access stays limited by constrained health budgets, thin cold chain networks and a shortage of oncology specialists. South Africa operates the most developed private treatment infrastructure on the continent. Regional regulatory harmonisation efforts and donor-supported procurement programmes are slowly widening availability of antibody-based products.
Competitive Landscape
The immunotherapy market is moderately concentrated. A group of large biopharmaceutical companies holds the majority of revenue through established antibody and checkpoint inhibitor franchises, while a wider set of mid-sized developers and specialist cell therapy firms competes in defined niches. Concentration is highest in oncology antibodies, where manufacturing scale and global commercial reach create meaningful barriers. Cell therapy remains more open, with newer entrants holding real positions because the format rewards process expertise over plant size. Consolidation continues as large companies acquire platform developers to secure pipeline depth, which signals a market shifting from single-product competition toward portfolio competition.
Competition centres on manufacturing capability, delivery format and commercial access rather than price alone. Companies invest in subcutaneous and fixed-dose presentations that reduce administration time and suit outpatient channels. Process development work targets shorter batch cycles and lower cost of goods, which matters most in cell therapy where throughput caps revenue. Regulatory compliance capacity is itself a competitive asset, since multi-region filings and post-marketing commitments demand sustained infrastructure. Emerging developers in China, South Korea and India compete increasingly on manufacturing cost and speed, and their presence is reshaping tender outcomes in price-sensitive markets.
Strategic activity follows these pressures. Acquisitions of platform companies give buyers access to bispecific, conjugate and allogeneic capabilities without internal build time. Partnerships with contract manufacturers add flexible capacity while avoiding fixed capital commitments. Regional joint ventures secure market entry where local production carries procurement advantages. Licensing arrangements let originators extend geographic reach into markets their own commercial teams do not cover. The common direction is clear: companies are buying capability breadth and manufacturing flexibility, positioning for a market where format variety and access economics decide competitive standing.
Industry Leaders
- Merck & Co., Inc.
- Bristol Myers Squibb Company
- F. Hoffmann-La Roche Ltd
- AstraZeneca plc
- Novartis AG
- Johnson & Johnson
Companies Covered in the Report
- Merck & Co., Inc.
- Bristol Myers Squibb Company
- F. Hoffmann-La Roche Ltd
- AstraZeneca plc
- Novartis AG
- Johnson & Johnson
- Pfizer Inc.
- Amgen Inc.
- Gilead Sciences, Inc.
- Sanofi S.A.
- GSK plc
- AbbVie Inc.
- Regeneron Pharmaceuticals, Inc.
- Takeda Pharmaceutical Company Limited
- BeiGene, Ltd.
Immunotherapy Market Report Scope
| Metric | Value |
| Study Period | 2020–2033 |
| Market Size 2026 | US$ 274.5 Billion |
| Market Size 2033 | US$ 521.4 Billion |
| CAGR 2026–2033 | 9.6% |
| Absolute Dollar Opportunity | US$ 246.9 Billion |
| Largest Market | North America (48.7% share in 2026) |
| Fastest-Growing Market | Asia Pacific (13.2% CAGR 2026–2033) |
| Market Concentration | Moderately Concentrated |
| Major Players | Merck & Co., Inc., Bristol Myers Squibb Company, F. Hoffmann-La Roche Ltd, AstraZeneca plc, Novartis AG |
Immunotherapy Market Segmentation
- Executive Summary
- Global Immunotherapy Market Snapshot
- Future Projections, 2026–2033
- Key Industry Highlights
- Regional Snapshot
- Market Overview
- Market Definition and Report Scope
- Historical Market Trends
- Market Dynamics
- Drivers
- Rising Oncology Case Volumes Lift Immunotherapy Demand
- Expanded Biologics Manufacturing Capacity Steadies Global Supply
- Restraints
- High Treatment Costs Restrict Payer and Patient Access
- Manufacturing Complexity and Cold Chain Needs Constrain Scale
- Market Opportunities
- Emerging Market Access Programmes Open New Revenue Pools
- Biosimilars and Next-Generation Formats Create New Commercial Space
- Drivers
- Global Immunotherapy Market Outlook, 2026–2033
- Global Immunotherapy Market Outlook, by Therapy Class, Value (US$ Billion), 2026–2033
- Monoclonal Antibodies
- Checkpoint Inhibitors
- Cell Therapies
- Cytokines
- Therapeutic Vaccines
- Immunomodulators and Others
- Global Immunotherapy Market Outlook, by Indication, Value (US$ Billion), 2026–2033
- Oncology
- Autoimmune and Inflammatory Disorders
- Infectious Diseases
- Other Indications
- Global Immunotherapy Market Outlook, by Distribution Channel, Value (US$ Billion), 2026–2033
- Hospital Pharmacies
- Specialty Pharmacies
- Retail Pharmacies
- Online Pharmacies
- Global Immunotherapy Market Outlook, by End User, Value (US$ Billion), 2026–2033
- Hospitals and Clinics
- Specialty Cancer Centres
- Ambulatory Care and Infusion Centres
- Research Institutes and Others
- Global Immunotherapy Market Outlook, by Region, Value (US$ Billion), 2026–2033
- North America
- Europe
- Asia Pacific
- Latin America
- Middle East & Africa
- Global Immunotherapy Market Outlook, by Therapy Class, Value (US$ Billion), 2026–2033
- North America Immunotherapy Market Outlook, 2026–2033
- North America Immunotherapy Market Outlook, by Therapy Class, Value (US$ Billion), 2026–2033
- Monoclonal Antibodies
- Checkpoint Inhibitors
- Cell Therapies
- Cytokines
- Therapeutic Vaccines
- Immunomodulators and Others
- North America Immunotherapy Market Outlook, by Indication, Value (US$ Billion), 2026–2033
- Oncology
- Autoimmune and Inflammatory Disorders
- Infectious Diseases
- Other Indications
- North America Immunotherapy Market Outlook, by Distribution Channel, Value (US$ Billion), 2026–2033
- Hospital Pharmacies
- Specialty Pharmacies
- Retail Pharmacies
- Online Pharmacies
- North America Immunotherapy Market Outlook, by End User, Value (US$ Billion), 2026–2033
- Hospitals and Clinics
- Specialty Cancer Centres
- Ambulatory Care and Infusion Centres
- Research Institutes and Others
- North America Immunotherapy Market Outlook, by Country, Value (US$ Billion), 2026–2033
- United States Immunotherapy Market Outlook, by Therapy Class, 2026–2033
- United States Immunotherapy Market Outlook, by Indication, 2026–2033
- United States Immunotherapy Market Outlook, by Distribution Channel, 2026–2033
- United States Immunotherapy Market Outlook, by End User, 2026–2033
- Canada Immunotherapy Market Outlook, by Therapy Class, 2026–2033
- Canada Immunotherapy Market Outlook, by Indication, 2026–2033
- Canada Immunotherapy Market Outlook, by Distribution Channel, 2026–2033
- Canada Immunotherapy Market Outlook, by End User, 2026–2033
- North America Immunotherapy Market Outlook, by Therapy Class, Value (US$ Billion), 2026–2033
- Europe Immunotherapy Market Outlook, 2026–2033
- Europe Immunotherapy Market Outlook, by Therapy Class, Value (US$ Billion), 2026–2033
- Monoclonal Antibodies
- Checkpoint Inhibitors
- Cell Therapies
- Cytokines
- Therapeutic Vaccines
- Immunomodulators and Others
- Europe Immunotherapy Market Outlook, by Indication, Value (US$ Billion), 2026–2033
- Oncology
- Autoimmune and Inflammatory Disorders
- Infectious Diseases
- Other Indications
- Europe Immunotherapy Market Outlook, by Distribution Channel, Value (US$ Billion), 2026–2033
- Hospital Pharmacies
- Specialty Pharmacies
- Retail Pharmacies
- Online Pharmacies
- Europe Immunotherapy Market Outlook, by End User, Value (US$ Billion), 2026–2033
- Hospitals and Clinics
- Specialty Cancer Centres
- Ambulatory Care and Infusion Centres
- Research Institutes and Others
- Europe Immunotherapy Market Outlook, by Country, Value (US$ Billion), 2026–2033
- Germany Immunotherapy Market Outlook, by Therapy Class, 2026–2033
- Germany Immunotherapy Market Outlook, by Indication, 2026–2033
- Germany Immunotherapy Market Outlook, by Distribution Channel, 2026–2033
- Germany Immunotherapy Market Outlook, by End User, 2026–2033
- France Immunotherapy Market Outlook, by Therapy Class, 2026–2033
- France Immunotherapy Market Outlook, by Indication, 2026–2033
- France Immunotherapy Market Outlook, by Distribution Channel, 2026–2033
- France Immunotherapy Market Outlook, by End User, 2026–2033
- United Kingdom Immunotherapy Market Outlook, by Therapy Class, 2026–2033
- United Kingdom Immunotherapy Market Outlook, by Indication, 2026–2033
- United Kingdom Immunotherapy Market Outlook, by Distribution Channel, 2026–2033
- United Kingdom Immunotherapy Market Outlook, by End User, 2026–2033
- Italy Immunotherapy Market Outlook, by Therapy Class, 2026–2033
- Italy Immunotherapy Market Outlook, by Indication, 2026–2033
- Italy Immunotherapy Market Outlook, by Distribution Channel, 2026–2033
- Italy Immunotherapy Market Outlook, by End User, 2026–2033
- Spain Immunotherapy Market Outlook, by Therapy Class, 2026–2033
- Spain Immunotherapy Market Outlook, by Indication, 2026–2033
- Spain Immunotherapy Market Outlook, by Distribution Channel, 2026–2033
- Spain Immunotherapy Market Outlook, by End User, 2026–2033
- Ireland Immunotherapy Market Outlook, by Therapy Class, 2026–2033
- Ireland Immunotherapy Market Outlook, by Indication, 2026–2033
- Ireland Immunotherapy Market Outlook, by Distribution Channel, 2026–2033
- Ireland Immunotherapy Market Outlook, by End User, 2026–2033
- Switzerland Immunotherapy Market Outlook, by Therapy Class, 2026–2033
- Switzerland Immunotherapy Market Outlook, by Indication, 2026–2033
- Switzerland Immunotherapy Market Outlook, by Distribution Channel, 2026–2033
- Switzerland Immunotherapy Market Outlook, by End User, 2026–2033
- Denmark Immunotherapy Market Outlook, by Therapy Class, 2026–2033
- Denmark Immunotherapy Market Outlook, by Indication, 2026–2033
- Denmark Immunotherapy Market Outlook, by Distribution Channel, 2026–2033
- Denmark Immunotherapy Market Outlook, by End User, 2026–2033
- Europe Immunotherapy Market Outlook, by Therapy Class, Value (US$ Billion), 2026–2033
- Asia Pacific Immunotherapy Market Outlook, 2026–2033
- Asia Pacific Immunotherapy Market Outlook, by Therapy Class, Value (US$ Billion), 2026–2033
- Monoclonal Antibodies
- Checkpoint Inhibitors
- Cell Therapies
- Cytokines
- Therapeutic Vaccines
- Immunomodulators and Others
- Asia Pacific Immunotherapy Market Outlook, by Indication, Value (US$ Billion), 2026–2033
- Oncology
- Autoimmune and Inflammatory Disorders
- Infectious Diseases
- Other Indications
- Asia Pacific Immunotherapy Market Outlook, by Distribution Channel, Value (US$ Billion), 2026–2033
- Hospital Pharmacies
- Specialty Pharmacies
- Retail Pharmacies
- Online Pharmacies
- Asia Pacific Immunotherapy Market Outlook, by End User, Value (US$ Billion), 2026–2033
- Hospitals and Clinics
- Specialty Cancer Centres
- Ambulatory Care and Infusion Centres
- Research Institutes and Others
- Asia Pacific Immunotherapy Market Outlook, by Country, Value (US$ Billion), 2026–2033
- China Immunotherapy Market Outlook, by Therapy Class, 2026–2033
- China Immunotherapy Market Outlook, by Indication, 2026–2033
- China Immunotherapy Market Outlook, by Distribution Channel, 2026–2033
- China Immunotherapy Market Outlook, by End User, 2026–2033
- Japan Immunotherapy Market Outlook, by Therapy Class, 2026–2033
- Japan Immunotherapy Market Outlook, by Indication, 2026–2033
- Japan Immunotherapy Market Outlook, by Distribution Channel, 2026–2033
- Japan Immunotherapy Market Outlook, by End User, 2026–2033
- South Korea Immunotherapy Market Outlook, by Therapy Class, 2026–2033
- South Korea Immunotherapy Market Outlook, by Indication, 2026–2033
- South Korea Immunotherapy Market Outlook, by Distribution Channel, 2026–2033
- South Korea Immunotherapy Market Outlook, by End User, 2026–2033
- India Immunotherapy Market Outlook, by Therapy Class, 2026–2033
- India Immunotherapy Market Outlook, by Indication, 2026–2033
- India Immunotherapy Market Outlook, by Distribution Channel, 2026–2033
- India Immunotherapy Market Outlook, by End User, 2026–2033
- Australia Immunotherapy Market Outlook, by Therapy Class, 2026–2033
- Australia Immunotherapy Market Outlook, by Indication, 2026–2033
- Australia Immunotherapy Market Outlook, by Distribution Channel, 2026–2033
- Australia Immunotherapy Market Outlook, by End User, 2026–2033
- Asia Pacific Immunotherapy Market Outlook, by Therapy Class, Value (US$ Billion), 2026–2033
- Latin America Immunotherapy Market Outlook, 2026–2033
- Latin America Immunotherapy Market Outlook, by Therapy Class, Value (US$ Billion), 2026–2033
- Monoclonal Antibodies
- Checkpoint Inhibitors
- Cell Therapies
- Cytokines
- Therapeutic Vaccines
- Immunomodulators and Others
- Latin America Immunotherapy Market Outlook, by Indication, Value (US$ Billion), 2026–2033
- Oncology
- Autoimmune and Inflammatory Disorders
- Infectious Diseases
- Other Indications
- Latin America Immunotherapy Market Outlook, by Distribution Channel, Value (US$ Billion), 2026–2033
- Hospital Pharmacies
- Specialty Pharmacies
- Retail Pharmacies
- Online Pharmacies
- Latin America Immunotherapy Market Outlook, by End User, Value (US$ Billion), 2026–2033
- Hospitals and Clinics
- Specialty Cancer Centres
- Ambulatory Care and Infusion Centres
- Research Institutes and Others
- Latin America Immunotherapy Market Outlook, by Country, Value (US$ Billion), 2026–2033
- Brazil Immunotherapy Market Outlook, by Therapy Class, 2026–2033
- Brazil Immunotherapy Market Outlook, by Indication, 2026–2033
- Brazil Immunotherapy Market Outlook, by Distribution Channel, 2026–2033
- Brazil Immunotherapy Market Outlook, by End User, 2026–2033
- Mexico Immunotherapy Market Outlook, by Therapy Class, 2026–2033
- Mexico Immunotherapy Market Outlook, by Indication, 2026–2033
- Mexico Immunotherapy Market Outlook, by Distribution Channel, 2026–2033
- Mexico Immunotherapy Market Outlook, by End User, 2026–2033
- Argentina Immunotherapy Market Outlook, by Therapy Class, 2026–2033
- Argentina Immunotherapy Market Outlook, by Indication, 2026–2033
- Argentina Immunotherapy Market Outlook, by Distribution Channel, 2026–2033
- Argentina Immunotherapy Market Outlook, by End User, 2026–2033
- Colombia Immunotherapy Market Outlook, by Therapy Class, 2026–2033
- Colombia Immunotherapy Market Outlook, by Indication, 2026–2033
- Colombia Immunotherapy Market Outlook, by Distribution Channel, 2026–2033
- Colombia Immunotherapy Market Outlook, by End User, 2026–2033
- Chile Immunotherapy Market Outlook, by Therapy Class, 2026–2033
- Chile Immunotherapy Market Outlook, by Indication, 2026–2033
- Chile Immunotherapy Market Outlook, by Distribution Channel, 2026–2033
- Chile Immunotherapy Market Outlook, by End User, 2026–2033
- Latin America Immunotherapy Market Outlook, by Therapy Class, Value (US$ Billion), 2026–2033
- Middle East & Africa Immunotherapy Market Outlook, 2026–2033
- Middle East & Africa Immunotherapy Market Outlook, by Therapy Class, Value (US$ Billion), 2026–2033
- Monoclonal Antibodies
- Checkpoint Inhibitors
- Cell Therapies
- Cytokines
- Therapeutic Vaccines
- Immunomodulators and Others
- Middle East & Africa Immunotherapy Market Outlook, by Indication, Value (US$ Billion), 2026–2033
- Oncology
- Autoimmune and Inflammatory Disorders
- Infectious Diseases
- Other Indications
- Middle East & Africa Immunotherapy Market Outlook, by Distribution Channel, Value (US$ Billion), 2026–2033
- Hospital Pharmacies
- Specialty Pharmacies
- Retail Pharmacies
- Online Pharmacies
- Middle East & Africa Immunotherapy Market Outlook, by End User, Value (US$ Billion), 2026–2033
- Hospitals and Clinics
- Specialty Cancer Centres
- Ambulatory Care and Infusion Centres
- Research Institutes and Others
- Middle East & Africa Immunotherapy Market Outlook, by Country and Subregion, Value (US$ Billion), 2026–2033
- Saudi Arabia Immunotherapy Market Outlook, by Therapy Class, 2026–2033
- Saudi Arabia Immunotherapy Market Outlook, by Indication, 2026–2033
- Saudi Arabia Immunotherapy Market Outlook, by Distribution Channel, 2026–2033
- Saudi Arabia Immunotherapy Market Outlook, by End User, 2026–2033
- United Arab Emirates Immunotherapy Market Outlook, by Therapy Class, 2026–2033
- United Arab Emirates Immunotherapy Market Outlook, by Indication, 2026–2033
- United Arab Emirates Immunotherapy Market Outlook, by Distribution Channel, 2026–2033
- United Arab Emirates Immunotherapy Market Outlook, by End User, 2026–2033
- Israel Immunotherapy Market Outlook, by Therapy Class, 2026–2033
- Israel Immunotherapy Market Outlook, by Indication, 2026–2033
- Israel Immunotherapy Market Outlook, by Distribution Channel, 2026–2033
- Israel Immunotherapy Market Outlook, by End User, 2026–2033
- Turkey Immunotherapy Market Outlook, by Therapy Class, 2026–2033
- Turkey Immunotherapy Market Outlook, by Indication, 2026–2033
- Turkey Immunotherapy Market Outlook, by Distribution Channel, 2026–2033
- Turkey Immunotherapy Market Outlook, by End User, 2026–2033
- South Africa Immunotherapy Market Outlook, by Therapy Class, 2026–2033
- South Africa Immunotherapy Market Outlook, by Indication, 2026–2033
- South Africa Immunotherapy Market Outlook, by Distribution Channel, 2026–2033
- South Africa Immunotherapy Market Outlook, by End User, 2026–2033
- Gulf states Immunotherapy Market Outlook, by Therapy Class, 2026–2033
- Gulf states Immunotherapy Market Outlook, by Indication, 2026–2033
- Gulf states Immunotherapy Market Outlook, by Distribution Channel, 2026–2033
- Gulf states Immunotherapy Market Outlook, by End User, 2026–2033
- Middle East & Africa Immunotherapy Market Outlook, by Therapy Class, Value (US$ Billion), 2026–2033
- Competitive Landscape
- Industry Leaders
- Company Profiles
- Merck & Co., Inc.
- Bristol Myers Squibb Company
- F. Hoffmann-La Roche Ltd
- AstraZeneca plc
- Novartis AG
- Johnson & Johnson
- Pfizer Inc.
- Amgen Inc.
- Gilead Sciences, Inc.
- Sanofi S.A.
- GSK plc
- AbbVie Inc.
- Regeneron Pharmaceuticals, Inc.
- Takeda Pharmaceutical Company Limited
- BeiGene, Ltd.
- Appendix
- Research Methodology
- Report Assumptions
- Acronyms and Abbreviations
Therapy Class
- Monoclonal Antibodies
- Checkpoint Inhibitors
- Cell Therapies
- Cytokines
- Therapeutic Vaccines
- Immunomodulators and Others
Indication
- Oncology
- Autoimmune and Inflammatory Disorders
- Infectious Diseases
- Other Indications
Distribution Channel
- Hospital Pharmacies
- Specialty Pharmacies
- Retail Pharmacies
- Online Pharmacies
End User
- Hospitals and Clinics
- Specialty Cancer Centres
- Ambulatory Care and Infusion Centres
- Research Institutes and Others
Region
- North America
- Europe
- Asia Pacific
- Latin America
- Middle East & Africa
Our Research Methodology
Considering the volatility of business today, traditional approaches to strategizing a game plan can be unfruitful if not detrimental. True ambiguity is no way to determine a forecast. A myriad of predetermined factors must be accounted for such as the degree of risk involved, the magnitude of circumstances, as well as conditions or consequences that are not known or unpredictable. To circumvent binary views that cast uncertainty, the application of market research intelligence to strategically posture, move, and enable actionable outcomes is necessary.
View Methodology
Quality Assured
Rigorous Validation Process

Confidentiality Assured
End-to-end Data Security

Custom Research Services
Tailored To Your Objectives
FAQs
The global immunotherapy market is valued at US$ 274.5 billion in 2026, supported by oncology demand, wider biologics capacity and established reimbursement pathways.
The market is projected to reach US$ 521.4 billion by 2033, growing at a 9.6% CAGR and adding an absolute opportunity of US$ 246.9 billion.
Monoclonal antibodies lead by therapy class with 41.8% share in 2026, and oncology leads by indication with 58.3% share, reflecting broad treatment protocol coverage.
North America leads with 48.7% share in 2026, while Asia Pacific grows fastest at a 13.2% CAGR through 2033 on widening national reimbursement coverage.
Related Reports
Pantoprazole Sodium Market Size, Share, Insights, Competitive Landscape, and Forecast 2026 to 2033
The global pantoprazole sodium market is valued at US$2.36 billion in 2026, reaching US$3.57 billion by 2033, growing at a 6.1% CAGR
Hydroxychloroquine Market Size, Share, Insights, Competitive Landscape, and Forecast 2026 to 2033
The global hydroxychloroquine market is valued at US$1.71 billion in 2026, reaching US$2.66 billion by 2033, growing at a 6.6% CAGR
Hormone Replacement Therapy Market Size, Share, Insights, Competitive Landscape, and Forecast 2026 to 2033
The global hormone replacement therapy market is valued at US$27.3 billion in 2026, reaching US$45.6 billion by 2033, growing at a 7.6% CAGR
Healthcare Regulatory Affairs Outsourcing Market Size, Share, Insights, Competitive Landscape, and Forecast 2026 to 2033
The global healthcare regulatory affairs outsourcing market is valued at US$8.6 billion in 2026, reaching US$17.6 billion by 2033, growing at a 10.8% CAGR
Genetic Disease Therapy Market Size, Share, Insights, Competitive Landscape, and Forecast 2026 to 2033
The global genetic disease therapy market is valued at US$18.6 billion in 2026, reaching US$39.6 billion by 2033, growing at an 11.4% CAGR
Fertility Market Size, Share, Insights, Competitive Landscape, and Forecast 2026 to 2033
Explore the fertility market outlook for 2026–2033, including treatment trends, growth drivers, regional insights, and competitive developments.