



Genetic Disease Therapy Market
Genetic Disease Therapy Market Size, Share, Insights, Competitive Landscape, and Forecast 2026 to 2033
Genetic Disease Therapy Market Size and Trend Analysis
What Is Driving Genetic Disease Therapy Market Growth?
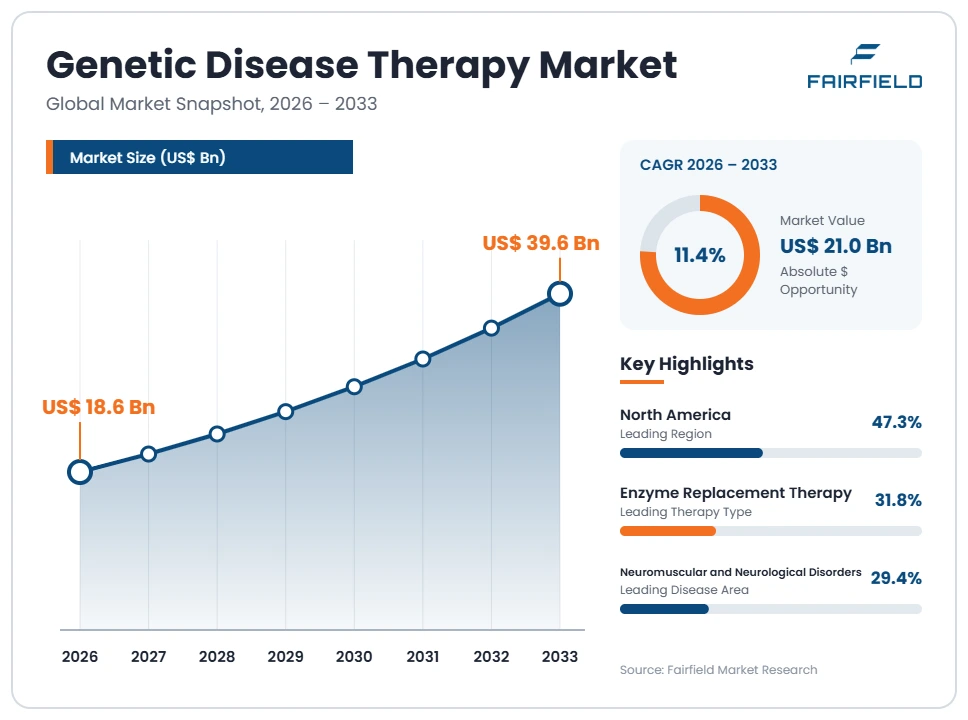
The global Genetic Disease Therapy market size is expected to be valued at US$ 18.6 billion in 2026 and projected to reach US$ 39.6 billion by 2033, growing at a CAGR of 11.4% between 2026 and 2033. Growth rests on a widening set of approved therapies for inherited disorders and on faster diagnosis through newborn and genomic screening. Orphan drug frameworks at the FDA and the EMA continue to shape development economics for small patient populations. Manufacturing capacity for viral vectors, lipid nanoparticles and cell processing is expanding, easing supply constraints. The market is shifting from a few high-cost launches toward a broader commercial base, adding an absolute dollar opportunity of US$ 21.0 billion.
Key Report Takeaways
- By Therapy Type: Enzyme replacement therapy led with 31.8% share in 2026, while gene editing therapy is projected to expand at a 19.6% CAGR through 2033, driven by broader ex vivo and in vivo editing programs entering commercial development.
- By Disease Area: Neuromuscular and neurological disorders held 29.4% share in 2026, while hematological disorders are set to grow at a 16.8% CAGR through 2033, supported by expanding transplant-capable centers able to deliver cell-based regimens.
- By Route of Administration: Intravenous delivery accounted for 46.2% share in 2026, while subcutaneous delivery is projected to rise at a 14.3% CAGR through 2033, reflecting formulation work that moves chronic dosing outside infusion suites.
- By End User: Specialty and tertiary care hospitals captured 44.8% share in 2026, while homecare settings are forecast to advance at a 15.1% CAGR through 2033, aided by nurse-administered dosing models and remote monitoring services.
- By Region: North America led with 47.3% share in 2026, ahead of Europe at 26.8%, Asia Pacific at 18.1%, Latin America at 4.6% and Middle East & Africa at 3.2%, with Asia Pacific growing fastest at a 14.7% CAGR.
Global Genetic Disease Therapy Market Trends and Insights
Market Growth Drivers
Expanding Set of Approved Therapies for Inherited Disorders
A larger set of approved therapies for inherited disorders is lifting addressable demand across the market. Treatment that was once limited to supportive care now includes gene replacement, gene editing, RNA-based and enzyme replacement options. Each approval creates a defined revenue pool tied to a known patient population, which makes forecasting more reliable for manufacturers and payers. Prescriber networks also widen, because centers that handle one genetic disorder can extend protocols to related conditions.
The underlying driver is a deeper understanding of single-gene disease biology built from large sequencing programs. Companies such as Novartis AG, Sarepta Therapeutics, Inc. and Alnylam Pharmaceuticals, Inc. run development portfolios organized around specific genetic targets rather than broad disease categories. Orphan designation routes at the FDA and the EMA give these programs a defined regulatory path. Platform reuse across several rare indications spreads fixed development cost over more products.
Earlier Diagnosis Through Newborn and Genomic Screening
Earlier diagnosis is enlarging the treated share of each genetic disease population, which directly raises therapy volumes. Many inherited disorders progress silently for years, so patients historically reached specialists late. Expanded newborn screening panels and clinical exome testing now identify carriers and affected children sooner. A larger confirmed patient pool shortens the time between approval and peak commercial uptake. It also gives manufacturers clearer volume estimates when planning batch sizes and cold-chain capacity.
Sequencing cost declines and public genomics programs sit behind this shift. National health systems in several countries have folded genomic testing into routine pediatric and prenatal pathways. Patient advocacy organizations maintain disease registries that help identify eligible families and support natural history data collection. Diagnostic companies and therapy developers increasingly build referral links so that a confirmed variant routes directly to a treating center. That connection converts diagnostic activity into commercial demand.
Market Restraints
Treatment Cost and Reimbursement Barriers Limit Patient Access
High treatment cost restricts the number of patients who actually receive approved genetic disease therapies, which caps realized market value. Therapies priced for very small populations place heavy pressure on annual payer budgets, especially where a single course consumes a large share of a regional drug fund. Coverage decisions vary widely between systems and between private plans. Families in uncovered settings face long appeals or no route at all. The result is a gap between eligible and treated populations that persists after approval.
Payers and manufacturers are testing outcomes-based agreements, annuity payments and managed access funds to spread cost over time. These mechanisms demand long-term patient tracking, which many health systems cannot yet support. Health technology assessment bodies also apply value frameworks built for common diseases, where small trial populations fit awkwardly. Until pricing and payment models settle, access will stay uneven across income levels and geographies.
Manufacturing Complexity and Limited Specialized Capacity
Complex manufacturing limits how fast supply can expand, which holds back revenue even where demand exists. Viral vector production, cell processing and lipid nanoparticle formulation all run at small scale with long cycle times. Batch failure risk is higher than for conventional biologics, and release testing adds weeks. Few contract manufacturers hold the required facilities and qualified staff, so slots are booked far ahead. Smaller developers wait in line behind larger sponsors, which delays launches.
Capacity investment is under way but takes years to qualify. Building a vector suite requires cleanrooms, single-use systems, analytical laboratories and trained operators, and regulators inspect each site before commercial release. Cell therapies add a logistics layer, since patient material travels both ways under controlled conditions. Workforce supply is a real constraint, as process development and quality roles need specialized training. These factors keep cost of goods high and limit geographic supply.
Market Opportunities
In Vivo Gene Editing Opens a New Revenue Pool
In vivo gene editing creates a revenue pool that does not depend on transplant-capable centers, which widens the commercial base. Ex vivo approaches require cell collection, laboratory modification and reinfusion, so delivery sits inside a small number of specialized sites. Dosing a patient directly removes much of that infrastructure requirement. That change makes mid-size hospitals viable treatment points and extends geographic reach into markets without advanced cell processing.
Delivery technology is the enabling trend. Lipid nanoparticles, engineered capsids and tissue-targeted formulations are being developed to reach liver, muscle, central nervous system and eye tissue. Companies including Intellia Therapeutics, Inc., Beam Therapeutics Inc. and CRISPR Therapeutics AG build programs around editing platforms that can be redirected to new targets. Platform reuse shortens preclinical timelines for each additional indication. Payers may also find repeat-use platforms easier to assess once a manufacturing process is established.
Emerging Markets Build Rare Disease Treatment Capacity
Emerging markets represent the clearest untapped demand in this market, since diagnosed patients there often have no local treatment route. Countries across Asia Pacific, Latin America and the Middle East are adding genomic testing, specialist referral centers and national rare disease policies. Each addition converts latent need into addressable demand. Regional pricing tiers and local partnerships let manufacturers enter without disturbing reference prices in higher-income systems.
Public policy is the main lever. Several governments have published rare disease frameworks that define funding pools, designated treatment centers and patient registries. Insurance schemes in parts of Asia have begun listing selected high-cost therapies, which gives manufacturers a predictable payer counterpart. Local manufacturing and fill-finish arrangements reduce import cost and shorten supply lines. Sustained access still depends on stable budgets, so companies weigh volume gains against the risk of inconsistent funding.
Segment Analysis
- Which Therapy Type Holds the Largest Market Share?
Enzyme replacement therapy holds the largest position with 31.8% share in 2026, supported by a long-established commercial base in lysosomal storage disorders. Decades of approved products, stable reimbursement codes and familiar infusion workflows keep this class central to treated volumes. RNA-based therapy follows at 24.6%, with gene replacement therapy at 18.4%, cell therapy at 13.2%, gene editing therapy at 7.5% and other classes at 4.5%.
Gene editing therapy is the growth leader at a 19.6% CAGR between 2026 and 2033, moving from early commercial status toward a wider set of indications. Expanding editing platforms, improved delivery vehicles and established orphan pathways at the FDA and the EMA underpin that trajectory. For the broader market, the mix is shifting from repeat-dose maintenance products toward one-time administration models, which changes revenue timing and forces payers to rethink budget planning.
- Neuromuscular and Neurological Disorders Anchor Treated Volumes
Neuromuscular and neurological disorders account for the largest disease area share at 29.4% in 2026, reflecting a concentration of approved products for spinal muscular atrophy and muscular dystrophies. These conditions have well-defined genetic causes, organized specialist networks and active patient registries, all of which support consistent treatment volumes. Metabolic and lysosomal storage disorders hold 25.7%, hematological disorders 18.3%, ophthalmic disorders 10.6%, immunological disorders 9.2% and other areas 6.8%.
Hematological disorders grow fastest at a 16.8% CAGR through 2033, as more centers gain the cell processing and transplant infrastructure these regimens require. Sickle cell disease and transfusion-dependent thalassemia carry large diagnosed populations relative to most rare conditions, which raises the commercial ceiling. The shift matters because it moves the market toward disease areas with higher patient counts, easing the unit-economics problem that has limited investment in very small populations.
- Intravenous Delivery Dominates While Subcutaneous Options Gain Ground
Intravenous delivery leads routes of administration with 46.2% share in 2026, because most approved enzyme replacement, gene replacement and cell-based products are given through supervised infusion. Hospital infusion suites provide the monitoring environment, cold-chain handling and trained staff these products need. Subcutaneous delivery holds 21.5%, intrathecal and intracerebroventricular routes 15.4%, intraocular and subretinal routes 9.7%, and other routes 7.2%.
Subcutaneous delivery expands fastest at a 14.3% CAGR through 2033, driven by formulation work on concentrated biologics and on RNA-based agents dosed at intervals. Shorter administration time reduces chair occupancy in infusion centers and lowers the travel burden for families living far from specialist sites. That shift supports the move of chronic maintenance dosing into community and home settings, and it changes where service revenue accrues across the care chain.
- Specialty Hospitals Hold Volume as Home-Based Care Accelerates
Specialty and tertiary care hospitals command 44.8% of end-user share in 2026, since they hold the diagnostic, pharmacy and monitoring capability that genetic disease therapies require. Gene and cell-based products also depend on qualified treatment-center status, which concentrates administration in large academic institutions. Specialized treatment centers take 26.3%, ambulatory infusion centers 14.6%, homecare settings 9.8% and other users 4.5%.
Homecare settings grow fastest at a 15.1% CAGR through 2033, supported by nurse-administered dosing programs, portable infusion equipment and remote monitoring platforms. Manufacturers fund patient support services because reliable long-term dosing protects revenue from chronic therapies. Payers back the shift where it lowers facility fees. For the market, the move spreads administration across more delivery points, which reduces capacity bottlenecks at major centers and improves reach for families outside metropolitan areas.
Geography Analysis
- Which Region Is Leading the Genetic Disease Therapy Market?
North America leads the market with 47.3% share in 2026, growing at a 10.3% CAGR through 2033. The United States supplies most of that value, with Canada adding a smaller but steady contribution. Concentration of qualified treatment centers, dense clinical trial activity and early commercial launches keep the region ahead. Commercial insurers and Medicaid programs have built coverage pathways for high-cost rare disease products, though approval terms differ by state and plan. Orphan drug incentives administered by the FDA sustain development interest in very small populations. Domestic vector and cell manufacturing capacity also sits largely in this region, which shortens supply lines for launches.
- Centralized Approval and National Pricing Shape European Demand
Europe holds 26.8% share in 2026 and advances at a 10.9% CAGR through 2033. Germany, France, the United Kingdom, Italy and Spain account for most regional demand. Centralized review by the EMA gives a single approval route across member states, while national health technology assessment bodies then decide pricing and reimbursement separately. That split creates uneven launch timing between countries. European reference networks for rare diseases connect specialist centers and help route diagnosed patients to treatment sites. Several national systems operate managed entry agreements that stage payment for high-cost therapies, which supports access while protecting annual budgets. Regional manufacturing investment in cell and vector facilities continues to expand.
- Which Region Is Growing Fastest in the Genetic Disease Therapy Market?
Asia Pacific is growing fastest at a 14.7% CAGR through 2033, from 18.1% share in 2026. China, Japan, South Korea, India and Australia drive that expansion. Japan combines an established orphan drug framework with early adoption of advanced therapies, while China has expanded national reimbursement listings for selected rare disease treatments. India contributes large diagnosed populations and a growing network of genetic testing laboratories. Regional governments are funding rare disease policies, patient registries and designated centers of excellence. Local biomanufacturing investment in China and South Korea is building vector and cell processing capacity, which reduces dependence on imported product and supports more predictable supply.
- Reference Centers and Screening Programs Widen Latin American Access
Latin America accounts for 4.6% share in 2026 and grows at a 12.2% CAGR through 2033. Brazil, Mexico, Argentina and Colombia generate most activity. Brazil has a national rare disease policy and designated reference centers, which gives manufacturers a defined entry path. Public procurement and judicial access routes both play a role in how high-cost therapies reach patients, and that mix creates uneven volumes year to year. Currency movement and constrained public health budgets remain practical limits on adoption. Expanding newborn screening programs across the region are raising diagnosis rates for several disorders, which builds a treatable population ahead of broader reimbursement coverage.
- Gulf Health Systems Carry Middle East & Africa Volumes
Middle East & Africa holds 3.2% share in 2026 and expands at an 11.6% CAGR through 2033. Saudi Arabia, the United Arab Emirates, Israel, Qatar and South Africa account for most demand. Gulf states fund advanced treatment through national health systems and have invested in genomic medicine programs and specialist hospitals. High rates of consanguineous marriage in parts of the region raise the prevalence of recessive genetic disorders, which supports sustained clinical need. Across much of sub-Saharan Africa, diagnostic infrastructure and specialist capacity remain limited, so treated volumes stay small. Regional distribution agreements and medical tourism to Gulf centers currently carry a share of patient access.
Competitive Landscape
The market is moderately concentrated, with a small group of large biopharmaceutical companies holding most commercial revenue and a long tail of clinical-stage developers competing for the next approvals. Scale matters because launch economics depend on manufacturing control, global regulatory capability and payer negotiation experience. Large firms have acquired platform companies to add editing, RNA and vector capability rather than build it internally. That pattern keeps consolidating specialist assets into diversified portfolios.
Competition runs on platform breadth, delivery technology and manufacturing cost rather than on single products. Vendors differentiate through capsid engineering, lipid nanoparticle design, editing chemistry and tissue targeting, since these determine which organs a program can address. Control of analytical methods and release testing affects cost of goods and launch readiness. Newer entrants built around base editing, prime editing and in vivo delivery matter because they can reach targets that earlier approaches could not address.
Strategic activity centers on three moves. Companies acquire or license platform technology to widen the range of genetic targets they can pursue, which shortens the path to new indications. They invest in internal manufacturing suites to reduce dependence on contract capacity and protect launch timing. They also build commercial infrastructure around patient identification, treatment-center qualification and reimbursement support, because an approved therapy earns nothing until diagnosed patients reach a site able to administer it.
Competitive direction points toward platforms that serve several indications, delivery systems that widen target tissue, and pricing structures that payers can absorb. Access design is becoming a competitive variable in its own right, since companies that solve funding and logistics reach more of the diagnosed population. Partnerships with health systems and advocacy organizations are increasingly part of commercial strategy.
Industry Leaders
- Novartis AG
- Vertex Pharmaceuticals Incorporated
- Sarepta Therapeutics, Inc.
- Alnylam Pharmaceuticals, Inc.
- BioMarin Pharmaceutical Inc.
- Takeda Pharmaceutical Company Limited
- F. Hoffmann-La Roche Ltd
Companies Covered in the Report
- Novartis AG
- Vertex Pharmaceuticals Incorporated
- Sarepta Therapeutics, Inc.
- Alnylam Pharmaceuticals, Inc.
- BioMarin Pharmaceutical Inc.
- Takeda Pharmaceutical Company Limited
- F. Hoffmann-La Roche Ltd
- Biogen Inc.
- Ionis Pharmaceuticals, Inc.
- Pfizer Inc.
- Sanofi S.A.
- Ultragenyx Pharmaceutical Inc.
- PTC Therapeutics, Inc.
- CRISPR Therapeutics AG
- Intellia Therapeutics, Inc.
- Beam Therapeutics Inc.
- uniQure N.V.
- Krystal Biotech, Inc.
- Amicus Therapeutics, Inc.
Genetic Disease Therapy Market Report Scope
| Metric | Value |
| Study Period | 2020–2033 |
| Market Size 2026 | US$ 18.6 Billion |
| Market Size 2033 | US$ 39.6 Billion |
| CAGR 2026–2033 | 11.4% |
| Absolute Dollar Opportunity | US$ 21.0 Billion |
| Largest Market | North America (47.3% share in 2026) |
| Fastest-Growing Market | Asia Pacific (14.7% CAGR 2026–2033) |
| Market Concentration | Moderately Concentrated |
| Major Players | Novartis AG, Vertex Pharmaceuticals Incorporated, Sarepta Therapeutics, Inc., Alnylam Pharmaceuticals, Inc., BioMarin Pharmaceutical Inc. |
Genetic Disease Therapy Market Segmentation
- Executive Summary
- Global Genetic Disease Therapy Market Snapshot
- Future Projections, 2026–2033
- Key Industry Highlights
- Regional Snapshot
- Market Overview
- Market Definition and Report Scope
- Market Dynamics
- Drivers
- Expanding Set of Approved Therapies for Inherited Disorders
- Earlier Diagnosis Through Newborn and Genomic Screening
- Restraints
- Treatment Cost and Reimbursement Barriers Limit Patient Access
- Manufacturing Complexity and Limited Specialized Capacity
- Market Opportunities
- In Vivo Gene Editing Opens a New Revenue Pool
- Emerging Markets Build Rare Disease Treatment Capacity
- Drivers
- Global Genetic Disease Therapy Market Outlook, 2026–2033
- Global Genetic Disease Therapy Market Outlook, by Therapy Type, Value (US$ Billion), 2026–2033
- Enzyme Replacement Therapy
- RNA-based Therapy
- Gene Replacement Therapy
- Cell Therapy
- Gene Editing Therapy
- Others
- Global Genetic Disease Therapy Market Outlook, by Disease Area, Value (US$ Billion), 2026–2033
- Neuromuscular and Neurological Disorders
- Metabolic and Lysosomal Storage Disorders
- Hematological Disorders
- Ophthalmic Disorders
- Immunological Disorders
- Others
- Global Genetic Disease Therapy Market Outlook, by Route of Administration, Value (US$ Billion), 2026–2033
- Intravenous
- Subcutaneous
- Intrathecal and Intracerebroventricular
- Intraocular and Subretinal
- Others
- Global Genetic Disease Therapy Market Outlook, by End User, Value (US$ Billion), 2026–2033
- Specialty and Tertiary Care Hospitals
- Specialized Treatment Centers
- Ambulatory Infusion Centers
- Homecare Settings
- Others
- Global Genetic Disease Therapy Market Outlook, by Region, Value (US$ Billion), 2026–2033
- North America
- Europe
- Asia Pacific
- Latin America
- Middle East & Africa
- Global Genetic Disease Therapy Market Outlook, by Therapy Type, Value (US$ Billion), 2026–2033
- North America Genetic Disease Therapy Market Outlook, 2026–2033
- North America Genetic Disease Therapy Market Outlook, by Therapy Type, Value (US$ Billion), 2026–2033
- Enzyme Replacement Therapy
- RNA-based Therapy
- Gene Replacement Therapy
- Cell Therapy
- Gene Editing Therapy
- Others
- North America Genetic Disease Therapy Market Outlook, by Disease Area, Value (US$ Billion), 2026–2033
- Neuromuscular and Neurological Disorders
- Metabolic and Lysosomal Storage Disorders
- Hematological Disorders
- Ophthalmic Disorders
- Immunological Disorders
- Others
- North America Genetic Disease Therapy Market Outlook, by Route of Administration, Value (US$ Billion), 2026–2033
- Intravenous
- Subcutaneous
- Intrathecal and Intracerebroventricular
- Intraocular and Subretinal
- Others
- North America Genetic Disease Therapy Market Outlook, by End User, Value (US$ Billion), 2026–2033
- Specialty and Tertiary Care Hospitals
- Specialized Treatment Centers
- Ambulatory Infusion Centers
- Homecare Settings
- Others
- North America Genetic Disease Therapy Market Outlook, by Country, Value (US$ Billion), 2026–2033
- United States Genetic Disease Therapy Market Outlook, by Therapy Type, 2026–2033
- United States Genetic Disease Therapy Market Outlook, by Disease Area, 2026–2033
- United States Genetic Disease Therapy Market Outlook, by Route of Administration, 2026–2033
- United States Genetic Disease Therapy Market Outlook, by End User, 2026–2033
- Canada Genetic Disease Therapy Market Outlook, by Therapy Type, 2026–2033
- Canada Genetic Disease Therapy Market Outlook, by Disease Area, 2026–2033
- Canada Genetic Disease Therapy Market Outlook, by Route of Administration, 2026–2033
- Canada Genetic Disease Therapy Market Outlook, by End User, 2026–2033
- North America Genetic Disease Therapy Market Outlook, by Therapy Type, Value (US$ Billion), 2026–2033
- Europe Genetic Disease Therapy Market Outlook, 2026–2033
- Europe Genetic Disease Therapy Market Outlook, by Therapy Type, Value (US$ Billion), 2026–2033
- Enzyme Replacement Therapy
- RNA-based Therapy
- Gene Replacement Therapy
- Cell Therapy
- Gene Editing Therapy
- Others
- Europe Genetic Disease Therapy Market Outlook, by Disease Area, Value (US$ Billion), 2026–2033
- Neuromuscular and Neurological Disorders
- Metabolic and Lysosomal Storage Disorders
- Hematological Disorders
- Ophthalmic Disorders
- Immunological Disorders
- Others
- Europe Genetic Disease Therapy Market Outlook, by Route of Administration, Value (US$ Billion), 2026–2033
- Intravenous
- Subcutaneous
- Intrathecal and Intracerebroventricular
- Intraocular and Subretinal
- Others
- Europe Genetic Disease Therapy Market Outlook, by End User, Value (US$ Billion), 2026–2033
- Specialty and Tertiary Care Hospitals
- Specialized Treatment Centers
- Ambulatory Infusion Centers
- Homecare Settings
- Others
- Europe Genetic Disease Therapy Market Outlook, by Country, Value (US$ Billion), 2026–2033
- Germany Genetic Disease Therapy Market Outlook, by Therapy Type, 2026–2033
- Germany Genetic Disease Therapy Market Outlook, by Disease Area, 2026–2033
- Germany Genetic Disease Therapy Market Outlook, by Route of Administration, 2026–2033
- Germany Genetic Disease Therapy Market Outlook, by End User, 2026–2033
- France Genetic Disease Therapy Market Outlook, by Therapy Type, 2026–2033
- France Genetic Disease Therapy Market Outlook, by Disease Area, 2026–2033
- France Genetic Disease Therapy Market Outlook, by Route of Administration, 2026–2033
- France Genetic Disease Therapy Market Outlook, by End User, 2026–2033
- United Kingdom Genetic Disease Therapy Market Outlook, by Therapy Type, 2026–2033
- United Kingdom Genetic Disease Therapy Market Outlook, by Disease Area, 2026–2033
- United Kingdom Genetic Disease Therapy Market Outlook, by Route of Administration, 2026–2033
- United Kingdom Genetic Disease Therapy Market Outlook, by End User, 2026–2033
- Italy Genetic Disease Therapy Market Outlook, by Therapy Type, 2026–2033
- Italy Genetic Disease Therapy Market Outlook, by Disease Area, 2026–2033
- Italy Genetic Disease Therapy Market Outlook, by Route of Administration, 2026–2033
- Italy Genetic Disease Therapy Market Outlook, by End User, 2026–2033
- Spain Genetic Disease Therapy Market Outlook, by Therapy Type, 2026–2033
- Spain Genetic Disease Therapy Market Outlook, by Disease Area, 2026–2033
- Spain Genetic Disease Therapy Market Outlook, by Route of Administration, 2026–2033
- Spain Genetic Disease Therapy Market Outlook, by End User, 2026–2033
- Europe Genetic Disease Therapy Market Outlook, by Therapy Type, Value (US$ Billion), 2026–2033
- Asia Pacific Genetic Disease Therapy Market Outlook, 2026–2033
- Asia Pacific Genetic Disease Therapy Market Outlook, by Therapy Type, Value (US$ Billion), 2026–2033
- Enzyme Replacement Therapy
- RNA-based Therapy
- Gene Replacement Therapy
- Cell Therapy
- Gene Editing Therapy
- Others
- Asia Pacific Genetic Disease Therapy Market Outlook, by Disease Area, Value (US$ Billion), 2026–2033
- Neuromuscular and Neurological Disorders
- Metabolic and Lysosomal Storage Disorders
- Hematological Disorders
- Ophthalmic Disorders
- Immunological Disorders
- Others
- Asia Pacific Genetic Disease Therapy Market Outlook, by Route of Administration, Value (US$ Billion), 2026–2033
- Intravenous
- Subcutaneous
- Intrathecal and Intracerebroventricular
- Intraocular and Subretinal
- Others
- Asia Pacific Genetic Disease Therapy Market Outlook, by End User, Value (US$ Billion), 2026–2033
- Specialty and Tertiary Care Hospitals
- Specialized Treatment Centers
- Ambulatory Infusion Centers
- Homecare Settings
- Others
- Asia Pacific Genetic Disease Therapy Market Outlook, by Country, Value (US$ Billion), 2026–2033
- China Genetic Disease Therapy Market Outlook, by Therapy Type, 2026–2033
- China Genetic Disease Therapy Market Outlook, by Disease Area, 2026–2033
- China Genetic Disease Therapy Market Outlook, by Route of Administration, 2026–2033
- China Genetic Disease Therapy Market Outlook, by End User, 2026–2033
- Japan Genetic Disease Therapy Market Outlook, by Therapy Type, 2026–2033
- Japan Genetic Disease Therapy Market Outlook, by Disease Area, 2026–2033
- Japan Genetic Disease Therapy Market Outlook, by Route of Administration, 2026–2033
- Japan Genetic Disease Therapy Market Outlook, by End User, 2026–2033
- South Korea Genetic Disease Therapy Market Outlook, by Therapy Type, 2026–2033
- South Korea Genetic Disease Therapy Market Outlook, by Disease Area, 2026–2033
- South Korea Genetic Disease Therapy Market Outlook, by Route of Administration, 2026–2033
- South Korea Genetic Disease Therapy Market Outlook, by End User, 2026–2033
- India Genetic Disease Therapy Market Outlook, by Therapy Type, 2026–2033
- India Genetic Disease Therapy Market Outlook, by Disease Area, 2026–2033
- India Genetic Disease Therapy Market Outlook, by Route of Administration, 2026–2033
- India Genetic Disease Therapy Market Outlook, by End User, 2026–2033
- Australia Genetic Disease Therapy Market Outlook, by Therapy Type, 2026–2033
- Australia Genetic Disease Therapy Market Outlook, by Disease Area, 2026–2033
- Australia Genetic Disease Therapy Market Outlook, by Route of Administration, 2026–2033
- Australia Genetic Disease Therapy Market Outlook, by End User, 2026–2033
- Asia Pacific Genetic Disease Therapy Market Outlook, by Therapy Type, Value (US$ Billion), 2026–2033
- Latin America Genetic Disease Therapy Market Outlook, 2026–2033
- Latin America Genetic Disease Therapy Market Outlook, by Therapy Type, Value (US$ Billion), 2026–2033
- Enzyme Replacement Therapy
- RNA-based Therapy
- Gene Replacement Therapy
- Cell Therapy
- Gene Editing Therapy
- Others
- Latin America Genetic Disease Therapy Market Outlook, by Disease Area, Value (US$ Billion), 2026–2033
- Neuromuscular and Neurological Disorders
- Metabolic and Lysosomal Storage Disorders
- Hematological Disorders
- Ophthalmic Disorders
- Immunological Disorders
- Others
- Latin America Genetic Disease Therapy Market Outlook, by Route of Administration, Value (US$ Billion), 2026–2033
- Intravenous
- Subcutaneous
- Intrathecal and Intracerebroventricular
- Intraocular and Subretinal
- Others
- Latin America Genetic Disease Therapy Market Outlook, by End User, Value (US$ Billion), 2026–2033
- Specialty and Tertiary Care Hospitals
- Specialized Treatment Centers
- Ambulatory Infusion Centers
- Homecare Settings
- Others
- Latin America Genetic Disease Therapy Market Outlook, by Country, Value (US$ Billion), 2026–2033
- Brazil Genetic Disease Therapy Market Outlook, by Therapy Type, 2026–2033
- Brazil Genetic Disease Therapy Market Outlook, by Disease Area, 2026–2033
- Brazil Genetic Disease Therapy Market Outlook, by Route of Administration, 2026–2033
- Brazil Genetic Disease Therapy Market Outlook, by End User, 2026–2033
- Mexico Genetic Disease Therapy Market Outlook, by Therapy Type, 2026–2033
- Mexico Genetic Disease Therapy Market Outlook, by Disease Area, 2026–2033
- Mexico Genetic Disease Therapy Market Outlook, by Route of Administration, 2026–2033
- Mexico Genetic Disease Therapy Market Outlook, by End User, 2026–2033
- Argentina Genetic Disease Therapy Market Outlook, by Therapy Type, 2026–2033
- Argentina Genetic Disease Therapy Market Outlook, by Disease Area, 2026–2033
- Argentina Genetic Disease Therapy Market Outlook, by Route of Administration, 2026–2033
- Argentina Genetic Disease Therapy Market Outlook, by End User, 2026–2033
- Colombia Genetic Disease Therapy Market Outlook, by Therapy Type, 2026–2033
- Colombia Genetic Disease Therapy Market Outlook, by Disease Area, 2026–2033
- Colombia Genetic Disease Therapy Market Outlook, by Route of Administration, 2026–2033
- Colombia Genetic Disease Therapy Market Outlook, by End User, 2026–2033
- Latin America Genetic Disease Therapy Market Outlook, by Therapy Type, Value (US$ Billion), 2026–2033
- Middle East & Africa Genetic Disease Therapy Market Outlook, 2026–2033
- Middle East & Africa Genetic Disease Therapy Market Outlook, by Therapy Type, Value (US$ Billion), 2026–2033
- Enzyme Replacement Therapy
- RNA-based Therapy
- Gene Replacement Therapy
- Cell Therapy
- Gene Editing Therapy
- Others
- Middle East & Africa Genetic Disease Therapy Market Outlook, by Disease Area, Value (US$ Billion), 2026–2033
- Neuromuscular and Neurological Disorders
- Metabolic and Lysosomal Storage Disorders
- Hematological Disorders
- Ophthalmic Disorders
- Immunological Disorders
- Others
- Middle East & Africa Genetic Disease Therapy Market Outlook, by Route of Administration, Value (US$ Billion), 2026–2033
- Intravenous
- Subcutaneous
- Intrathecal and Intracerebroventricular
- Intraocular and Subretinal
- Others
- Middle East & Africa Genetic Disease Therapy Market Outlook, by End User, Value (US$ Billion), 2026–2033
- Specialty and Tertiary Care Hospitals
- Specialized Treatment Centers
- Ambulatory Infusion Centers
- Homecare Settings
- Others
- Middle East & Africa Genetic Disease Therapy Market Outlook, by Country and Subregion, Value (US$ Billion), 2026–2033
- Saudi Arabia Genetic Disease Therapy Market Outlook, by Therapy Type, 2026–2033
- Saudi Arabia Genetic Disease Therapy Market Outlook, by Disease Area, 2026–2033
- Saudi Arabia Genetic Disease Therapy Market Outlook, by Route of Administration, 2026–2033
- Saudi Arabia Genetic Disease Therapy Market Outlook, by End User, 2026–2033
- United Arab Emirates Genetic Disease Therapy Market Outlook, by Therapy Type, 2026–2033
- United Arab Emirates Genetic Disease Therapy Market Outlook, by Disease Area, 2026–2033
- United Arab Emirates Genetic Disease Therapy Market Outlook, by Route of Administration, 2026–2033
- United Arab Emirates Genetic Disease Therapy Market Outlook, by End User, 2026–2033
- Israel Genetic Disease Therapy Market Outlook, by Therapy Type, 2026–2033
- Israel Genetic Disease Therapy Market Outlook, by Disease Area, 2026–2033
- Israel Genetic Disease Therapy Market Outlook, by Route of Administration, 2026–2033
- Israel Genetic Disease Therapy Market Outlook, by End User, 2026–2033
- Qatar Genetic Disease Therapy Market Outlook, by Therapy Type, 2026–2033
- Qatar Genetic Disease Therapy Market Outlook, by Disease Area, 2026–2033
- Qatar Genetic Disease Therapy Market Outlook, by Route of Administration, 2026–2033
- Qatar Genetic Disease Therapy Market Outlook, by End User, 2026–2033
- South Africa Genetic Disease Therapy Market Outlook, by Therapy Type, 2026–2033
- South Africa Genetic Disease Therapy Market Outlook, by Disease Area, 2026–2033
- South Africa Genetic Disease Therapy Market Outlook, by Route of Administration, 2026–2033
- South Africa Genetic Disease Therapy Market Outlook, by End User, 2026–2033
- Gulf states Genetic Disease Therapy Market Outlook, by Therapy Type, 2026–2033
- Gulf states Genetic Disease Therapy Market Outlook, by Disease Area, 2026–2033
- Gulf states Genetic Disease Therapy Market Outlook, by Route of Administration, 2026–2033
- Gulf states Genetic Disease Therapy Market Outlook, by End User, 2026–2033
- Middle East & Africa Genetic Disease Therapy Market Outlook, by Therapy Type, Value (US$ Billion), 2026–2033
- Competitive Landscape
- Industry Leaders
- Company Profiles
- Novartis AG
- Vertex Pharmaceuticals Incorporated
- Sarepta Therapeutics, Inc.
- Alnylam Pharmaceuticals, Inc.
- BioMarin Pharmaceutical Inc.
- Takeda Pharmaceutical Company Limited
- F. Hoffmann-La Roche Ltd
- Biogen Inc.
- Ionis Pharmaceuticals, Inc.
- Pfizer Inc.
- Sanofi S.A.
- Ultragenyx Pharmaceutical Inc.
- PTC Therapeutics, Inc.
- CRISPR Therapeutics AG
- Intellia Therapeutics, Inc.
- Beam Therapeutics Inc.
- uniQure N.V.
- Krystal Biotech, Inc.
- Amicus Therapeutics, Inc.
- Appendix
- Research Methodology
- Report Assumptions
- Acronyms and Abbreviations
Therapy Type
- Enzyme Replacement Therapy
- RNA-based Therapy
- Gene Replacement Therapy
- Cell Therapy
- Gene Editing Therapy
- Others
Disease Area
- Neuromuscular and Neurological Disorders
- Metabolic and Lysosomal Storage Disorders
- Hematological Disorders
- Ophthalmic Disorders
- Immunological Disorders
- Others
Route of Administration
- Intravenous
- Subcutaneous
- Intrathecal and Intracerebroventricular
- Intraocular and Subretinal
- Others
End User
- Specialty and Tertiary Care Hospitals
- Specialized Treatment Centers
- Ambulatory Infusion Centers
- Homecare Settings
- Others
Region
- North America
- Europe
- Asia Pacific
- Latin America
- Middle East & Africa
Our Research Methodology
Considering the volatility of business today, traditional approaches to strategizing a game plan can be unfruitful if not detrimental. True ambiguity is no way to determine a forecast. A myriad of predetermined factors must be accounted for such as the degree of risk involved, the magnitude of circumstances, as well as conditions or consequences that are not known or unpredictable. To circumvent binary views that cast uncertainty, the application of market research intelligence to strategically posture, move, and enable actionable outcomes is necessary.
View Methodology
Quality Assured
Rigorous Validation Process

Confidentiality Assured
End-to-end Data Security

Custom Research Services
Tailored To Your Objectives
FAQs
The global market is valued at US$ 18.6 billion in 2026 and is projected to reach US$ 39.6 billion by 2033.
The market is expected to grow at a 11.4% CAGR between 2026 and 2033, adding an absolute opportunity of US$ 21.0 billion.
Enzyme replacement therapy leads with 31.8% share in 2026, while gene editing therapy grows fastest at a 19.6% CAGR through 2033.
North America holds 47.3% of global revenue share in 2026, while Asia Pacific grows fastest at a 14.7% CAGR through 2033.
Key operating companies include Novartis AG, Vertex Pharmaceuticals Incorporated, Sarepta Therapeutics, Inc., Alnylam Pharmaceuticals, Inc., BioMarin Pharmaceutical Inc. and Takeda Pharmaceutical Company Limited.
Related Reports
Pantoprazole Sodium Market Size, Share, Insights, Competitive Landscape, and Forecast 2026 to 2033
The global pantoprazole sodium market is valued at US$2.36 billion in 2026, reaching US$3.57 billion by 2033, growing at a 6.1% CAGR
Immunotherapy Market Size, Share, Insights, Competitive Landscape, and Forecast 2026 to 2033
The global immunotherapy market is valued at US$274.5 billion in 2026, reaching US$521.4 billion by 2033, growing at a 9.6% CAGR
Hydroxychloroquine Market Size, Share, Insights, Competitive Landscape, and Forecast 2026 to 2033
The global hydroxychloroquine market is valued at US$1.71 billion in 2026, reaching US$2.66 billion by 2033, growing at a 6.6% CAGR
Hormone Replacement Therapy Market Size, Share, Insights, Competitive Landscape, and Forecast 2026 to 2033
The global hormone replacement therapy market is valued at US$27.3 billion in 2026, reaching US$45.6 billion by 2033, growing at a 7.6% CAGR
Healthcare Regulatory Affairs Outsourcing Market Size, Share, Insights, Competitive Landscape, and Forecast 2026 to 2033
The global healthcare regulatory affairs outsourcing market is valued at US$8.6 billion in 2026, reaching US$17.6 billion by 2033, growing at a 10.8% CAGR
Fertility Market Size, Share, Insights, Competitive Landscape, and Forecast 2026 to 2033
Explore the fertility market outlook for 2026–2033, including treatment trends, growth drivers, regional insights, and competitive developments.