



Iron and Steel Market
Iron and Steel Market Size, Share, Insights, Competitive Landscape, and Forecast 2026 to 2033
Iron and Steel Market Size and Trend Analysis
What Is the Growth Outlook for the Iron and Steel Market?
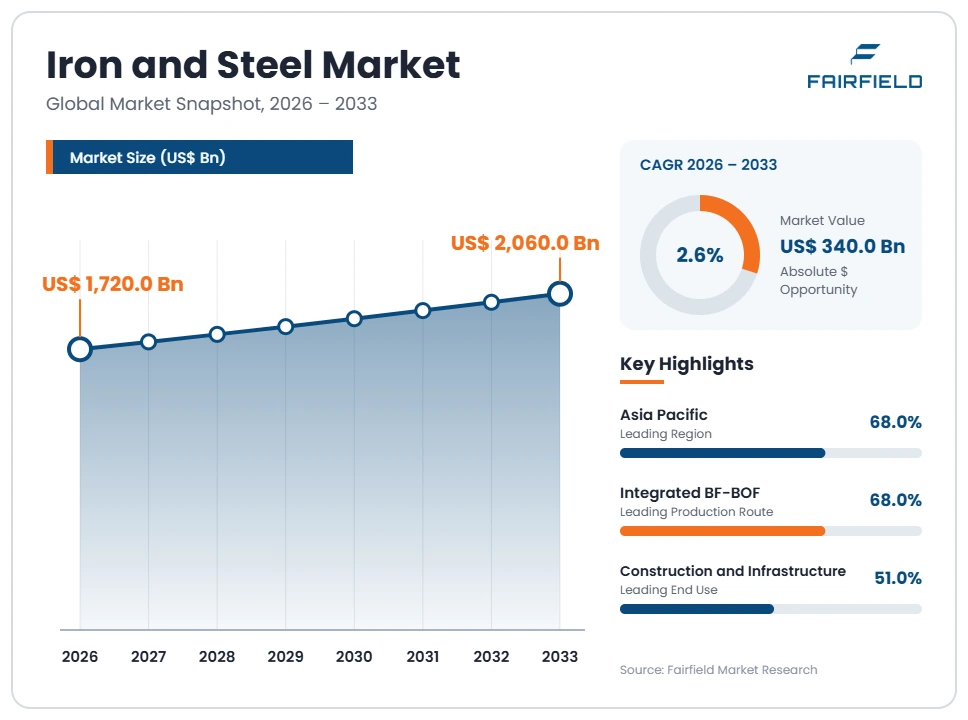
The global Iron and Steel market size is expected to be valued at US$ 1,720.0 billion in 2026 and projected to reach US$ 2,060.0 billion by 2033, growing at a CAGR of 2.6% between 2026 and 2033.
Between 2020 and 2025 the industry grew near 2.1% a year in value, with crude steel tonnage close to flat. Three forces carry the forecast. Infrastructure, grid and pipeline construction in India, the Gulf and parts of Africa replaces demand lost as property building in China contracts. Automotive and machinery buyers shift toward higher-strength, higher-value grades. Certified lower-emission tonnes begin to earn a modest premium from customers reporting supply-chain emissions. The direction is slow value growth on broadly flat volume. Structural overcapacity, thin spreads and widening trade measures cap pricing, so margin improvement must come from product mix, scrap use and energy cost control rather than from tonnage.
Key Report Takeaways
- By Production Route: Integrated Blast Furnace–Basic Oxygen Furnace held 68% share in 2026, while Direct Reduction is projected to expand at a 6.4% CAGR through 2033, driven by gas-based plant build-out in the Gulf and hydrogen-ready pilot lines.
- By Product Form: Flat Products held 45% share in 2026, while Tubular Products are projected to grow at a 3.6% CAGR through 2033, supported by pipeline replacement, water networks and structural hollow sections in building frames.
- By Steel Type: Carbon Steel held 86% share in 2026, while Alloy Steel is projected to advance at a 3.9% CAGR through 2033, reflecting advanced high-strength automotive grades and heavier wind and drilling components.
- By End Use: Construction and Infrastructure held 51% share in 2026, while Energy is projected to post a 4.5% CAGR through 2033, pulled by transmission towers, wind foundations and gas gathering networks.
- By Geography: Asia Pacific held 68% share in 2026, while Middle East & Africa is projected to grow at a 4.2% CAGR through 2033, helped by cheap natural gas, new direct reduction capacity and infrastructure programmes.
Global Iron and Steel Market Trends and Insights
Drivers Impact Analysis
Two demand forces account for most of the modest growth expected in global steel value.
| Driver | Impact on CAGR Forecast | Geographic Relevance | Impact Timeline |
| Infrastructure, grid and pipeline construction outside China | High | Asia Pacific, Middle East & Africa, North America | Long term (≥4 years) |
| Buyer procurement of certified lower-emission steel | Medium | Europe, North America | Medium term (2–4 years) |
Grid, Pipeline and Housing Programmes Outside China Hold Steel Tonnage Steady
Infrastructure spending is now the main thing stopping global steel demand from falling. As residential construction in China contracts, demand growth has moved to India, Indonesia, Vietnam, Saudi Arabia, Egypt and Nigeria, where road, rail, housing, water and power programmes consume rebar, sections, plate and welded tube. Electricity networks are the clearest single pull, because transmission towers, substations and wind foundations are steel-intensive.
The mechanism is simple substitution of one construction cycle for another. A kilometre of transmission line, a water main or a railway consumes long and tubular products rather than the flat coil used in appliances. Grid connection queues for solar and wind projects in the United States, the European Union and India have turned into multi-year tower and foundation order books. Gas gathering and export pipelines in the Gulf add heavy plate and line pipe volume that is independent of building activity.
Certified Lower-Emission Grades Create a Paying Market Above Commodity Prices
A genuine price premium has appeared for steel sold with a verified low emission intensity, and it is beginning to change what mills choose to produce. Automotive, appliance, packaging and construction customers that report Scope 3 emissions now write emission intensity into tenders. That converts an environmental target into a commercial specification, which is the condition a premium needs.
The causal mechanism is regulatory and contractual together. The European Union Carbon Border Adjustment Mechanism puts a cost on the embedded emissions of imported steel, while the phase-down of free allocation under the European Union Emissions Trading System raises the carbon cost carried by domestic blast furnace output. At the same time ResponsibleSteel certification and the emerging near-zero and low-emission steel definitions give buyers a common way to verify claims. Scrap-fed electric arc furnace product and direct reduced iron grades are the main beneficiaries.
Restraints Impact Analysis
Two structural conditions hold back pricing power and delay reinvestment across the industry.
| Restraint | Impact on CAGR Forecast | Geographic Relevance | Impact Timeline |
| Structural overcapacity and the spread of trade measures | High | Global | Short term (≤2 years) |
| Capital cost and stranded-asset risk of replacing blast furnaces | High | Europe, Asia Pacific, North America | Long term (≥4 years) |
Overcapacity and Widening Trade Measures Keep Steel Spreads Thin
Global steelmaking capacity comfortably exceeds demand, and that gap, not cost inflation, is what sets margins in this industry. The imbalance is overwhelmingly a question of scale: capacity built in China for a construction cycle that has since slowed now has to find buyers abroad. The resulting export flows have pushed prices down in almost every open market.
The consequence is a defensive trade environment. Safeguard quotas and anti-dumping duties on steel products are in force in the European Union, the United States, India, Turkey, Mexico and Brazil, and the United States applies Section 232 tariffs on steel imports. Each measure protects a domestic base but invites retaliation and fragments the market, so mills size investment to a protected home region rather than to global demand. Thin spreads then delay maintenance and modernisation, which raises unit cost further.
Replacing Mid-Life Blast Furnaces Carries Heavy Capital and Stranded-Asset Risk
Decarbonisation stalls on the balance sheet long before it stalls on engineering. A blast furnace is relined roughly every 15 to 20 years, and the economic moment to switch technology is at that reline. Outside that window, abandoning a furnace means writing off an asset that still works, which few boards will approve without support.
The specific costs are identifiable. A direct reduction plant with an electric arc furnace needs a new shaft furnace, oxygen and gas supply, a melter or submerged arc furnace for lower-grade ore, and often a grid connection measured in hundreds of megawatts. Operating cost then depends on inputs the mill does not control: natural gas price for the gas-based route, and the cost and availability of low-carbon hydrogen plus high-grade direct reduction pellet for the hydrogen route. High-grade pellet supply is limited, and pellet premiums rise whenever direct reduction demand increases.
Market Opportunities
High-Grade Iron Ore and Direct Reduced Iron Supply Opens a Premium Feedstock Pool
The clearest new revenue pool in this industry is not steel at all but the feedstock that low-emission steel requires. Direct reduction needs iron ore pellet of higher iron content and lower silica than blast furnaces accept, and that quality is scarce. Merchant direct reduced iron and hot briquetted iron are becoming tradable products in their own right, with pricing that moves independently of ordinary ore.
Capture favours miners able to beneficiate to direct reduction grade, pellet producers with spare capacity, and gas-rich locations that can export metallised iron rather than gas. Demand comes from electric arc furnace operators in Europe, North America and Japan who cannot source enough clean scrap and need a virgin iron unit to dilute residual elements. Scrap availability, not technology, limits how fast the electric arc furnace route can take share, which is exactly why this feedstock pool exists.
Advanced High-Strength Automotive Grades Lift Revenue per Tonne Shipped
Premium automotive flat products are a revenue pool that grows even when tonnage does not, because the value sits in metallurgy rather than weight. Advanced high-strength, press-hardened and third-generation grades let carmakers remove mass while meeting crash requirements, and they sell at a clear premium over commercial-quality coil. Heavier battery electric vehicles have made that mass saving more valuable, not less.
Capture belongs to mills with continuous annealing, hot-dip galvanising and press-hardening capability, plus the metallurgical service to co-develop parts with a carmaker. Demand is created by vehicle assembly in Germany, the United States, Japan, South Korea, China and India, and increasingly by battery enclosure and side-impact structures. Qualification cycles run for years and protect incumbents once approved. Coated grades for battery housings and corrosion-critical underbody parts extend the same premium into newer vehicle platforms.
Segment Analysis
- By Production Route: Integrated Mills Still Dominate While Direct Reduction Scales Fastest
The integrated Blast Furnace–Basic Oxygen Furnace route held 68% of output value in 2026, because it remains the only way to make large tonnages of high-quality flat steel from iron ore at low cash cost. Its coke ovens, sinter plants and furnaces are long-lived, heavily depreciated and tightly integrated, which makes incremental tonne cost very hard to beat.
Direct Reduction, including gas-based plants and the hydrogen-based lines under development, is the fastest-growing route at a 6.4% CAGR to 2033, from a small base. Electric Arc Furnace steelmaking holds a large and stable share but expands slowly, and the reason is unambiguous: scrap availability, not technology, limits how fast the electric arc furnace route can take share. The world’s scrap pool is finite, already fully collected and fully used, so new electric capacity mostly competes for existing scrap rather than adding supply.
- By Product Form: Flat Products Lead While Tubular Volumes Grow Quickest
Flat Products accounted for 45% of the market in 2026, covering hot and cold rolled coil, coated and galvanised sheet and plate. Their lead reflects automotive, appliance, packaging and machinery demand, all of which specify surface quality and consistent gauge that only wide strip mills deliver. Long Products, including rebar, sections, wire rod and rail, follow closely on construction tonnage.
Tubular Products are the fastest-growing form at a 3.6% CAGR through 2033. Pipeline replacement, gas gathering systems, water networks, structural hollow sections in building frames and monopile foundations for offshore wind all consume welded and seamless tube. Semi-Finished Products, covering slab, bloom and billet, trade as a balancing item between regions with surplus liquid steel and rolling mills short of feed. For producers, the practical implication is that rolling capability, rather than melting capacity, increasingly determines realised price.
- By Steel Type: Carbon Steel Carries Volume While Alloy Grades Gain Value
Carbon Steel represented 86% of the market in 2026, which is the natural result of construction and general engineering demand. These grades are made to broad chemical specifications, traded on delivered cost and produced by both integrated and electric routes, so differentiation is limited and pricing follows regional supply balance rather than technical merit.
Alloy Steel is growing fastest at a 3.9% CAGR to 2033, pulled by advanced high-strength automotive grades, heavy plate for wind foundations, and quenched and tempered grades for mining and drilling equipment. Stainless Steel and Tool and Other Specialty Steel occupy small but technically protected shares, and specialty stainless and electrical steel products are analysed in separate studies while being counted here only inside the totals. The business implication is a widening gap between mills that can hit tight hardenability and cleanliness targets and those selling commodity tonnage.
- By End Use: Construction Sets the Baseline While Energy Demand Accelerates
Construction and Infrastructure consumed 51% of global steel in 2026, making building activity the single most important swing factor for the industry. Rebar, sections, plate, coated sheet and tube all flow into housing, commercial property, bridges, rail and water systems, and regional demand tracks public capital budgets more closely than private investment.
Energy is the fastest-growing end use at a 4.5% CAGR through 2033, covering pipelines, transmission towers, substations, drilling equipment and wind foundations. Machinery and Equipment, Automotive and Transport, Packaging and Consumer Goods make up the balance, with Packaging the steadiest because tinplate demand follows food consumption. Grid reinforcement programmes are the most dependable element of the energy pull, since they proceed regardless of oil price. The implication is that mills serving plate, tube and heavy section markets have a better demand outlook than those weighted to appliance and packaging coil.
Geography Analysis
- North America Trades Protected Prices for Limited Volume Growth
North America held 10% of the global iron and steel market in 2026 and is forecast to grow at 1.9% a year. The United States dominates consumption and output, with Mexico supplying automotive and appliance demand and Canada contributing plate, long products and automotive coil.
The defining feature is trade protection. Section 232 tariffs, together with anti-dumping and countervailing duties, keep domestic prices above world levels and support reinvestment in electric arc furnace capacity. Most new capacity added in the region is scrap-based, which gives it a lower emission intensity than the global average but ties it directly to scrap and pig iron supply.
The change to watch is the search for virgin iron units. Domestic mills increasingly need imported pig iron or direct reduced iron to make clean flat products, and securing that supply has become a strategic priority.
- Europe Carries the Highest Carbon Cost in the Global Steel Industry
Europe represented 10% of the market in 2026 and is the slowest-growing region at 1.1% a year. Germany, Italy, France, Spain, Poland and the United Kingdom form the core, serving automotive, machinery and construction customers with a mix of integrated and electric capacity.
Policy sets the regional picture. The Carbon Border Adjustment Mechanism applies a carbon cost to imported steel, while the phase-down of free allocation under the Emissions Trading System steadily raises the cost of domestic blast furnace production. A safeguard measure limits duty-free import volumes. Together these create the world’s strongest commercial pull for certified low-emission steel, and the clearest cost penalty for delay.
The regional opportunity is premium positioning. High energy prices make commodity tonnage uncompetitive, so value lies in certified grades, automotive metallurgy and close customer integration.
- Which Region Is Leading the Iron and Steel Market?
Asia Pacific leads the iron and steel market with 68% share in 2026, growing at 2.5% a year, because most of the world’s steelmaking capacity and most of its steel-consuming manufacturing sit inside the region. China alone produces over half of global crude steel, with India, Japan, South Korea, Vietnam and Indonesia supplying the rest.
The causes are structural. Integrated mills sit close to ports, coking coal and ore imports, and to the shipbuilding, appliance, machinery and automotive plants that consume their output. Scale gives very low conversion cost.
The region is also the source of the industry’s central problem. Capacity in China exceeds slowing domestic demand, and the resulting exports have triggered trade measures almost everywhere. India is the main growth engine, adding both blast furnace and electric capacity for domestic infrastructure.
- Latin America Depends on Imports Despite Strong Iron Ore Resources
Latin America held 5% of the market in 2026 and is forecast to expand at 2.9% a year. Brazil is the anchor, with large integrated mills and world-class iron ore reserves, followed by Mexico, Argentina, Colombia and Chile. Mexico is closely tied to automotive manufacturing demand.
The barriers are industrial rather than geological. Domestic rolling capacity is narrower than domestic consumption, so finished products are frequently imported even where crude steel is exported. Currency volatility, high financing cost, uneven industrial electricity prices and freight distances all raise delivered cost, and import competition has forced duty action in several countries.
The opportunity is in iron units. High-quality ore and available natural gas make the region a natural location for pellet and direct reduced iron supply to electric furnace operators elsewhere.
- Which Region Is Growing Fastest in the Iron and Steel Market?
Middle East & Africa is growing fastest in the iron and steel market at a 4.2% CAGR between 2026 and 2033, from a 7% share in 2026. Growth centres on Saudi Arabia, the United Arab Emirates, Egypt, Qatar, Algeria, Morocco and South Africa.
The driver is feedstock and energy position. Low-cost natural gas makes gas-based direct reduction economic at scale, and the region already hosts a large share of world direct reduced iron capacity. Combined with electric arc furnaces, that gives mills a lower emission intensity than the global average and an export advantage into carbon-priced markets.
Barriers remain real: dependence on imported pellet of direct reduction grade, water scarcity, skilled labour shortages and political risk in parts of the region. The change to watch is industrial diversification spending, which converts gas into exportable metallised iron.
Competitive Landscape
The iron and steel industry has low concentration by any normal measure. The ten largest producers account for only around a quarter of global crude steel output, and hundreds of mills operate below that tier. China Baowu Steel Group is the largest single producer, followed at a distance by ArcelorMittal, Nippon Steel Corporation, HBIS Group, POSCO Holdings and Shagang Group. Consolidation has been pursued in China, Japan and India, usually through state-encouraged mergers or distressed asset purchases, but it has not materially changed global structure. Freight economics also keep competition regional for long products, while flat products and semi-finished slab trade internationally.
Competition rests on delivered cash cost, product mix, proximity to customers and, increasingly, verified emission intensity. Cost position is set by iron ore and coking coal contracts, energy prices, scrap access and labour productivity rather than by brand. In flat products, metallurgical capability and coating lines separate mills that can serve automotive from those limited to construction grades. New competitive approaches come mainly from scrap-based electric producers entering flat product markets, and from gas-rich locations exporting metallised iron instead of raw gas.
Strategic activity across the industry concentrates on four things: replacing coke-based ironmaking with direct reduction and electric melting at reline decision points, securing high-grade iron ore and scrap supply, adding downstream processing and coating capacity to capture more value per tonne, and certifying product emission intensity so it can be sold into carbon-priced markets. Several producers have also moved to secure captive renewable power.
Strategic direction is consistent even where balance sheets are not. Producers are protecting cash cost, deferring irreversible capital until policy and hydrogen economics are clearer, and positioning scrap-based and direct reduction tonnage as the premium end of their order books.
Iron and Steel Industry Leaders
China Baowu Steel Group
ArcelorMittal
Nippon Steel Corporation
POSCO Holdings
Nucor Corporation
Recent Industry Developments
- June 2024: The European Commission extended the European Union safeguard measure on steel imports, carrying tariff-rate quotas on major product categories through to mid-2026 – preserving a volume ceiling that shapes import planning for every exporter into the bloc.
- March 2025: The United States reinstated full Section 232 tariffs on steel imports and removed country exemptions and product exclusions – restoring a uniform import cost and widening the gap between domestic and world steel prices.
- March 2025: The European Commission published the European Steel and Metals Action Plan, setting out trade defence, energy cost and lead-market measures for the sector – signalling that demand-side support for low-emission steel will accompany carbon pricing.
- January 2026: The definitive phase of the European Union Carbon Border Adjustment Mechanism began, requiring importers of iron and steel to surrender certificates for embedded emissions as free allocation under the Emissions Trading System starts to phase down – the single most consequential instrument now operating in steel trade.
Companies Covered in the Report
- China Baowu Steel Group
- ArcelorMittal
- Nippon Steel Corporation
- HBIS Group
- POSCO Holdings
- Shagang Group
- Ansteel Group Corporation
- Tata Steel Limited
- JFE Steel Corporation
- Nucor Corporation
- Hyundai Steel Company
- JSW Steel Limited
- Cleveland-Cliffs Inc.
- Steel Authority of India Limited
Iron and Steel Market Report Scope
| Metric | Value |
| Study Period (2020–2033) | Historical 2020–2025, base year 2025, forecast 2026–2033 |
| Market Size 2026 | US$ 1720.0 Billion |
| Market Size 2033 | US$ 2060.0 Billion |
| CAGR 2026–2033 | 2.6% |
| Absolute Dollar Opportunity | US$ 340.0 Billion |
| Largest Market | Asia Pacific (68% share in 2026) |
| Fastest-Growing Market | Middle East & Africa (4.2% CAGR) |
| Market Concentration | Low |
| Major Players | China Baowu Steel Group, ArcelorMittal, Nippon Steel Corporation, POSCO Holdings, Nucor Corporation |
Iron and Steel Market Segmentation
- Executive Summary
- Global Iron and Steel Market Snapshot
- Future Projections, 2026-2033
- Key Market Trends
- Regional Snapshot
- Market Overview
- Market Definition and Report Scope
- Historical Market Trends
- Market Dynamics
- Drivers Impact Analysis
- Grid, Pipeline and Housing Programmes Outside China Hold Steel Tonnage Steady
- Certified Lower-Emission Grades Create a Paying Market Above Commodity Prices
- Restraints Impact Analysis
- Overcapacity and Widening Trade Measures Keep Steel Spreads Thin
- Replacing Mid-Life Blast Furnaces Carries Heavy Capital and Stranded-Asset Risk
- Market Opportunities
- High-Grade Iron Ore and Direct Reduced Iron Supply Opens a Premium Feedstock Pool
- Advanced High-Strength Automotive Grades Lift Revenue per Tonne Shipped
- Drivers Impact Analysis
- Global Iron and Steel Market Outlook, 2020-2033
- Global Iron and Steel Market Outlook, by Production Route, Value (US$ Billion), 2020-2033
- Integrated Blast Furnace–Basic Oxygen Furnace
- Electric Arc Furnace
- Direct Reduction
- Global Iron and Steel Market Outlook, by Product Form, Value (US$ Billion), 2020-2033
- Flat Products
- Long Products
- Tubular Products
- Semi-Finished Products
- Global Iron and Steel Market Outlook, by Steel Type, Value (US$ Billion), 2020-2033
- Carbon Steel
- Alloy Steel
- Stainless Steel
- Tool and Other Specialty Steel
- Global Iron and Steel Market Outlook, by End Use, Value (US$ Billion), 2020-2033
- Construction and Infrastructure
- Automotive and Transport
- Machinery and Equipment
- Energy
- Packaging
- Consumer Goods
- Global Iron and Steel Market Outlook, by Region, Value (US$ Billion), 2020-2033
- North America
- Europe
- Asia Pacific
- Latin America
- Middle East & Africa
- Global Iron and Steel Market Outlook, by Production Route, Value (US$ Billion), 2020-2033
- North America Iron and Steel Market Outlook, 2020-2033
- North America Iron and Steel Market Outlook, by Production Route, Value (US$ Billion), 2020-2033
- Integrated Blast Furnace–Basic Oxygen Furnace
- Electric Arc Furnace
- Direct Reduction
- North America Iron and Steel Market Outlook, by Product Form, Value (US$ Billion), 2020-2033
- Flat Products
- Long Products
- Tubular Products
- Semi-Finished Products
- North America Iron and Steel Market Outlook, by Steel Type, Value (US$ Billion), 2020-2033
- Carbon Steel
- Alloy Steel
- Stainless Steel
- Tool and Other Specialty Steel
- North America Iron and Steel Market Outlook, by End Use, Value (US$ Billion), 2020-2033
- Construction and Infrastructure
- Automotive and Transport
- Machinery and Equipment
- Energy
- Packaging
- Consumer Goods
- North America Iron and Steel Market Outlook, by Country, Value (US$ Billion), 2020-2033
- United States Iron and Steel Market Outlook, by Production Route, 2020-2033
- United States Iron and Steel Market Outlook, by Product Form, 2020-2033
- United States Iron and Steel Market Outlook, by Steel Type, 2020-2033
- United States Iron and Steel Market Outlook, by End Use, 2020-2033
- Mexico Iron and Steel Market Outlook, by Production Route, 2020-2033
- Mexico Iron and Steel Market Outlook, by Product Form, 2020-2033
- Mexico Iron and Steel Market Outlook, by Steel Type, 2020-2033
- Mexico Iron and Steel Market Outlook, by End Use, 2020-2033
- Canada Iron and Steel Market Outlook, by Production Route, 2020-2033
- Canada Iron and Steel Market Outlook, by Product Form, 2020-2033
- Canada Iron and Steel Market Outlook, by Steel Type, 2020-2033
- Canada Iron and Steel Market Outlook, by End Use, 2020-2033
- North America Iron and Steel Market Outlook, by Production Route, Value (US$ Billion), 2020-2033
- Europe Iron and Steel Market Outlook, 2020-2033
- Europe Iron and Steel Market Outlook, by Production Route, Value (US$ Billion), 2020-2033
- Integrated Blast Furnace–Basic Oxygen Furnace
- Electric Arc Furnace
- Direct Reduction
- Europe Iron and Steel Market Outlook, by Product Form, Value (US$ Billion), 2020-2033
- Flat Products
- Long Products
- Tubular Products
- Semi-Finished Products
- Europe Iron and Steel Market Outlook, by Steel Type, Value (US$ Billion), 2020-2033
- Carbon Steel
- Alloy Steel
- Stainless Steel
- Tool and Other Specialty Steel
- Europe Iron and Steel Market Outlook, by End Use, Value (US$ Billion), 2020-2033
- Construction and Infrastructure
- Automotive and Transport
- Machinery and Equipment
- Energy
- Packaging
- Consumer Goods
- Europe Iron and Steel Market Outlook, by Country, Value (US$ Billion), 2020-2033
- Germany Iron and Steel Market Outlook, by Production Route, 2020-2033
- Germany Iron and Steel Market Outlook, by Product Form, 2020-2033
- Germany Iron and Steel Market Outlook, by Steel Type, 2020-2033
- Germany Iron and Steel Market Outlook, by End Use, 2020-2033
- Italy Iron and Steel Market Outlook, by Production Route, 2020-2033
- Italy Iron and Steel Market Outlook, by Product Form, 2020-2033
- Italy Iron and Steel Market Outlook, by Steel Type, 2020-2033
- Italy Iron and Steel Market Outlook, by End Use, 2020-2033
- France Iron and Steel Market Outlook, by Production Route, 2020-2033
- France Iron and Steel Market Outlook, by Product Form, 2020-2033
- France Iron and Steel Market Outlook, by Steel Type, 2020-2033
- France Iron and Steel Market Outlook, by End Use, 2020-2033
- Spain Iron and Steel Market Outlook, by Production Route, 2020-2033
- Spain Iron and Steel Market Outlook, by Product Form, 2020-2033
- Spain Iron and Steel Market Outlook, by Steel Type, 2020-2033
- Spain Iron and Steel Market Outlook, by End Use, 2020-2033
- Poland Iron and Steel Market Outlook, by Production Route, 2020-2033
- Poland Iron and Steel Market Outlook, by Product Form, 2020-2033
- Poland Iron and Steel Market Outlook, by Steel Type, 2020-2033
- Poland Iron and Steel Market Outlook, by End Use, 2020-2033
- United Kingdom Iron and Steel Market Outlook, by Production Route, 2020-2033
- United Kingdom Iron and Steel Market Outlook, by Product Form, 2020-2033
- United Kingdom Iron and Steel Market Outlook, by Steel Type, 2020-2033
- United Kingdom Iron and Steel Market Outlook, by End Use, 2020-2033
- Europe Iron and Steel Market Outlook, by Production Route, Value (US$ Billion), 2020-2033
- Asia Pacific Iron and Steel Market Outlook, 2020-2033
- Asia Pacific Iron and Steel Market Outlook, by Production Route, Value (US$ Billion), 2020-2033
- Integrated Blast Furnace–Basic Oxygen Furnace
- Electric Arc Furnace
- Direct Reduction
- Asia Pacific Iron and Steel Market Outlook, by Product Form, Value (US$ Billion), 2020-2033
- Flat Products
- Long Products
- Tubular Products
- Semi-Finished Products
- Asia Pacific Iron and Steel Market Outlook, by Steel Type, Value (US$ Billion), 2020-2033
- Carbon Steel
- Alloy Steel
- Stainless Steel
- Tool and Other Specialty Steel
- Asia Pacific Iron and Steel Market Outlook, by End Use, Value (US$ Billion), 2020-2033
- Construction and Infrastructure
- Automotive and Transport
- Machinery and Equipment
- Energy
- Packaging
- Consumer Goods
- Asia Pacific Iron and Steel Market Outlook, by Country, Value (US$ Billion), 2020-2033
- China Iron and Steel Market Outlook, by Production Route, 2020-2033
- China Iron and Steel Market Outlook, by Product Form, 2020-2033
- China Iron and Steel Market Outlook, by Steel Type, 2020-2033
- China Iron and Steel Market Outlook, by End Use, 2020-2033
- India Iron and Steel Market Outlook, by Production Route, 2020-2033
- India Iron and Steel Market Outlook, by Product Form, 2020-2033
- India Iron and Steel Market Outlook, by Steel Type, 2020-2033
- India Iron and Steel Market Outlook, by End Use, 2020-2033
- Japan Iron and Steel Market Outlook, by Production Route, 2020-2033
- Japan Iron and Steel Market Outlook, by Product Form, 2020-2033
- Japan Iron and Steel Market Outlook, by Steel Type, 2020-2033
- Japan Iron and Steel Market Outlook, by End Use, 2020-2033
- South Korea Iron and Steel Market Outlook, by Production Route, 2020-2033
- South Korea Iron and Steel Market Outlook, by Product Form, 2020-2033
- South Korea Iron and Steel Market Outlook, by Steel Type, 2020-2033
- South Korea Iron and Steel Market Outlook, by End Use, 2020-2033
- Vietnam Iron and Steel Market Outlook, by Production Route, 2020-2033
- Vietnam Iron and Steel Market Outlook, by Product Form, 2020-2033
- Vietnam Iron and Steel Market Outlook, by Steel Type, 2020-2033
- Vietnam Iron and Steel Market Outlook, by End Use, 2020-2033
- Indonesia Iron and Steel Market Outlook, by Production Route, 2020-2033
- Indonesia Iron and Steel Market Outlook, by Product Form, 2020-2033
- Indonesia Iron and Steel Market Outlook, by Steel Type, 2020-2033
- Indonesia Iron and Steel Market Outlook, by End Use, 2020-2033
- Asia Pacific Iron and Steel Market Outlook, by Production Route, Value (US$ Billion), 2020-2033
- Latin America Iron and Steel Market Outlook, 2020-2033
- Latin America Iron and Steel Market Outlook, by Production Route, Value (US$ Billion), 2020-2033
- Integrated Blast Furnace–Basic Oxygen Furnace
- Electric Arc Furnace
- Direct Reduction
- Latin America Iron and Steel Market Outlook, by Product Form, Value (US$ Billion), 2020-2033
- Flat Products
- Long Products
- Tubular Products
- Semi-Finished Products
- Latin America Iron and Steel Market Outlook, by Steel Type, Value (US$ Billion), 2020-2033
- Carbon Steel
- Alloy Steel
- Stainless Steel
- Tool and Other Specialty Steel
- Latin America Iron and Steel Market Outlook, by End Use, Value (US$ Billion), 2020-2033
- Construction and Infrastructure
- Automotive and Transport
- Machinery and Equipment
- Energy
- Packaging
- Consumer Goods
- Latin America Iron and Steel Market Outlook, by Country, Value (US$ Billion), 2020-2033
- Brazil Iron and Steel Market Outlook, by Production Route, 2020-2033
- Brazil Iron and Steel Market Outlook, by Product Form, 2020-2033
- Brazil Iron and Steel Market Outlook, by Steel Type, 2020-2033
- Brazil Iron and Steel Market Outlook, by End Use, 2020-2033
- Mexico Iron and Steel Market Outlook, by Production Route, 2020-2033
- Mexico Iron and Steel Market Outlook, by Product Form, 2020-2033
- Mexico Iron and Steel Market Outlook, by Steel Type, 2020-2033
- Mexico Iron and Steel Market Outlook, by End Use, 2020-2033
- Argentina Iron and Steel Market Outlook, by Production Route, 2020-2033
- Argentina Iron and Steel Market Outlook, by Product Form, 2020-2033
- Argentina Iron and Steel Market Outlook, by Steel Type, 2020-2033
- Argentina Iron and Steel Market Outlook, by End Use, 2020-2033
- Colombia Iron and Steel Market Outlook, by Production Route, 2020-2033
- Colombia Iron and Steel Market Outlook, by Product Form, 2020-2033
- Colombia Iron and Steel Market Outlook, by Steel Type, 2020-2033
- Colombia Iron and Steel Market Outlook, by End Use, 2020-2033
- Chile Iron and Steel Market Outlook, by Production Route, 2020-2033
- Chile Iron and Steel Market Outlook, by Product Form, 2020-2033
- Chile Iron and Steel Market Outlook, by Steel Type, 2020-2033
- Chile Iron and Steel Market Outlook, by End Use, 2020-2033
- Latin America Iron and Steel Market Outlook, by Production Route, Value (US$ Billion), 2020-2033
- Middle East & Africa Iron and Steel Market Outlook, 2020-2033
- Middle East & Africa Iron and Steel Market Outlook, by Production Route, Value (US$ Billion), 2020-2033
- Integrated Blast Furnace–Basic Oxygen Furnace
- Electric Arc Furnace
- Direct Reduction
- Middle East & Africa Iron and Steel Market Outlook, by Product Form, Value (US$ Billion), 2020-2033
- Flat Products
- Long Products
- Tubular Products
- Semi-Finished Products
- Middle East & Africa Iron and Steel Market Outlook, by Steel Type, Value (US$ Billion), 2020-2033
- Carbon Steel
- Alloy Steel
- Stainless Steel
- Tool and Other Specialty Steel
- Middle East & Africa Iron and Steel Market Outlook, by End Use, Value (US$ Billion), 2020-2033
- Construction and Infrastructure
- Automotive and Transport
- Machinery and Equipment
- Energy
- Packaging
- Consumer Goods
- Middle East & Africa Iron and Steel Market Outlook, by Country, Value (US$ Billion), 2020-2033
- Saudi Arabia Iron and Steel Market Outlook, by Production Route, 2020-2033
- Saudi Arabia Iron and Steel Market Outlook, by Product Form, 2020-2033
- Saudi Arabia Iron and Steel Market Outlook, by Steel Type, 2020-2033
- Saudi Arabia Iron and Steel Market Outlook, by End Use, 2020-2033
- United Arab Emirates Iron and Steel Market Outlook, by Production Route, 2020-2033
- United Arab Emirates Iron and Steel Market Outlook, by Product Form, 2020-2033
- United Arab Emirates Iron and Steel Market Outlook, by Steel Type, 2020-2033
- United Arab Emirates Iron and Steel Market Outlook, by End Use, 2020-2033
- Egypt Iron and Steel Market Outlook, by Production Route, 2020-2033
- Egypt Iron and Steel Market Outlook, by Product Form, 2020-2033
- Egypt Iron and Steel Market Outlook, by Steel Type, 2020-2033
- Egypt Iron and Steel Market Outlook, by End Use, 2020-2033
- Qatar Iron and Steel Market Outlook, by Production Route, 2020-2033
- Qatar Iron and Steel Market Outlook, by Product Form, 2020-2033
- Qatar Iron and Steel Market Outlook, by Steel Type, 2020-2033
- Qatar Iron and Steel Market Outlook, by End Use, 2020-2033
- Algeria Iron and Steel Market Outlook, by Production Route, 2020-2033
- Algeria Iron and Steel Market Outlook, by Product Form, 2020-2033
- Algeria Iron and Steel Market Outlook, by Steel Type, 2020-2033
- Algeria Iron and Steel Market Outlook, by End Use, 2020-2033
- Morocco Iron and Steel Market Outlook, by Production Route, 2020-2033
- Morocco Iron and Steel Market Outlook, by Product Form, 2020-2033
- Morocco Iron and Steel Market Outlook, by Steel Type, 2020-2033
- Morocco Iron and Steel Market Outlook, by End Use, 2020-2033
- South Africa Iron and Steel Market Outlook, by Production Route, 2020-2033
- South Africa Iron and Steel Market Outlook, by Product Form, 2020-2033
- South Africa Iron and Steel Market Outlook, by Steel Type, 2020-2033
- South Africa Iron and Steel Market Outlook, by End Use, 2020-2033
- Middle East & Africa Iron and Steel Market Outlook, by Production Route, Value (US$ Billion), 2020-2033
- Competitive Landscape
- Industry Leaders
- Recent Industry Developments
- Company Profiles
- China Baowu Steel Group
- ArcelorMittal
- Nippon Steel Corporation
- HBIS Group
- POSCO Holdings
- Shagang Group
- Ansteel Group Corporation
- Tata Steel Limited
- JFE Steel Corporation
- Nucor Corporation
- Hyundai Steel Company
- JSW Steel Limited
- Cleveland-Cliffs Inc.
- Steel Authority of India Limited
- Appendix
- Research Methodology
- Report Assumptions
- Acronyms and Abbreviations
Production Route
- Integrated Blast Furnace–Basic Oxygen Furnace
- Electric Arc Furnace
- Direct Reduction
Product Form
- Flat Products
- Long Products
- Tubular Products
- Semi-Finished Products
Steel Type
- Carbon Steel
- Alloy Steel
- Stainless Steel
- Tool and Other Specialty Steel
End Use
- Construction and Infrastructure
- Automotive and Transport
- Machinery and Equipment
- Energy
- Packaging
- Consumer Goods
Regions
- North America
- Europe
- Asia Pacific
- Latin America
- Middle East & Africa
Our Research Methodology
Considering the volatility of business today, traditional approaches to strategizing a game plan can be unfruitful if not detrimental. True ambiguity is no way to determine a forecast. A myriad of predetermined factors must be accounted for such as the degree of risk involved, the magnitude of circumstances, as well as conditions or consequences that are not known or unpredictable. To circumvent binary views that cast uncertainty, the application of market research intelligence to strategically posture, move, and enable actionable outcomes is necessary.
View Methodology
Quality Assured
Rigorous Validation Process

Confidentiality Assured
End-to-end Data Security

Custom Research Services
Tailored To Your Objectives
FAQs
The iron and steel market is valued at US$ 1,720.0 billion in 2026, making it the largest industrial commodity market measured by traded value worldwide.
The market is projected to reach US$ 2,060.0 billion by 2033, growing at a 2.6% CAGR and adding US$ 340.0 billion in absolute opportunity.
The integrated Blast Furnace–Basic Oxygen Furnace route leads with 68% share in 2026, because it produces high-quality flat steel at the lowest cash cost.
Energy grows fastest at a 4.5% CAGR through 2033, driven by pipelines, transmission towers, substations and offshore wind foundations worldwide.
Asia Pacific holds 68% share in 2026, reflecting concentrated steelmaking capacity and the manufacturing base that consumes most of its output.
Related Reports
Aluminum Casting Market Size, Share, Insights, Competitive Landscape, and Forecast 2026 to 2033
The global aluminum casting market is valued at US$110.50 billion in 2026, reaching US$151.90 billion by 2033, growing at a 4.7% CAGR
Copper Wire & Cable Market Size, Share, Insights, Competitive Landscape, and Forecast 2026 to 2033
Copper wire and cable market to reach US$ 352.62 billion by 2033 at an 8.6% CAGR. Explore voltage, installation and regional trends.
Ni-based Superalloys Market Size, Share, Insights, Competitive Landscape, and Forecast 2026 to 2033
Ni-based superalloys market rises from US$10.35Bn in 2026 to US$18.92Bn by 2033 at 9.0% CAGR. Explore trends, segments and key companies.
Expanded Metal Foils Market Size, Share, Insights, Competitive Landscape, and Forecast 2026 to 2033
The global expanded metal foils market is valued at US$0.5 billion in 2026, reaching US$0.9 billion by 2033, growing at an 8.8% CAGR
Zirconium Market Size, Share, Insights, Competitive Landscape, and Forecast 2026 to 2033
The global zirconium market is valued at US$4.5 billion in 2026, reaching US$6.5 billion by 2033, growing at a 5.4% CAGR
Precision Stainless Steel Market Size, Share, Insights, Competitive Landscape, and Forecast 2026 to 2033
The global precision stainless steel market is valued at US$9.8 billion in 2026, reaching US$15.7 billion by 2033, growing at a 6.96% CAGR