



Joint Reconstruction Devices Market
Joint Reconstruction Devices Market Size, Share, Insights, Competitive Landscape, and Forecast 2026 to 2033
Report Overview
Joint Reconstruction Devices Market Size and Trend Analysis
What Is the Growth Outlook for Joint Replacement Implants to 2033?
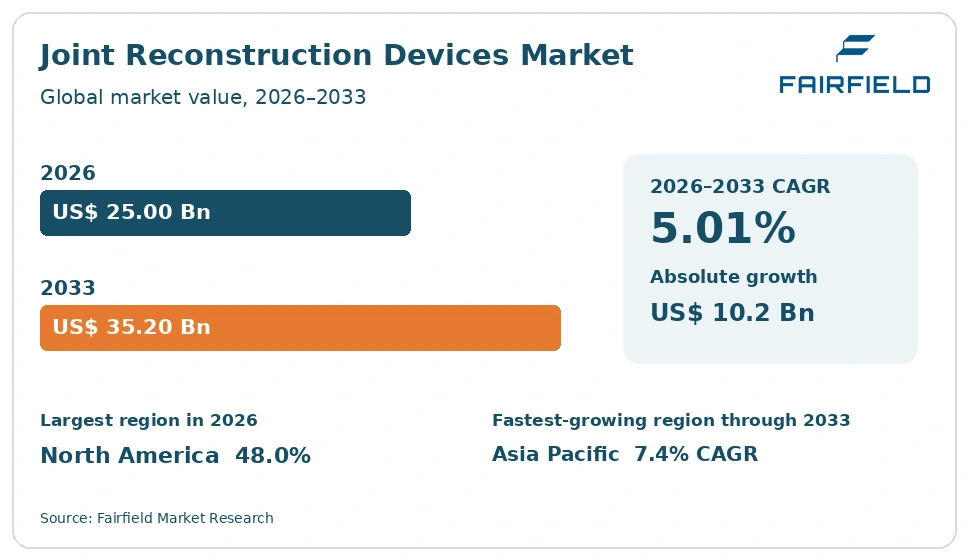
The global Joint Reconstruction Devices market size is expected to be valued at US$ 25.0 billion in 2026 and projected to reach US$ 35.2 billion by 2033, growing at a CAGR of 5.01% between 2026 and 2033.
Between 2020 and 2025 joint replacement implant revenue grew at an estimated 5.4% CAGR, flattered by the recovery of procedures deferred in 2020. Three factors shape the forecast. Procedure volumes rise steadily with population ageing and with the migration of cases into ambulatory settings. Average selling prices fall as hospital standardisation committees, bundled payment and competitive tendering take hold, so unit growth outpaces value growth. Capital robotic and navigation placements expand the installed base that carries recurring implant demand. The direction is dependable mid single-digit expansion, with mix moving toward revision, extremities and ambulatory channels.
Key Report Takeaways
- By Application: Knee Reconstruction held 52.0% share in 2026, while Shoulder Reconstruction is projected to expand at a 7.6% CAGR through 2033, as anatomic and reverse system portfolios widen and recorded procedure counts climb.
- By Procedure Type: Primary Procedures held 81.0% share in 2026, while Revision Procedures are projected to expand at a 6.4% CAGR through 2033, reflecting the accumulating installed base of implants placed over previous decades.
- By Component: Implants held 78.0% share in 2026, while Robotic-Assisted and Navigation Systems are projected to expand at a 10.2% CAGR through 2033, as capital placement is used to secure the consumable implant stream.
- By End User: Hospitals held 74.0% share in 2026, while Ambulatory Surgery Centers are projected to expand at an 11.5% CAGR through 2033, following payment policy changes that moved total joint procedures off inpatient-only lists.
- By Region: North America held 48.0% share in 2026, while Asia Pacific is projected to expand at a 7.4% CAGR through 2033, supported by public insurance expansion in China, India and South Korea.
Global Joint Reconstruction Devices Market Trends and Insights
Drivers Impact Analysis
Two forces account for most of the forecast expansion in joint replacement implant spending.
| Driver | Impact on CAGR Forecast | Geographic Relevance | Impact Timeline |
| Population ageing and rising recorded primary joint replacement volumes | High | North America, Europe, Asia Pacific | Long term (≥4 years) |
| Robotic and navigation installed base used to secure implant pull-through | Medium | North America, Europe | Medium term (2–4 years) |
Demographic Growth in Primary Joint Replacement Volumes Underpins Implant Demand
Procedure volume is the base load of this market. The population aged over sixty-five is growing in every developed economy and in much of Asia Pacific, and national registries and hospital activity statistics record steady annual increases in primary hip and knee replacement counts. Because each case consumes a defined implant set, cement and instrumentation, volume growth converts directly into unit demand even where prices are falling.
The mechanism is capacity planning rather than clinical change. Health systems in the United Kingdom, Germany, Australia and Canada have published elective recovery and waiting list programmes that fund additional joint replacement sessions. Ambulatory migration frees inpatient capacity for further cases. Registry reporting gives commissioners the activity data they use to plan those sessions, which is why registries function here as a procurement and planning instrument as much as a surveillance one.
Robotic and Navigation Placements Secure Recurring Implant Revenue for Suppliers
Capital placement has become a route to consumable revenue. Robotic-assisted and navigation systems are frequently supplied at low or no upfront cost, or under usage-based agreements, in exchange for a multi-year commitment to the supplier’s implant range. The installed base therefore matters far more commercially than the list price of the hardware, because each placed system locks a hospital’s implant purchasing for the life of the agreement.
The mechanism is contract design. Agreements bundle the capital system, software subscriptions, disposable arrays and tracker kits, service cover and implant supply into one price per procedure, which hospital finance teams can compare against conventional instrumentation. Suppliers protect the stream by making systems compatible only with their own implant libraries. This is a commercial structure rather than a claim about what the technology does, and purchasers evaluate it on contract economics and throughput.
Restraints Impact Analysis
Two structural constraints hold back value growth in joint reconstruction devices.
| Restraint | Impact on CAGR Forecast | Geographic Relevance | Impact Timeline |
| Hospital standardisation, bundled payment and ambulatory channel price pressure | High | North America, Europe | Medium term (2–4 years) |
| Registry reporting and class III clinical evidence obligations for new designs | Medium | Europe, North America | Long term (≥4 years) |
Standardisation Committees and Bundled Payment Compress Joint Implant Selling Prices
Buying power has moved from the surgeon to the institution. Implant selection was historically a surgeon preference decision, and supplier commercial models were built around that relationship. Value-based purchasing, implant standardisation committees and episode-based bundled payment have shifted the negotiation to hospital procurement, which contracts on total cost per procedure. The result is sustained average selling price erosion in mature markets, even while unit volumes rise.
The cost sources procurement now scrutinises extend well beyond the implant. Contracts are priced to include instrument tray provision, sterile processing cycles, consignment inventory carrying cost, representative attendance and length of stay. The migration of cases to ambulatory surgery centres intensifies this, because those operators hold far less inventory, run fewer tray configurations and buy on delivered cost per case. Suppliers respond with single-use instrumentation and simplified system offerings that lower the hospital’s processing overhead.
Registry Reporting and Class III Evidence Rules Raise the Cost of New Implant Designs
Evidence obligations have made purchasers and suppliers conservative about design change. National joint registries publish implant-level reporting, and procurement bodies in several countries expect a design to carry registry presence before it is adopted at scale. A new system therefore faces a long period in which it is available but not purchasable in volume, which lengthens payback and discourages incremental innovation.
The regulatory cost compounds that. Joint implants are class III devices under the EU Medical Device Regulation, requiring notified body conformity assessment, a post-market clinical follow-up plan and a published Summary of Safety and Clinical Performance. Notified body capacity remains the practical constraint on certification timelines. In the United States, orthopaedic implants move through US Food and Drug Administration 510(k) or premarket approval routes depending on classification, with their own documentation and testing demands under ISO 21534, ISO 7206 and ISO 7207.
Market Opportunities
Ambulatory Surgery Centre Channels Open a Second Joint Reconstruction Buyer
A distinct purchasing channel has opened outside the hospital. Payment policy in the United States moved total knee and then total hip procedures off the inpatient-only list and onto the ambulatory surgical centre covered procedures list, which created buyers that did not previously exist for joint implants. These operators purchase differently, favouring compact system offerings, single-use instrumentation and predictable per-case pricing over broad implant libraries held on consignment.
Ambulatory operators, physician-owned facilities and hospital outpatient departments are the customers, and payers create the demand by setting differential payment rates. Supporting developments include single-use instrument kits that remove sterile processing from the cost base, smaller robotic and navigation platforms suited to constrained footprints, and supply agreements priced per case rather than per component. Suppliers that re-engineer their offer for this channel reach volume that hospital tendering increasingly denies them.
Revision and Extremity Caseloads Create a Higher-Value Implant Revenue Pool
Revision and extremity work is the most valuable growth pool in joint reconstruction. Revision systems carry materially higher prices than primary implants because they use augments, sleeves, longer stems and constrained bearings, and the installed base of implants placed over the past three decades keeps enlarging the eligible caseload. Shoulder, elbow, wrist, ankle and digit systems are smaller categories where competition is less intense and tender pressure is lighter.
Specialist arthroplasty centres and teaching hospitals are the customers, because revision and complex extremity work concentrates there. Demand is created by the ageing of earlier implant cohorts and by the widening availability of anatomic and reverse shoulder systems. Supporting developments include patient-specific and custom implants produced through additive manufacturing, which address defects that catalogue components cannot, and registry datasets that purchasers use when planning revision capacity.
Segment Analysis
By Application: Knee Systems Lead While Shoulder Reconstruction Expands Fastest
Knee Reconstruction held 52.0% of 2026 revenue. It leads because knee replacement is the highest-volume joint procedure in almost every developed health system, because total, partial and revision systems all sit inside the category, and because knee implant sets carry more components than most alternatives.
Shoulder Reconstruction is the fastest-growing application at a 7.6% CAGR to 2033. Anatomic and reverse system portfolios have widened considerably, registries have begun separate shoulder reporting in several countries, and recorded procedure counts are rising from a small base.
Hip Reconstruction remains the second-largest category, covering primary, revision and resurfacing systems, while Extremity Reconstruction across elbow, wrist, ankle and digits is the smallest. The business implication is that suppliers use high-volume knee and hip contracts to secure accounts, then grow margin through shoulder and extremity lines that face lighter tender pressure.
By Procedure Type: Primary Cases Dominate While Revision Work Grows Quicker
Primary Procedures accounted for 81.0% of 2026 revenue. First-time replacement is the overwhelming majority of activity, it is the volume on which hospital tenders are priced, and elective recovery programmes in several countries are funded specifically to increase it.
Revision Procedures are the fastest-growing procedure type at a 6.4% CAGR. The driver is arithmetic: millions of implants placed over the past three decades are reaching the point at which registries and commissioners plan for revision capacity, and revision constructs carry substantially higher component counts and prices.
Partial and Resurfacing Procedures form the remaining share and grow slowly. The implication for suppliers is that revision capability has become a condition of serious competition, since hospitals increasingly tender primary and revision requirements together rather than as separate contracts.
By Component: Implants Carry the Revenue While Robotic Systems Compound Fastest
Implants held 78.0% of 2026 revenue, covering femoral and tibial components, bearings, acetabular systems, glenoid and humeral components, augments and patient-specific designs. The category dominates because it is the item the hospital pays for per case. Bearing and substrate materials, governed by standards such as ISO 5834 for polyethylene, are examined in separate reports and are not priced here.
Robotic-Assisted and Navigation Systems are the fastest-growing component at a 10.2% CAGR to 2033. Growth reflects the placement model described above, in which capital hardware is supplied on terms designed to secure implant volume.
Bone Cement and Cementing Accessories and Surgical Instrumentation, both reusable and single-use, complete the mix. Single-use instrumentation is growing within that group because it removes sterile processing cost, which matters most in ambulatory settings with limited reprocessing capacity.
By End User: Hospitals Hold the Base While Ambulatory Centres Grow Fastest
Hospitals represented 74.0% of 2026 revenue. Inpatient and hospital outpatient departments retain the majority because complex, revision and higher-acuity cases remain there, and because large systems negotiate the standardisation agreements that govern implant purchasing across multiple sites.
Ambulatory Surgery Centers are the fastest-growing end user at an 11.5% CAGR. Payment policy changes that moved total knee and total hip procedures off inpatient-only lists and onto ambulatory covered procedures lists created the channel, and physician-owned facilities have invested accordingly.
Orthopedic Specialty Clinics account for the balance, handling pre-operative workup and follow-up rather than the procedure itself. The commercial implication is that suppliers must serve two buyers with very different economics: hospital value-analysis committees contracting across whole systems and many theatres, and ambulatory operators buying compact kits on delivered cost per case.
Geography Analysis
Which Region Is Leading the Joint Reconstruction Devices Market?
North America leads with 48.0% share of the joint replacement implant market in 2026 and grows at a 4.2% CAGR. The United States supplies the overwhelming majority, through the highest procedure rate per capita, broad payer coverage for elective arthroplasty and implant pricing well above other markets. Canada adds smaller volumes governed by provincial budgets and waiting list management.
Payment policy explains both the scale and the pressure. Episode-based bundled payment for hip and knee replacement pushed hospitals to negotiate on total procedure cost, and the removal of total knee and total hip procedures from inpatient-only lists opened ambulatory purchasing. Implants are regulated through US Food and Drug Administration 510(k) and premarket approval routes depending on class. The main change ahead is the continuing migration of straightforward cases into ambulatory surgery centres.
Europe Combines High Procedure Rates With a Heavy Certification Burden
Europe holds 27.0% of the 2026 market and grows at a 4.4% CAGR. Germany records the highest national arthroplasty volumes, followed by France, the United Kingdom, Italy, Spain and the Nordic countries, several of which operate the longest-established national joint registries.
Regulatory cost is the defining feature. Joint implants are class III devices under the EU Medical Device Regulation (EU) 2017/745, requiring notified body conformity assessment, post-market clinical follow-up and a published Summary of Safety and Clinical Performance. Notified body capacity is the practical constraint on certification and recertification timelines, and several smaller suppliers have narrowed their catalogues as a result. National tendering and reference pricing keep implant prices well below North America. The clearest opportunity is day-case arthroplasty pathways that relieve bed pressure.
Which Region Is Growing Fastest in the Joint Reconstruction Devices Market?
Asia Pacific is the fastest-growing geography at a 7.4% CAGR between 2026 and 2033, from 18.5% share in 2026. China generates the largest regional volume, with Japan, India, South Korea and Australia contributing substantial caseloads as public insurance coverage and hospital capacity expand in parallel.
Two local factors shape the market. Centralised volume-based procurement for hip and knee implants in the region’s largest market cut awarded prices sharply, which accelerated access while compressing value per case and favouring domestic manufacturers. Procedure rates per million population remain far below developed-market levels, so unit headroom is structural. Surgeon training capacity and the availability of sterile processing infrastructure, rather than implant supply, are the practical limits on how quickly volumes convert.
Latin America Growth Depends on Public Tenders and Private Hospital Networks
Latin America represents 3.8% of the 2026 market and grows at a 5.6% CAGR. Brazil, Mexico, Argentina, Colombia and Chile account for most arthroplasty activity, divided between private hospital networks in major cities and public systems purchasing through consolidated tenders.
Barriers are economic and administrative. Implants are largely imported and exposed to currency movements and import duties, public procurement is interrupted by budget cycles and litigation, and waiting lists for elective arthroplasty are long in several countries. Registry coverage is limited, which makes purchasers cautious about unfamiliar designs. The most meaningful change is the growth of private hospital groups and insurer-funded elective programmes, which buy predictable annual volumes and have begun adopting standardised implant formularies.
Middle East & Africa Activity Clusters in Gulf and Israeli Orthopaedic Centres
Middle East & Africa accounts for 2.7% of 2026 revenue and grows at a 5.8% CAGR, the smallest regional base. Saudi Arabia, the United Arab Emirates, Qatar, Kuwait, Israel and Turkey generate most activity, supported by national health investment in orthopaedic centres with modern theatres, sterile processing capacity and ministry tenders covering implants and instrumentation together.
Constraints are severe elsewhere. Much of sub-Saharan Africa has very limited arthroplasty capacity, few trained surgeons and little reliable sterile processing, while Egypt, Nigeria, Kenya and South Africa account for most remaining volume. Registration and tender cycles are long and prices carry import and logistics loading. The main opportunity is continued orthopaedic service build-out under Gulf Cooperation Council health strategies, which fund theatre capacity and implant contracts in the same programmes.
Competitive Landscape
The joint reconstruction devices market is highly concentrated. A small group of global manufacturers accounts for the large majority of hip and knee implant revenue, reflecting the breadth of catalogue a hospital contract requires, the capital cost of instrument trays and consignment inventory held across thousands of accounts, and the long-standing relationships built around surgeon preference. A second tier of mid-sized and specialist suppliers competes in defined niches, including extremities, custom implants and single-use instrumentation. Domestic manufacturers in China and India have built significant home-market positions, assisted by centralised procurement rules that reward local supply and scale.
The basis of competition has changed. Where surgeon familiarity once decided a case, hospital value-analysis and standardisation committees now weigh total cost per procedure, instrument tray count and processing load, consignment terms, representative coverage, robotic or navigation compatibility and supply reliability. Registry presence functions as a procurement filter rather than a marketing claim, and purchasers use it to decide which designs enter a formulary. New entrants have approached the market through single-use instrumentation, additive-manufactured custom implants, compact navigation platforms and lower-cost catalogues aimed at ambulatory operators and price-controlled systems.
Strategic activity concentrates on channel reach and installed base. Suppliers have broadened into robotics and digital planning software, placed capital systems on usage-based terms, built direct relationships with ambulatory surgery centre groups, localised manufacturing for volume-based procurement markets, and consolidated smaller extremity and custom implant specialists into larger portfolios.
Strategic direction converges on three themes: defending implant pricing as institutional purchasing tightens, growing the installed base that carries recurring volume, and lowering the total cost a hospital or ambulatory operator incurs around the implant itself.
Joint Reconstruction Devices Industry Leaders
- Zimmer Biomet Holdings, Inc.
- Stryker Corporation
- Johnson & Johnson MedTech (DePuy Synthes)
- Smith & Nephew plc
- Medacta International SA
Recent Industry Developments
- April 2016: The Centers for Medicare & Medicaid Services launched the Comprehensive Care for Joint Replacement model in the United States – it made hospitals accountable for the cost of an entire hip or knee replacement episode and accelerated implant standardisation.
- January 2018: Total knee arthroplasty was removed from the Medicare inpatient-only list – it allowed the procedure to be paid for in hospital outpatient settings and began the shift of elective arthroplasty out of inpatient wards.
- January 2020: Total hip arthroplasty was removed from the inpatient-only list and total knee arthroplasty was added to the Medicare ambulatory surgical centre covered procedures list – it created a purchasing channel outside the hospital.
- January 2021: Total hip arthroplasty was added to the Medicare ambulatory surgical centre covered procedures list – it completed the policy opening of the ambulatory channel for both major joints.
- May 2021: The EU Medical Device Regulation (EU) 2017/745 became applicable across the European Union – it confirmed class III status for joint implants and imposed post-market clinical follow-up and Summary of Safety and Clinical Performance obligations.
Companies Covered in the Report
- Zimmer Biomet Holdings, Inc.
- Stryker Corporation
- Johnson & Johnson MedTech (DePuy Synthes)
- Smith & Nephew plc
- Medacta International SA
- B. Braun Melsungen AG
- Enovis Corporation
- Exactech, Inc.
- Corin Group
- Waldemar Link GmbH & Co. KG
- MicroPort Scientific Corporation
- Kyocera Corporation
- Meril Life Sciences Pvt. Ltd.
Joint Reconstruction Devices Market Report Scope
This report covers implants and instruments used to replace or resurface joints: knee, hip, shoulder and extremity systems, bone cement and cementing accessories, single-use and reusable instrumentation, patient-specific implants, and robotic and navigation systems sold into the procedure. The implant materials themselves are examined in separate reports. Spinal implants, trauma fixation and sports medicine soft-tissue repair are not counted. Base year 2025; forecast 2026 to 2033 in US$ Billion.
| Application | Knee Reconstruction, Hip Reconstruction, Shoulder Reconstruction, Extremity Reconstruction |
| Procedure Type | Primary Procedures, Revision Procedures, Partial and Resurfacing Procedures |
| Component | Implants, Bone Cement and Cementing Accessories, Surgical Instrumentation, Robotic-Assisted and Navigation Systems |
| End User | Hospitals, Ambulatory Surgery Centers, Orthopedic Specialty Clinics |
| Regions | North America, Europe, Asia Pacific, Latin America, Middle East & Africa |
1. Executive Summary
1.1 Global Joint Reconstruction Devices Market Snapshot
1.2 Future Projections, 2026-2033
1.3 Key Market Trends
1.4 Regional Snapshot
2. Market Overview
2.1 Market Definition and Report Scope
2.2 Historical Market Trends
2.3 Market Dynamics
2.3.1 Drivers Impact Analysis
2.3.1.1 Demographic Growth in Primary Joint Replacement Volumes Underpins Implant Demand
2.3.1.2 Robotic and Navigation Placements Secure Recurring Implant Revenue for Suppliers
2.3.2 Restraints Impact Analysis
2.3.2.1 Standardisation Committees and Bundled Payment Compress Joint Implant Selling Prices
2.3.2.2 Registry Reporting and Class III Evidence Rules Raise the Cost of New Implant Designs
2.3.3 Market Opportunities
2.3.3.1 Ambulatory Surgery Centre Channels Open a Second Joint Reconstruction Buyer
2.3.3.2 Revision and Extremity Caseloads Create a Higher-Value Implant Revenue Pool
3. Global Joint Reconstruction Devices Market Outlook, 2020-2033
3.1 Global Joint Reconstruction Devices Market Outlook, by Application, Value (US$ Billion), 2020-2033
3.1.1 Knee Reconstruction
3.1.2 Hip Reconstruction
3.1.3 Shoulder Reconstruction
3.1.4 Extremity Reconstruction
3.2 Global Joint Reconstruction Devices Market Outlook, by Procedure Type, Value (US$ Billion), 2020-2033
3.2.1 Primary Procedures
3.2.2 Revision Procedures
3.2.3 Partial and Resurfacing Procedures
3.3 Global Joint Reconstruction Devices Market Outlook, by Component, Value (US$ Billion), 2020-2033
3.3.1 Implants
3.3.2 Bone Cement and Cementing Accessories
3.3.3 Surgical Instrumentation
3.3.4 Robotic-Assisted and Navigation Systems
3.4 Global Joint Reconstruction Devices Market Outlook, by End User, Value (US$ Billion), 2020-2033
3.4.1 Hospitals
3.4.2 Ambulatory Surgery Centers
3.4.3 Orthopedic Specialty Clinics
3.5 Global Joint Reconstruction Devices Market Outlook, by Region, Value (US$ Billion), 2020-2033
3.5.1 North America
3.5.2 Europe
3.5.3 Asia Pacific
3.5.4 Latin America
3.5.5 Middle East & Africa
4. North America Joint Reconstruction Devices Market Outlook, 2020-2033
4.1 North America Joint Reconstruction Devices Market Outlook, by Application, Value (US$ Billion), 2020-2033
4.1.1 Knee Reconstruction
4.1.2 Hip Reconstruction
4.1.3 Shoulder Reconstruction
4.1.4 Extremity Reconstruction
4.2 North America Joint Reconstruction Devices Market Outlook, by Procedure Type, Value (US$ Billion), 2020-2033
4.2.1 Primary Procedures
4.2.2 Revision Procedures
4.2.3 Partial and Resurfacing Procedures
4.3 North America Joint Reconstruction Devices Market Outlook, by Component, Value (US$ Billion), 2020-2033
4.3.1 Implants
4.3.2 Bone Cement and Cementing Accessories
4.3.3 Surgical Instrumentation
4.3.4 Robotic-Assisted and Navigation Systems
4.4 North America Joint Reconstruction Devices Market Outlook, by End User, Value (US$ Billion), 2020-2033
4.4.1 Hospitals
4.4.2 Ambulatory Surgery Centers
4.4.3 Orthopedic Specialty Clinics
4.5 North America Joint Reconstruction Devices Market Outlook, by Country, Value (US$ Billion), 2020-2033
4.5.1 United States Joint Reconstruction Devices Market Outlook, by Application, 2020-2033
4.5.2 United States Joint Reconstruction Devices Market Outlook, by Procedure Type, 2020-2033
4.5.3 United States Joint Reconstruction Devices Market Outlook, by Component, 2020-2033
4.5.4 United States Joint Reconstruction Devices Market Outlook, by End User, 2020-2033
4.5.5 Canada Joint Reconstruction Devices Market Outlook, by Application, 2020-2033
4.5.6 Canada Joint Reconstruction Devices Market Outlook, by Procedure Type, 2020-2033
4.5.7 Canada Joint Reconstruction Devices Market Outlook, by Component, 2020-2033
4.5.8 Canada Joint Reconstruction Devices Market Outlook, by End User, 2020-2033
5. Europe Joint Reconstruction Devices Market Outlook, 2020-2033
5.1 Europe Joint Reconstruction Devices Market Outlook, by Application, Value (US$ Billion), 2020-2033
5.1.1 Knee Reconstruction
5.1.2 Hip Reconstruction
5.1.3 Shoulder Reconstruction
5.1.4 Extremity Reconstruction
5.2 Europe Joint Reconstruction Devices Market Outlook, by Procedure Type, Value (US$ Billion), 2020-2033
5.2.1 Primary Procedures
5.2.2 Revision Procedures
5.2.3 Partial and Resurfacing Procedures
5.3 Europe Joint Reconstruction Devices Market Outlook, by Component, Value (US$ Billion), 2020-2033
5.3.1 Implants
5.3.2 Bone Cement and Cementing Accessories
5.3.3 Surgical Instrumentation
5.3.4 Robotic-Assisted and Navigation Systems
5.4 Europe Joint Reconstruction Devices Market Outlook, by End User, Value (US$ Billion), 2020-2033
5.4.1 Hospitals
5.4.2 Ambulatory Surgery Centers
5.4.3 Orthopedic Specialty Clinics
5.5 Europe Joint Reconstruction Devices Market Outlook, by Country and Subregion, Value (US$ Billion), 2020-2033
5.5.1 Germany Joint Reconstruction Devices Market Outlook, by Application, 2020-2033
5.5.2 Germany Joint Reconstruction Devices Market Outlook, by Procedure Type, 2020-2033
5.5.3 Germany Joint Reconstruction Devices Market Outlook, by Component, 2020-2033
5.5.4 Germany Joint Reconstruction Devices Market Outlook, by End User, 2020-2033
5.5.5 France Joint Reconstruction Devices Market Outlook, by Application, 2020-2033
5.5.6 France Joint Reconstruction Devices Market Outlook, by Procedure Type, 2020-2033
5.5.7 France Joint Reconstruction Devices Market Outlook, by Component, 2020-2033
5.5.8 France Joint Reconstruction Devices Market Outlook, by End User, 2020-2033
5.5.9 United Kingdom Joint Reconstruction Devices Market Outlook, by Application, 2020-2033
5.5.10 United Kingdom Joint Reconstruction Devices Market Outlook, by Procedure Type, 2020-2033
5.5.11 United Kingdom Joint Reconstruction Devices Market Outlook, by Component, 2020-2033
5.5.12 United Kingdom Joint Reconstruction Devices Market Outlook, by End User, 2020-2033
5.5.13 Italy Joint Reconstruction Devices Market Outlook, by Application, 2020-2033
5.5.14 Italy Joint Reconstruction Devices Market Outlook, by Procedure Type, 2020-2033
5.5.15 Italy Joint Reconstruction Devices Market Outlook, by Component, 2020-2033
5.5.16 Italy Joint Reconstruction Devices Market Outlook, by End User, 2020-2033
5.5.17 Spain Joint Reconstruction Devices Market Outlook, by Application, 2020-2033
5.5.18 Spain Joint Reconstruction Devices Market Outlook, by Procedure Type, 2020-2033
5.5.19 Spain Joint Reconstruction Devices Market Outlook, by Component, 2020-2033
5.5.20 Spain Joint Reconstruction Devices Market Outlook, by End User, 2020-2033
5.5.21 Nordic countries Joint Reconstruction Devices Market Outlook, by Application, 2020-2033
5.5.22 Nordic countries Joint Reconstruction Devices Market Outlook, by Procedure Type, 2020-2033
5.5.23 Nordic countries Joint Reconstruction Devices Market Outlook, by Component, 2020-2033
5.5.24 Nordic countries Joint Reconstruction Devices Market Outlook, by End User, 2020-2033
6. Asia Pacific Joint Reconstruction Devices Market Outlook, 2020-2033
6.1 Asia Pacific Joint Reconstruction Devices Market Outlook, by Application, Value (US$ Billion), 2020-2033
6.1.1 Knee Reconstruction
6.1.2 Hip Reconstruction
6.1.3 Shoulder Reconstruction
6.1.4 Extremity Reconstruction
6.2 Asia Pacific Joint Reconstruction Devices Market Outlook, by Procedure Type, Value (US$ Billion), 2020-2033
6.2.1 Primary Procedures
6.2.2 Revision Procedures
6.2.3 Partial and Resurfacing Procedures
6.3 Asia Pacific Joint Reconstruction Devices Market Outlook, by Component, Value (US$ Billion), 2020-2033
6.3.1 Implants
6.3.2 Bone Cement and Cementing Accessories
6.3.3 Surgical Instrumentation
6.3.4 Robotic-Assisted and Navigation Systems
6.4 Asia Pacific Joint Reconstruction Devices Market Outlook, by End User, Value (US$ Billion), 2020-2033
6.4.1 Hospitals
6.4.2 Ambulatory Surgery Centers
6.4.3 Orthopedic Specialty Clinics
6.5 Asia Pacific Joint Reconstruction Devices Market Outlook, by Country, Value (US$ Billion), 2020-2033
6.5.1 China Joint Reconstruction Devices Market Outlook, by Application, 2020-2033
6.5.2 China Joint Reconstruction Devices Market Outlook, by Procedure Type, 2020-2033
6.5.3 China Joint Reconstruction Devices Market Outlook, by Component, 2020-2033
6.5.4 China Joint Reconstruction Devices Market Outlook, by End User, 2020-2033
6.5.5 Japan Joint Reconstruction Devices Market Outlook, by Application, 2020-2033
6.5.6 Japan Joint Reconstruction Devices Market Outlook, by Procedure Type, 2020-2033
6.5.7 Japan Joint Reconstruction Devices Market Outlook, by Component, 2020-2033
6.5.8 Japan Joint Reconstruction Devices Market Outlook, by End User, 2020-2033
6.5.9 India Joint Reconstruction Devices Market Outlook, by Application, 2020-2033
6.5.10 India Joint Reconstruction Devices Market Outlook, by Procedure Type, 2020-2033
6.5.11 India Joint Reconstruction Devices Market Outlook, by Component, 2020-2033
6.5.12 India Joint Reconstruction Devices Market Outlook, by End User, 2020-2033
6.5.13 South Korea Joint Reconstruction Devices Market Outlook, by Application, 2020-2033
6.5.14 South Korea Joint Reconstruction Devices Market Outlook, by Procedure Type, 2020-2033
6.5.15 South Korea Joint Reconstruction Devices Market Outlook, by Component, 2020-2033
6.5.16 South Korea Joint Reconstruction Devices Market Outlook, by End User, 2020-2033
6.5.17 Australia Joint Reconstruction Devices Market Outlook, by Application, 2020-2033
6.5.18 Australia Joint Reconstruction Devices Market Outlook, by Procedure Type, 2020-2033
6.5.19 Australia Joint Reconstruction Devices Market Outlook, by Component, 2020-2033
6.5.20 Australia Joint Reconstruction Devices Market Outlook, by End User, 2020-2033
7. Latin America Joint Reconstruction Devices Market Outlook, 2020-2033
7.1 Latin America Joint Reconstruction Devices Market Outlook, by Application, Value (US$ Billion), 2020-2033
7.1.1 Knee Reconstruction
7.1.2 Hip Reconstruction
7.1.3 Shoulder Reconstruction
7.1.4 Extremity Reconstruction
7.2 Latin America Joint Reconstruction Devices Market Outlook, by Procedure Type, Value (US$ Billion), 2020-2033
7.2.1 Primary Procedures
7.2.2 Revision Procedures
7.2.3 Partial and Resurfacing Procedures
7.3 Latin America Joint Reconstruction Devices Market Outlook, by Component, Value (US$ Billion), 2020-2033
7.3.1 Implants
7.3.2 Bone Cement and Cementing Accessories
7.3.3 Surgical Instrumentation
7.3.4 Robotic-Assisted and Navigation Systems
7.4 Latin America Joint Reconstruction Devices Market Outlook, by End User, Value (US$ Billion), 2020-2033
7.4.1 Hospitals
7.4.2 Ambulatory Surgery Centers
7.4.3 Orthopedic Specialty Clinics
7.5 Latin America Joint Reconstruction Devices Market Outlook, by Country, Value (US$ Billion), 2020-2033
7.5.1 Brazil Joint Reconstruction Devices Market Outlook, by Application, 2020-2033
7.5.2 Brazil Joint Reconstruction Devices Market Outlook, by Procedure Type, 2020-2033
7.5.3 Brazil Joint Reconstruction Devices Market Outlook, by Component, 2020-2033
7.5.4 Brazil Joint Reconstruction Devices Market Outlook, by End User, 2020-2033
7.5.5 Mexico Joint Reconstruction Devices Market Outlook, by Application, 2020-2033
7.5.6 Mexico Joint Reconstruction Devices Market Outlook, by Procedure Type, 2020-2033
7.5.7 Mexico Joint Reconstruction Devices Market Outlook, by Component, 2020-2033
7.5.8 Mexico Joint Reconstruction Devices Market Outlook, by End User, 2020-2033
7.5.9 Argentina Joint Reconstruction Devices Market Outlook, by Application, 2020-2033
7.5.10 Argentina Joint Reconstruction Devices Market Outlook, by Procedure Type, 2020-2033
7.5.11 Argentina Joint Reconstruction Devices Market Outlook, by Component, 2020-2033
7.5.12 Argentina Joint Reconstruction Devices Market Outlook, by End User, 2020-2033
7.5.13 Colombia Joint Reconstruction Devices Market Outlook, by Application, 2020-2033
7.5.14 Colombia Joint Reconstruction Devices Market Outlook, by Procedure Type, 2020-2033
7.5.15 Colombia Joint Reconstruction Devices Market Outlook, by Component, 2020-2033
7.5.16 Colombia Joint Reconstruction Devices Market Outlook, by End User, 2020-2033
7.5.17 Chile Joint Reconstruction Devices Market Outlook, by Application, 2020-2033
7.5.18 Chile Joint Reconstruction Devices Market Outlook, by Procedure Type, 2020-2033
7.5.19 Chile Joint Reconstruction Devices Market Outlook, by Component, 2020-2033
7.5.20 Chile Joint Reconstruction Devices Market Outlook, by End User, 2020-2033
8. Middle East & Africa Joint Reconstruction Devices Market Outlook, 2020-2033
8.1 Middle East & Africa Joint Reconstruction Devices Market Outlook, by Application, Value (US$ Billion), 2020-2033
8.1.1 Knee Reconstruction
8.1.2 Hip Reconstruction
8.1.3 Shoulder Reconstruction
8.1.4 Extremity Reconstruction
8.2 Middle East & Africa Joint Reconstruction Devices Market Outlook, by Procedure Type, Value (US$ Billion), 2020-2033
8.2.1 Primary Procedures
8.2.2 Revision Procedures
8.2.3 Partial and Resurfacing Procedures
8.3 Middle East & Africa Joint Reconstruction Devices Market Outlook, by Component, Value (US$ Billion), 2020-2033
8.3.1 Implants
8.3.2 Bone Cement and Cementing Accessories
8.3.3 Surgical Instrumentation
8.3.4 Robotic-Assisted and Navigation Systems
8.4 Middle East & Africa Joint Reconstruction Devices Market Outlook, by End User, Value (US$ Billion), 2020-2033
8.4.1 Hospitals
8.4.2 Ambulatory Surgery Centers
8.4.3 Orthopedic Specialty Clinics
8.5 Middle East & Africa Joint Reconstruction Devices Market Outlook, by Country and Subregion, Value (US$ Billion), 2020-2033
8.5.1 Saudi Arabia Joint Reconstruction Devices Market Outlook, by Application, 2020-2033
8.5.2 Saudi Arabia Joint Reconstruction Devices Market Outlook, by Procedure Type, 2020-2033
8.5.3 Saudi Arabia Joint Reconstruction Devices Market Outlook, by Component, 2020-2033
8.5.4 Saudi Arabia Joint Reconstruction Devices Market Outlook, by End User, 2020-2033
8.5.5 United Arab Emirates Joint Reconstruction Devices Market Outlook, by Application, 2020-2033
8.5.6 United Arab Emirates Joint Reconstruction Devices Market Outlook, by Procedure Type, 2020-2033
8.5.7 United Arab Emirates Joint Reconstruction Devices Market Outlook, by Component, 2020-2033
8.5.8 United Arab Emirates Joint Reconstruction Devices Market Outlook, by End User, 2020-2033
8.5.9 Qatar Joint Reconstruction Devices Market Outlook, by Application, 2020-2033
8.5.10 Qatar Joint Reconstruction Devices Market Outlook, by Procedure Type, 2020-2033
8.5.11 Qatar Joint Reconstruction Devices Market Outlook, by Component, 2020-2033
8.5.12 Qatar Joint Reconstruction Devices Market Outlook, by End User, 2020-2033
8.5.13 Kuwait Joint Reconstruction Devices Market Outlook, by Application, 2020-2033
8.5.14 Kuwait Joint Reconstruction Devices Market Outlook, by Procedure Type, 2020-2033
8.5.15 Kuwait Joint Reconstruction Devices Market Outlook, by Component, 2020-2033
8.5.16 Kuwait Joint Reconstruction Devices Market Outlook, by End User, 2020-2033
8.5.17 Israel Joint Reconstruction Devices Market Outlook, by Application, 2020-2033
8.5.18 Israel Joint Reconstruction Devices Market Outlook, by Procedure Type, 2020-2033
8.5.19 Israel Joint Reconstruction Devices Market Outlook, by Component, 2020-2033
8.5.20 Israel Joint Reconstruction Devices Market Outlook, by End User, 2020-2033
8.5.21 Turkey Joint Reconstruction Devices Market Outlook, by Application, 2020-2033
8.5.22 Turkey Joint Reconstruction Devices Market Outlook, by Procedure Type, 2020-2033
8.5.23 Turkey Joint Reconstruction Devices Market Outlook, by Component, 2020-2033
8.5.24 Turkey Joint Reconstruction Devices Market Outlook, by End User, 2020-2033
8.5.25 Egypt Joint Reconstruction Devices Market Outlook, by Application, 2020-2033
8.5.26 Egypt Joint Reconstruction Devices Market Outlook, by Procedure Type, 2020-2033
8.5.27 Egypt Joint Reconstruction Devices Market Outlook, by Component, 2020-2033
8.5.28 Egypt Joint Reconstruction Devices Market Outlook, by End User, 2020-2033
8.5.29 Nigeria Joint Reconstruction Devices Market Outlook, by Application, 2020-2033
8.5.30 Nigeria Joint Reconstruction Devices Market Outlook, by Procedure Type, 2020-2033
8.5.31 Nigeria Joint Reconstruction Devices Market Outlook, by Component, 2020-2033
8.5.32 Nigeria Joint Reconstruction Devices Market Outlook, by End User, 2020-2033
8.5.33 Kenya Joint Reconstruction Devices Market Outlook, by Application, 2020-2033
8.5.34 Kenya Joint Reconstruction Devices Market Outlook, by Procedure Type, 2020-2033
8.5.35 Kenya Joint Reconstruction Devices Market Outlook, by Component, 2020-2033
8.5.36 Kenya Joint Reconstruction Devices Market Outlook, by End User, 2020-2033
8.5.37 South Africa Joint Reconstruction Devices Market Outlook, by Application, 2020-2033
8.5.38 South Africa Joint Reconstruction Devices Market Outlook, by Procedure Type, 2020-2033
8.5.39 South Africa Joint Reconstruction Devices Market Outlook, by Component, 2020-2033
8.5.40 South Africa Joint Reconstruction Devices Market Outlook, by End User, 2020-2033
8.5.41 Gulf Cooperation Council Joint Reconstruction Devices Market Outlook, by Application, 2020-2033
8.5.42 Gulf Cooperation Council Joint Reconstruction Devices Market Outlook, by Procedure Type, 2020-2033
8.5.43 Gulf Cooperation Council Joint Reconstruction Devices Market Outlook, by Component, 2020-2033
8.5.44 Gulf Cooperation Council Joint Reconstruction Devices Market Outlook, by End User, 2020-2033
9. Competitive Landscape
9.1 Industry Leaders
9.2 Recent Industry Developments
9.3 Company Profiles
9.3.1 Zimmer Biomet Holdings, Inc.
9.3.2 Stryker Corporation
9.3.3 Johnson & Johnson MedTech (DePuy Synthes)
9.3.4 Smith & Nephew plc
9.3.5 Medacta International SA
9.3.6 B. Braun Melsungen AG
9.3.7 Enovis Corporation
9.3.8 Exactech, Inc.
9.3.9 Corin Group
9.3.10 Waldemar Link GmbH & Co. KG
9.3.11 MicroPort Scientific Corporation
9.3.12 Kyocera Corporation
9.3.13 Meril Life Sciences Pvt. Ltd.
10. Appendix
10.1 Research Methodology
10.2 Report Assumptions
10.3 Acronyms and Abbreviations
| Application | Knee Reconstruction, Hip Reconstruction, Shoulder Reconstruction, Extremity Reconstruction |
| Procedure Type | Primary Procedures, Revision Procedures, Partial and Resurfacing Procedures |
| Component | Implants, Bone Cement and Cementing Accessories, Surgical Instrumentation, Robotic-Assisted and Navigation Systems |
| End User | Hospitals, Ambulatory Surgery Centers, Orthopedic Specialty Clinics |
| Regions | North America, Europe, Asia Pacific, Latin America, Middle East & Africa |
Our Research Methodology
Considering the volatility of business today, traditional approaches to strategizing a game plan can be unfruitful if not detrimental. True ambiguity is no way to determine a forecast. A myriad of predetermined factors must be accounted for such as the degree of risk involved, the magnitude of circumstances, as well as conditions or consequences that are not known or unpredictable. To circumvent binary views that cast uncertainty, the application of market research intelligence to strategically posture, move, and enable actionable outcomes is necessary.
View Methodology
Quality Assured
Rigorous Validation Process

Confidentiality Assured
End-to-end Data Security

Custom Research Services
Tailored To Your Objectives
FAQs
The market is valued at US$ 25.0 billion in 2026, covering knee, hip, shoulder and extremity implants with their cement, instrumentation and robotic systems.
Revenue is projected to reach US$ 35.2 billion by 2033 at a 5.01% CAGR, an absolute dollar opportunity of US$ 10.2 billion.
Knee Reconstruction leads with 52.0% share in 2026, reflecting the highest procedure volumes and the broadest component count per implant set.
Ambulatory Surgery Centers grow fastest at an 11.5% CAGR through 2033, following payment policy that moved total joint procedures off inpatient-only lists.
North America leads with 48.0% share in 2026, and concentration is high, with a small group of global suppliers holding most implant revenue.
Related Reports
Medical Fiber Optics Market Size, Share, Insights, Competitive Landscape, and Forecast 2026 to 2033
The medical fiber optics market is projected to grow from US$1.4 billion in 2026 to US$1.9 billion by 2033 at a 4.5% CAGR.
Laser Hair Removal Market Size, Share, Insights, Competitive Landscape, and Forecast 2026 to 2033
The laser hair removal market is projected to reach US$4.5 billion by 2033. Explore diode and multi-wavelength devices, clinic demand, and regional growth.
Interventional Cardiology Devices Market Size, Share, Insights, Competitive Landscape, and Forecast 2026 to 2033
The global interventional cardiology devices market is valued at US$18.0 billion in 2026, reaching US$26.4 billion by 2033, growing at a 5.62% CAGR
Infusion Catheter Market Size, Share, Insights, Competitive Landscape, and Forecast 2026 to 2033
The infusion catheter market is projected to reach US$4.97 billion by 2033 at a 10.1% CAGR, driven by growth in outpatient and home infusion care.
Influenza Diagnostic Market Size, Share, Insights, Competitive Landscape, and Forecast 2026 to 2033
The influenza diagnostic market is projected to reach US$3.56 billion by 2033 at a 7.8% CAGR, driven by rapid molecular tests and wider home testing.
Implantable Insulin Pumps Market Size, Share, Insights, Competitive Landscape, and Forecast 2026 to 2033
The global implantable insulin pumps market is valued at US$3.80 billion in 2026, reaching US$6.90 billion by 2033, growing at an 8.9% CAGR