



Marine Lithium-ion Battery Market
Marine Lithium-ion Battery Market Size, Share, Insights, Competitive Landscape, and Forecast 2026 to 2033
Marine Lithium-ion Battery Market Size and Trend Analysis
How Quickly Will Vessel Battery Installations Scale?
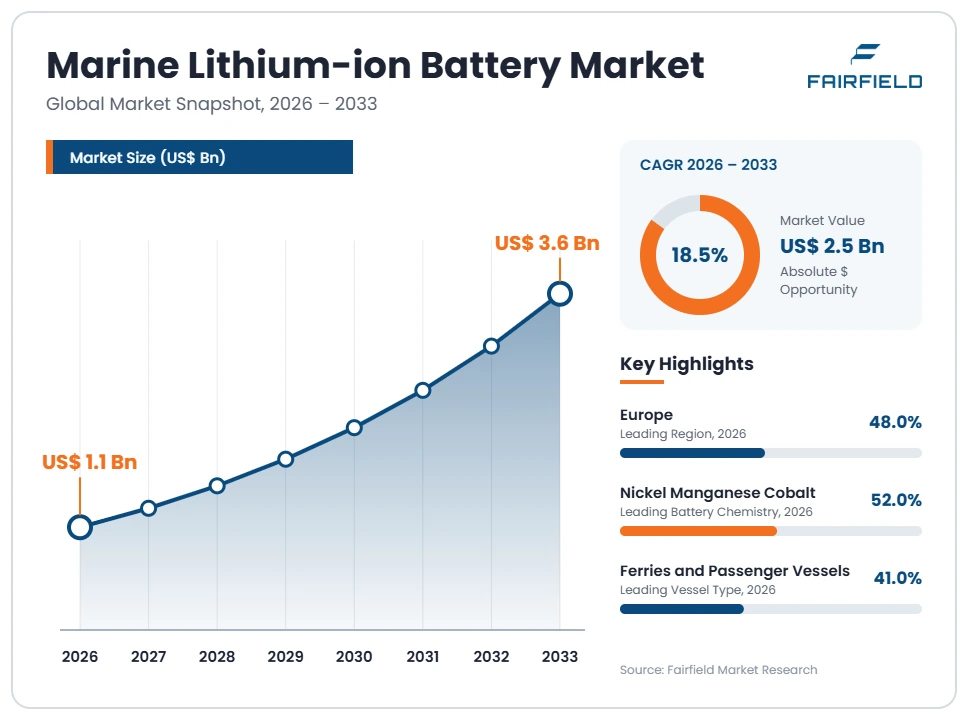
The global marine lithium-ion battery market size is expected to be valued at US$ 1.1 billion in 2026 and projected to reach US$ 3.6 billion by 2033, growing at a CAGR of 18.5% between 2026 and 2033. In precise terms, the market moves from about US$ 1,100 million to US$ 3,600 million.
Between 2020 and 2025 installed value grew at roughly 21% a year to near US$ 920 million, led by ferry electrification in Norway and hybrid retrofits on offshore vessels. Three factors carry the forecast. Carbon pricing and fuel intensity rules now attach a direct cost to burning marine fuel in regulated trades. Classification society battery notations have matured, which shortens approval for repeat designs. Harbour craft operators are finding that short, predictable duty cycles suit batteries well. Growth stays concentrated in short-sea and port operations, because energy density keeps deep-sea electrification out of reach.
Key Report Takeaways
- By Battery Chemistry: Nickel manganese cobalt cells held 52% share in 2026, while lithium iron phosphate is projected to expand at a 21.6% CAGR through 2033, driven by its stronger thermal stability during class approval.
- By Vessel Type: Ferries and passenger vessels held 41% share in 2026, while harbour craft and tugs should grow at a 22.4% CAGR, because short bollard-pull duty cycles suit battery discharge profiles.
- By Propulsion Configuration: Hybrid systems held 56% share in 2026, while fully electric configurations are forecast to rise at a 20.9% CAGR, supported by improving shore charging at ferry berths.
- By Energy Capacity: The 1,000–5,000 kWh band held 38% share in 2026, while systems above 5,000 kWh are set to advance at a 23.1% CAGR, reflecting larger ferries and offshore installations.
- By Geography: Europe held 48% share in 2026, while Asia Pacific is projected to grow at a 21.3% CAGR through 2033, led by electric inland vessels and harbour craft in China.
Global Marine Lithium-ion Battery Market Trends and Insights
Drivers Impact Analysis
Two regulatory and operational forces account for most new battery capacity ordered for vessels through 2033.
| Driver | Impact on CAGR Forecast | Geographic Relevance | Impact Timeline |
| Carbon pricing and fuel intensity limits attaching direct cost to marine fuel burn | High | Europe | Short term ≤2 years |
| Port air quality rules and at-berth emission limits on passenger vessels | High | Europe, North America | Medium term 2–4 years |
Fuel Intensity Rules and Carbon Pricing Make Hybrid Vessels Cheaper to Operate
Regulation has turned vessel batteries into a cost-avoidance purchase for operators in regulated trades. Regulation (EU) 2023/1805, known as FuelEU Maritime, sets declining limits on the greenhouse gas intensity of energy used on board, with penalties for exceeding them. The extension of the EU Emissions Trading System to shipping places a price on each tonne of carbon dioxide emitted on covered voyages. Both measures convert fuel burn into a line item with a visible unit cost.
The mechanism favours batteries because they remove the worst-efficiency operating points. Diesel generators run poorly at low load, and a battery lets the engine sit at its efficient point while the pack absorbs peaks and covers manoeuvring. Operators report meaningful fuel savings from peak shaving and spinning reserve replacement alone, which shortens payback independently of any full electrification decision.
Port Air Quality Requirements Push Passenger Vessels Toward Battery Operation
Local air quality rules at berth are the second force pulling battery systems onto ships, and they affect passenger trades first. Ports sit inside cities, and auxiliary engines running alongside produce emissions and noise directly in residential areas. FuelEU Maritime requires passenger and container ships to use zero-emission power at berth in major European Union ports from the end of the decade, which makes an onboard pack or a shore connection unavoidable for those trades.
The causal chain runs through vessel design. Meeting an at-berth requirement needs either a shore power connection with matching port infrastructure or stored energy on board, and most operators specify both for redundancy. Batteries also handle harbour manoeuvring silently, which satisfies noise limits in tourist ports. Norwegian fjord operating restrictions demonstrated how quickly local rules change vessel specifications.
Restraints Impact Analysis
Two constraints keep marine battery adoption confined to specific vessel classes and routes.
| Restraint | Impact on CAGR Forecast | Geographic Relevance | Impact Timeline |
| Thermal runaway risk and the resulting class approval and fire protection burden | High | Global | Long term ≥4 years |
| Shore charging power availability and grid capacity at berths | High | Europe, Asia Pacific | Medium term 2–4 years |
Thermal Runaway Risk Raises the Approval and Fire Protection Burden
Fire safety is the dominant constraint on marine battery installations and it shapes both cost and schedule. A thermal runaway event on a vessel cannot be escaped, so classification societies apply detailed requirements covering cell testing, propagation resistance, gas venting, deluge or suppression systems, battery room boundaries and ventilation. Battery power notations from the major class societies, together with the International Maritime Organization framework under SOLAS and its interim guidance on lithium-ion installations, govern every approval.
The underlying cause is engineering, not paperwork. Preventing propagation between cells requires physical barriers, cooling and gas management designed into the pack, and proving it demands destructive testing at cell, module and system level. Dedicated battery compartments consume payload volume. Each novel arrangement triggers a fresh risk assessment, so first-of-class vessels carry approval costs that repeat designs avoid entirely.
Shore Charging Capacity at Berths Limits Fully Electric Route Expansion
Charging infrastructure, not the battery, now sets the practical limit on fully electric vessel operation. A ferry turning around in fifteen minutes may need several megawatts of charging power, which exceeds what many quays can draw from the local distribution network. Without that connection, the route cannot be electrified regardless of pack performance, so operators default to hybrid configurations that refuel conventionally.
The cause lies in grid and port economics. Upgrading a berth means new transformers, cabling, protection equipment and often a distribution network reinforcement funded through a utility connection charge. Shoreside buffer batteries can reduce peak draw but add capital cost and space in congested port areas. Automated connection systems must also be specified for fast turnarounds, and ownership of that infrastructure is frequently disputed between port authority, operator and utility.
Market Opportunities
Harbour Craft and Tug Retrofits Open a Repeatable Short-Route Revenue Pool
Harbour craft retrofits represent the most repeatable revenue pool in marine electrification, because the vessels are numerous, similar and operate from fixed bases. Tugs, pilot boats, port workboats and crew transfer vessels run short predictable cycles with long idle periods alongside, which is close to an ideal battery duty profile. Retrofitting an existing hull avoids newbuild capital, so the addressable fleet is far larger than the annual order book for new vessels.
System integrators, shipyards with conversion capability and battery suppliers offering packaged energy storage can capture this work. Demand comes from port authorities, towage operators and offshore wind service companies facing local emission limits. Standardised modular packs reduce engineering cost per vessel, and repeat approval of a proven arrangement under existing class notations removes much of the first-of-class expense.
Battery Energy Storage as a Service Creates Recurring Marine Revenue
Energy storage sold as a service rather than as equipment opens a recurring revenue pool that suits operators unwilling to fund battery capital. Under this model a provider owns the pack, guarantees its performance and availability, and charges per month or per unit of energy delivered. That structure moves replacement risk and state-of-health uncertainty away from the shipowner, which removes a common objection during vessel conversion decisions.
Battery suppliers with financing partners, leasing companies and marine integrators are positioned to offer it. Demand concentrates among smaller ferry and workboat operators who lack balance sheet capacity for a large upfront system but face emission rules on fixed routes. Standards such as IEC 62619 and UL 1973 provide the safety baseline, while measured state-of-health data lets providers price contracts and plan module replacement.
Segment Analysis
- By Battery Chemistry: Nickel Manganese Cobalt Leads as Lithium Iron Phosphate Closes In
Nickel manganese cobalt chemistry held 52% of 2026 value, the leading position, because its higher energy density packs more usable energy into the limited volume of a battery room. That advantage matters most where payload and stability calculations constrain installation space. Lithium iron phosphate is the fastest-growing chemistry at a 21.6% CAGR through 2033, as its greater thermal stability and higher runaway onset temperature simplify fire risk assessment during class approval. Lithium titanate serves high-cycle harbour applications that need rapid charging and long life, while other chemistries remain marginal. The implication is a slow rebalancing of the supply base. Falling lithium iron phosphate cell costs and easier approval are shifting new tenders toward that chemistry wherever volume and weight limits allow, especially on workboats and inland vessels.
- By Vessel Type: Ferries Dominate Installed Capacity While Harbour Craft Grow Fastest
Ferries and passenger vessels accounted for 41% of 2026 value, the largest vessel category, because fixed short routes, daily berth access and public ownership structures make electrification practical and politically supported. Norwegian and other Nordic crossings established the template. Harbour craft and tugs form the fastest-growing vessel type at a 22.4% CAGR to 2033, since bollard-pull work involves short high-power bursts separated by idling, which batteries handle efficiently. Offshore support vessels, yachts, inland waterway vessels and naval applications fill out the market, each with distinct approval paths. The business implication concerns order predictability. Ferry contracts are large, tendered and infrequent, while harbour craft orders are smaller, more numerous and more repeatable, which rewards suppliers with standardised modular products and fast delivery.
- By Propulsion Configuration: Hybrid Systems Hold the Base While Fully Electric Advances
Hybrid configurations held 56% share in 2026, the leading arrangement, because they deliver fuel and emission savings without depending on shore charging capacity or route length. A hybrid vessel keeps conventional range while using the pack for peak shaving, manoeuvring and spinning reserve replacement. Fully electric configurations are growing fastest at a 20.9% CAGR through 2033, driven by improving charging power at ferry berths and by at-berth emission requirements. Plug-in hybrids occupy middle ground, charging in port and burning fuel on longer legs. The commercial conclusion is that hybrid remains the volume business for the forecast period. Suppliers need products that serve modest peak-shaving packs as well as large traction installations, since the same customer often moves between configurations across a fleet renewal programme.
- By Energy Capacity: Mid-Size Systems Lead While the Largest Installations Scale Quickest
The 1,000–5,000 kWh band led with 38% of 2026 value, matching the typical requirement of a short-crossing electric ferry or a well-specified hybrid offshore vessel. Systems above 5,000 kWh are the fastest-growing capacity band at a 23.1% CAGR to 2033, as longer ferry routes, larger passenger vessels and high-power offshore installations enter service. The 100–1,000 kWh band serves workboats, pilot vessels and yachts, while installations up to 100 kWh cover auxiliary and small craft duties. Scale changes the engineering problem rather than simply multiplying it. Larger packs need dedicated and segregated compartments, liquid cooling circuits, far more extensive fire detection and suppression, and charging connections rated in megawatts. As a result, value per kilowatt-hour holds up better than falling cell price trends alone would suggest, and the work favours integrators with genuine system engineering depth and established class approval experience.
Geography Analysis
- North American Adoption Concentrates in Ferries, Workboats and Offshore Wind Support
North America holds 18% of 2026 revenue, led by the United States and Canada. Adoption is concentrated rather than broad, with state and provincial ferry operators in Washington, British Columbia, California and the Northeast accounting for much of the installed capacity. California harbour craft regulations have pushed commercial operators toward hybrid and electric configurations in port service, and offshore wind development on the Atlantic coast is creating demand for service vessels with battery capability. Domestic build requirements shape procurement, since qualifying vessels must be constructed in local yards, which concentrates integration expertise in a small number of shipbuilders. The main barriers are berth charging capacity and long public procurement cycles. The notable change is growing interest in battery retrofits for existing workboat fleets facing local air quality limits.
- Which Region Is Leading the Marine Lithium-ion Battery Market?
Europe leads the market with 48% share in 2026, driven overwhelmingly by Norway, with Denmark, Sweden, Finland, the Netherlands and Germany following. Norwegian ferry tenders made zero or low emission operation a scoring criterion years ago, which created the first large fleet of fully electric crossings and a supporting supply chain of integrators and charging specialists. Fjord operating restrictions on cruise and tourist traffic reinforced that direction. FuelEU Maritime and the inclusion of shipping in the EU Emissions Trading System now extend the commercial case across the whole regional fleet, not just publicly tendered routes. Dutch and German inland waterway operators are adopting containerised battery systems on canal and river vessels. The barrier is grid connection capacity at smaller quays. The opportunity lies in replacing ageing hybrid retrofits with larger, longer-life packs.
- Which Region Is Growing Fastest in the Marine Lithium-ion Battery Market?
Asia Pacific is growing fastest at a 21.3% CAGR between 2026 and 2033, from a 26% share in 2026. China supplies most of that growth, combining a very large inland waterway fleet on the Yangtze and canal systems with domestic cell manufacturing that keeps system prices low. Electric container barges, passenger craft and harbour tugs have moved into regular service there. Japan and South Korea contribute through shipbuilding capability and hybrid designs for coastal vessels, while Singapore has set targets for harbour craft operating in its port waters. Australia is adding electric passenger ferries on urban routes. The constraint is uneven class approval experience among smaller regional yards. The opportunity is export of standardised, lower-cost battery systems built on domestic cell supply to operators elsewhere.
- Latin American Activity Remains Limited to Pilot Ferries and Port Craft
Latin America accounts for 4% of 2026 revenue, the smallest share alongside one other region, with Brazil, Chile, Colombia and Panama hosting most activity. Projects are mainly demonstration ferries on urban water routes, electric passenger craft in tourism areas and a small number of hybrid port workboats. Chile benefits from strong renewable generation and policy interest in clean transport, while Brazil has extensive river passenger traffic in the Amazon basin that could suit battery operation on short legs. Barriers are substantial: capital cost in hard currency, limited shore charging infrastructure, few local integrators with class approval experience and no regional carbon pricing to improve payback. The change worth watching is development bank financing for urban water transport, which can fund the charging infrastructure that private operators cannot justify alone.
- Middle East & Africa Demand Follows Port Modernisation and Tourism Vessels
Middle East & Africa represents 4% of the market in 2026, concentrated in the United Arab Emirates, Saudi Arabia, Egypt and South Africa. Demand comes from port modernisation programmes, tourism and leisure craft in coastal developments, and a small number of hybrid offshore support vessels serving regional oil and gas fields. Gulf developments increasingly specify electric water taxis and sightseeing vessels as part of waterfront projects, where noise and local emissions matter to the visitor experience. High ambient temperatures complicate thermal management and shorten pack life, which raises cooling system specifications. Barriers include limited local service capability, cheap conventional fuel that weakens payback and few regulatory drivers. The opportunity sits in new port and waterfront construction, where charging infrastructure can be built in at design stage rather than retrofitted into congested quays.
Competitive Landscape
The market is moderately concentrated, which reflects how few suppliers hold marine type approval across several classification societies. A group of specialist marine energy storage companies, including Corvus Energy AS, Leclanché SA, EST-Floattech B.V., Echandia AB and Shift Clean Energy Inc., account for a large share of delivered systems, particularly in Europe. Around them sit large industrial suppliers such as Siemens Energy AG, Wärtsilä Corporation and Kongsberg Maritime AS, which bring complete propulsion and automation packages, and major cell manufacturers that supply the underlying cells rather than the marine system. Barriers to entry are high because approval, not manufacturing capacity, gates participation.
Competition is decided on safety evidence and integration capability more than on cell price. Buyers assess propagation test results, class notations already held, battery management software, thermal management design, service network coverage along the vessel’s route and warranted state-of-health over the contract life. Shipyards favour suppliers whose documentation package is already familiar to the attending surveyor, because that shortens the approval path. New entrants arrive from stationary storage and automotive backgrounds, and they typically partner with established marine integrators to overcome the approval barrier rather than tackling it alone.
Strategic activity concentrates on securing cell supply agreements, widening class approvals across more societies, building regional service capability near electrified ferry routes, and extending into shore charging equipment so that one supplier can deliver both sides of the energy transfer. Several suppliers are developing containerised and modular products to cut engineering cost per vessel. The prevailing direction is standardisation: moving away from bespoke first-of-class installations toward repeatable, pre-approved building blocks that shorten delivery and reduce the cost of marine certification.
Recent Industry Developments
- July 2023: The International Maritime Organization adopted its revised strategy on reduction of greenhouse gas emissions from ships, setting an ambition of net-zero emissions by or around 2050 – it gave owners a long-term signal that justified investment in battery-capable vessel designs.
- September 2023: The European Union adopted Regulation (EU) 2023/1805, the FuelEU Maritime regulation, setting declining greenhouse gas intensity limits and an at-berth zero-emission requirement for passenger and container ships – it created a direct compliance route for onboard energy storage.
- January 2024: Maritime transport entered the EU Emissions Trading System, requiring surrender of allowances for covered voyages – it attached an explicit carbon price to fuel burn and improved the payback of hybrid battery installations.
- January 2025: The greenhouse gas intensity limits under FuelEU Maritime began to apply to ships calling at European Union ports – it moved battery retrofits from a voluntary efficiency measure to a compliance planning option for short-sea operators.
Companies Covered in the Report
- Corvus Energy AS
- Leclanché SA
- EST-Floattech B.V.
- Echandia AB
- Shift Clean Energy Inc.
- Siemens Energy AG
- Wärtsilä Corporation
- Kongsberg Maritime AS
- Saft Groupe S.A.S.
- Toshiba Corporation
- Spear Power Systems, LLC
- Contemporary Amperex Technology Co., Limited
Marine Lithium-ion Battery Market Report Scope
| Metric | Value |
| Study Period | 2020–2033 |
| Market Size 2026 | US$ 1.1 Billion |
| Market Size 2033 | US$ 3.6 Billion |
| CAGR 2026–2033 | 18.5% |
| Absolute Dollar Opportunity | US$ 2.5 Billion |
| Largest Market | Europe (48% share in 2026) |
| Fastest-Growing Market | Asia Pacific (21.3% CAGR 2026–2033) |
| Market Concentration | Medium |
| Major Players | Corvus Energy AS, Leclanché SA, EST-Floattech B.V., Echandia AB, Shift Clean Energy Inc. |
Marine Lithium-ion Battery Market Segmentation
Battery Chemistry
- Nickel Manganese Cobalt
- Lithium Iron Phosphate
- Lithium Titanate
- Other Chemistries
Vessel Type
- Ferries and Passenger Vessels
- Harbour Craft and Tugs
- Offshore Support Vessels
- Inland Waterway Vessels
- Yachts and Leisure Craft
- Naval and Submarine
Propulsion Configuration
- Hybrid
- Plug-in Hybrid
- Fully Electric
Energy Capacity
- Up to 100 kWh
- 100–1,000 kWh
- 1,000–5,000 kWh
- Above 5,000 kWh
Regions
- North America
- Europe
- Asia Pacific
- Latin America
- Middle East & Africa
- Executive Summary
- Global Marine Lithium-ion Battery Market Snapshot
- Future Projections
- Key Report Takeaways
- Regional Snapshot
- Market Overview
- Market Definition and Report Scope
- Historical Trends 2020–2025
- Market Dynamics
- Drivers
- Fuel Intensity Rules and Carbon Pricing Make Hybrid Vessels Cheaper to Operate
- Port Air Quality Requirements Push Passenger Vessels Toward Battery Operation
- Restraints
- Thermal Runaway Risk Raises the Approval and Fire Protection Burden
- Shore Charging Capacity at Berths Limits Fully Electric Route Expansion
- Market Opportunities
- Harbour Craft and Tug Retrofits Open a Repeatable Short-Route Revenue Pool
- Battery Energy Storage as a Service Creates Recurring Marine Revenue
- Drivers
- Global Marine Lithium-ion Battery Market Outlook, 2020–2033
- Global Marine Lithium-ion Battery Market Outlook, by Battery Chemistry, Value (US$ Billion), 2020–2033
- Nickel Manganese Cobalt
- Lithium Iron Phosphate
- Lithium Titanate
- Other Chemistries
- Global Marine Lithium-ion Battery Market Outlook, by Vessel Type, Value (US$ Billion), 2020–2033
- Ferries and Passenger Vessels
- Harbour Craft and Tugs
- Offshore Support Vessels
- Inland Waterway Vessels
- Yachts and Leisure Craft
- Naval and Submarine
- Global Marine Lithium-ion Battery Market Outlook, by Propulsion Configuration, Value (US$ Billion), 2020–2033
- Hybrid
- Plug-in Hybrid
- Fully Electric
- Global Marine Lithium-ion Battery Market Outlook, by Energy Capacity, Value (US$ Billion), 2020–2033
- Up to 100 kWh
- 100–1,000 kWh
- 1,000–5,000 kWh
- Above 5,000 kWh
- Global Marine Lithium-ion Battery Market Outlook, by Region, Value (US$ Billion), 2020–2033
- North America
- Europe
- Asia Pacific
- Latin America
- Middle East & Africa
- Global Marine Lithium-ion Battery Market Outlook, by Battery Chemistry, Value (US$ Billion), 2020–2033
- North America Marine Lithium-ion Battery Market Outlook, 2020–2033
- North America Marine Lithium-ion Battery Market Outlook, by Battery Chemistry, Value (US$ Billion), 2020–2033
- Nickel Manganese Cobalt
- Lithium Iron Phosphate
- Lithium Titanate
- Other Chemistries
- North America Marine Lithium-ion Battery Market Outlook, by Vessel Type, Value (US$ Billion), 2020–2033
- Ferries and Passenger Vessels
- Harbour Craft and Tugs
- Offshore Support Vessels
- Inland Waterway Vessels
- Yachts and Leisure Craft
- Naval and Submarine
- North America Marine Lithium-ion Battery Market Outlook, by Propulsion Configuration, Value (US$ Billion), 2020–2033
- Hybrid
- Plug-in Hybrid
- Fully Electric
- North America Marine Lithium-ion Battery Market Outlook, by Energy Capacity, Value (US$ Billion), 2020–2033
- Up to 100 kWh
- 100–1,000 kWh
- 1,000–5,000 kWh
- Above 5,000 kWh
- North America Marine Lithium-ion Battery Market Outlook, by Country, Value (US$ Billion), 2020–2033
- United States Marine Lithium-ion Battery Market Outlook, by Battery Chemistry, 2020–2033
- United States Marine Lithium-ion Battery Market Outlook, by Vessel Type, 2020–2033
- United States Marine Lithium-ion Battery Market Outlook, by Propulsion Configuration, 2020–2033
- United States Marine Lithium-ion Battery Market Outlook, by Energy Capacity, 2020–2033
- Canada Marine Lithium-ion Battery Market Outlook, by Battery Chemistry, 2020–2033
- Canada Marine Lithium-ion Battery Market Outlook, by Vessel Type, 2020–2033
- Canada Marine Lithium-ion Battery Market Outlook, by Propulsion Configuration, 2020–2033
- Canada Marine Lithium-ion Battery Market Outlook, by Energy Capacity, 2020–2033
- North America Marine Lithium-ion Battery Market Outlook, by Battery Chemistry, Value (US$ Billion), 2020–2033
- Europe Marine Lithium-ion Battery Market Outlook, 2020–2033
- Europe Marine Lithium-ion Battery Market Outlook, by Battery Chemistry, Value (US$ Billion), 2020–2033
- Nickel Manganese Cobalt
- Lithium Iron Phosphate
- Lithium Titanate
- Other Chemistries
- Europe Marine Lithium-ion Battery Market Outlook, by Vessel Type, Value (US$ Billion), 2020–2033
- Ferries and Passenger Vessels
- Harbour Craft and Tugs
- Offshore Support Vessels
- Inland Waterway Vessels
- Yachts and Leisure Craft
- Naval and Submarine
- Europe Marine Lithium-ion Battery Market Outlook, by Propulsion Configuration, Value (US$ Billion), 2020–2033
- Hybrid
- Plug-in Hybrid
- Fully Electric
- Europe Marine Lithium-ion Battery Market Outlook, by Energy Capacity, Value (US$ Billion), 2020–2033
- Up to 100 kWh
- 100–1,000 kWh
- 1,000–5,000 kWh
- Above 5,000 kWh
- Europe Marine Lithium-ion Battery Market Outlook, by Country, Value (US$ Billion), 2020–2033
- Norway Marine Lithium-ion Battery Market Outlook, by Battery Chemistry, 2020–2033
- Norway Marine Lithium-ion Battery Market Outlook, by Vessel Type, 2020–2033
- Norway Marine Lithium-ion Battery Market Outlook, by Propulsion Configuration, 2020–2033
- Norway Marine Lithium-ion Battery Market Outlook, by Energy Capacity, 2020–2033
- Denmark Marine Lithium-ion Battery Market Outlook, by Battery Chemistry, 2020–2033
- Denmark Marine Lithium-ion Battery Market Outlook, by Vessel Type, 2020–2033
- Denmark Marine Lithium-ion Battery Market Outlook, by Propulsion Configuration, 2020–2033
- Denmark Marine Lithium-ion Battery Market Outlook, by Energy Capacity, 2020–2033
- Sweden Marine Lithium-ion Battery Market Outlook, by Battery Chemistry, 2020–2033
- Sweden Marine Lithium-ion Battery Market Outlook, by Vessel Type, 2020–2033
- Sweden Marine Lithium-ion Battery Market Outlook, by Propulsion Configuration, 2020–2033
- Sweden Marine Lithium-ion Battery Market Outlook, by Energy Capacity, 2020–2033
- Finland Marine Lithium-ion Battery Market Outlook, by Battery Chemistry, 2020–2033
- Finland Marine Lithium-ion Battery Market Outlook, by Vessel Type, 2020–2033
- Finland Marine Lithium-ion Battery Market Outlook, by Propulsion Configuration, 2020–2033
- Finland Marine Lithium-ion Battery Market Outlook, by Energy Capacity, 2020–2033
- Netherlands Marine Lithium-ion Battery Market Outlook, by Battery Chemistry, 2020–2033
- Netherlands Marine Lithium-ion Battery Market Outlook, by Vessel Type, 2020–2033
- Netherlands Marine Lithium-ion Battery Market Outlook, by Propulsion Configuration, 2020–2033
- Netherlands Marine Lithium-ion Battery Market Outlook, by Energy Capacity, 2020–2033
- Germany Marine Lithium-ion Battery Market Outlook, by Battery Chemistry, 2020–2033
- Germany Marine Lithium-ion Battery Market Outlook, by Vessel Type, 2020–2033
- Germany Marine Lithium-ion Battery Market Outlook, by Propulsion Configuration, 2020–2033
- Germany Marine Lithium-ion Battery Market Outlook, by Energy Capacity, 2020–2033
- Europe Marine Lithium-ion Battery Market Outlook, by Battery Chemistry, Value (US$ Billion), 2020–2033
- Asia Pacific Marine Lithium-ion Battery Market Outlook, 2020–2033
- Asia Pacific Marine Lithium-ion Battery Market Outlook, by Battery Chemistry, Value (US$ Billion), 2020–2033
- Nickel Manganese Cobalt
- Lithium Iron Phosphate
- Lithium Titanate
- Other Chemistries
- Asia Pacific Marine Lithium-ion Battery Market Outlook, by Vessel Type, Value (US$ Billion), 2020–2033
- Ferries and Passenger Vessels
- Harbour Craft and Tugs
- Offshore Support Vessels
- Inland Waterway Vessels
- Yachts and Leisure Craft
- Naval and Submarine
- Asia Pacific Marine Lithium-ion Battery Market Outlook, by Propulsion Configuration, Value (US$ Billion), 2020–2033
- Hybrid
- Plug-in Hybrid
- Fully Electric
- Asia Pacific Marine Lithium-ion Battery Market Outlook, by Energy Capacity, Value (US$ Billion), 2020–2033
- Up to 100 kWh
- 100–1,000 kWh
- 1,000–5,000 kWh
- Above 5,000 kWh
- Asia Pacific Marine Lithium-ion Battery Market Outlook, by Country, Value (US$ Billion), 2020–2033
- China Marine Lithium-ion Battery Market Outlook, by Battery Chemistry, 2020–2033
- China Marine Lithium-ion Battery Market Outlook, by Vessel Type, 2020–2033
- China Marine Lithium-ion Battery Market Outlook, by Propulsion Configuration, 2020–2033
- China Marine Lithium-ion Battery Market Outlook, by Energy Capacity, 2020–2033
- Japan Marine Lithium-ion Battery Market Outlook, by Battery Chemistry, 2020–2033
- Japan Marine Lithium-ion Battery Market Outlook, by Vessel Type, 2020–2033
- Japan Marine Lithium-ion Battery Market Outlook, by Propulsion Configuration, 2020–2033
- Japan Marine Lithium-ion Battery Market Outlook, by Energy Capacity, 2020–2033
- South Korea Marine Lithium-ion Battery Market Outlook, by Battery Chemistry, 2020–2033
- South Korea Marine Lithium-ion Battery Market Outlook, by Vessel Type, 2020–2033
- South Korea Marine Lithium-ion Battery Market Outlook, by Propulsion Configuration, 2020–2033
- South Korea Marine Lithium-ion Battery Market Outlook, by Energy Capacity, 2020–2033
- Singapore Marine Lithium-ion Battery Market Outlook, by Battery Chemistry, 2020–2033
- Singapore Marine Lithium-ion Battery Market Outlook, by Vessel Type, 2020–2033
- Singapore Marine Lithium-ion Battery Market Outlook, by Propulsion Configuration, 2020–2033
- Singapore Marine Lithium-ion Battery Market Outlook, by Energy Capacity, 2020–2033
- Australia Marine Lithium-ion Battery Market Outlook, by Battery Chemistry, 2020–2033
- Australia Marine Lithium-ion Battery Market Outlook, by Vessel Type, 2020–2033
- Australia Marine Lithium-ion Battery Market Outlook, by Propulsion Configuration, 2020–2033
- Australia Marine Lithium-ion Battery Market Outlook, by Energy Capacity, 2020–2033
- Asia Pacific Marine Lithium-ion Battery Market Outlook, by Battery Chemistry, Value (US$ Billion), 2020–2033
- Latin America Marine Lithium-ion Battery Market Outlook, 2020–2033
- Latin America Marine Lithium-ion Battery Market Outlook, by Battery Chemistry, Value (US$ Billion), 2020–2033
- Nickel Manganese Cobalt
- Lithium Iron Phosphate
- Lithium Titanate
- Other Chemistries
- Latin America Marine Lithium-ion Battery Market Outlook, by Vessel Type, Value (US$ Billion), 2020–2033
- Ferries and Passenger Vessels
- Harbour Craft and Tugs
- Offshore Support Vessels
- Inland Waterway Vessels
- Yachts and Leisure Craft
- Naval and Submarine
- Latin America Marine Lithium-ion Battery Market Outlook, by Propulsion Configuration, Value (US$ Billion), 2020–2033
- Hybrid
- Plug-in Hybrid
- Fully Electric
- Latin America Marine Lithium-ion Battery Market Outlook, by Energy Capacity, Value (US$ Billion), 2020–2033
- Up to 100 kWh
- 100–1,000 kWh
- 1,000–5,000 kWh
- Above 5,000 kWh
- Latin America Marine Lithium-ion Battery Market Outlook, by Country, Value (US$ Billion), 2020–2033
- Brazil Marine Lithium-ion Battery Market Outlook, by Battery Chemistry, 2020–2033
- Brazil Marine Lithium-ion Battery Market Outlook, by Vessel Type, 2020–2033
- Brazil Marine Lithium-ion Battery Market Outlook, by Propulsion Configuration, 2020–2033
- Brazil Marine Lithium-ion Battery Market Outlook, by Energy Capacity, 2020–2033
- Chile Marine Lithium-ion Battery Market Outlook, by Battery Chemistry, 2020–2033
- Chile Marine Lithium-ion Battery Market Outlook, by Vessel Type, 2020–2033
- Chile Marine Lithium-ion Battery Market Outlook, by Propulsion Configuration, 2020–2033
- Chile Marine Lithium-ion Battery Market Outlook, by Energy Capacity, 2020–2033
- Colombia Marine Lithium-ion Battery Market Outlook, by Battery Chemistry, 2020–2033
- Colombia Marine Lithium-ion Battery Market Outlook, by Vessel Type, 2020–2033
- Colombia Marine Lithium-ion Battery Market Outlook, by Propulsion Configuration, 2020–2033
- Colombia Marine Lithium-ion Battery Market Outlook, by Energy Capacity, 2020–2033
- Panama Marine Lithium-ion Battery Market Outlook, by Battery Chemistry, 2020–2033
- Panama Marine Lithium-ion Battery Market Outlook, by Vessel Type, 2020–2033
- Panama Marine Lithium-ion Battery Market Outlook, by Propulsion Configuration, 2020–2033
- Panama Marine Lithium-ion Battery Market Outlook, by Energy Capacity, 2020–2033
- Latin America Marine Lithium-ion Battery Market Outlook, by Battery Chemistry, Value (US$ Billion), 2020–2033
- Middle East & Africa Marine Lithium-ion Battery Market Outlook, 2020–2033
- Middle East & Africa Marine Lithium-ion Battery Market Outlook, by Battery Chemistry, Value (US$ Billion), 2020–2033
- Nickel Manganese Cobalt
- Lithium Iron Phosphate
- Lithium Titanate
- Other Chemistries
- Middle East & Africa Marine Lithium-ion Battery Market Outlook, by Vessel Type, Value (US$ Billion), 2020–2033
- Ferries and Passenger Vessels
- Harbour Craft and Tugs
- Offshore Support Vessels
- Inland Waterway Vessels
- Yachts and Leisure Craft
- Naval and Submarine
- Middle East & Africa Marine Lithium-ion Battery Market Outlook, by Propulsion Configuration, Value (US$ Billion), 2020–2033
- Hybrid
- Plug-in Hybrid
- Fully Electric
- Middle East & Africa Marine Lithium-ion Battery Market Outlook, by Energy Capacity, Value (US$ Billion), 2020–2033
- Up to 100 kWh
- 100–1,000 kWh
- 1,000–5,000 kWh
- Above 5,000 kWh
- Middle East & Africa Marine Lithium-ion Battery Market Outlook, by Country, Value (US$ Billion), 2020–2033
- United Arab Emirates Marine Lithium-ion Battery Market Outlook, by Battery Chemistry, 2020–2033
- United Arab Emirates Marine Lithium-ion Battery Market Outlook, by Vessel Type, 2020–2033
- United Arab Emirates Marine Lithium-ion Battery Market Outlook, by Propulsion Configuration, 2020–2033
- United Arab Emirates Marine Lithium-ion Battery Market Outlook, by Energy Capacity, 2020–2033
- Saudi Arabia Marine Lithium-ion Battery Market Outlook, by Battery Chemistry, 2020–2033
- Saudi Arabia Marine Lithium-ion Battery Market Outlook, by Vessel Type, 2020–2033
- Saudi Arabia Marine Lithium-ion Battery Market Outlook, by Propulsion Configuration, 2020–2033
- Saudi Arabia Marine Lithium-ion Battery Market Outlook, by Energy Capacity, 2020–2033
- Egypt Marine Lithium-ion Battery Market Outlook, by Battery Chemistry, 2020–2033
- Egypt Marine Lithium-ion Battery Market Outlook, by Vessel Type, 2020–2033
- Egypt Marine Lithium-ion Battery Market Outlook, by Propulsion Configuration, 2020–2033
- Egypt Marine Lithium-ion Battery Market Outlook, by Energy Capacity, 2020–2033
- South Africa Marine Lithium-ion Battery Market Outlook, by Battery Chemistry, 2020–2033
- South Africa Marine Lithium-ion Battery Market Outlook, by Vessel Type, 2020–2033
- South Africa Marine Lithium-ion Battery Market Outlook, by Propulsion Configuration, 2020–2033
- South Africa Marine Lithium-ion Battery Market Outlook, by Energy Capacity, 2020–2033
- Middle East & Africa Marine Lithium-ion Battery Market Outlook, by Battery Chemistry, Value (US$ Billion), 2020–2033
- Competitive Landscape
- Market Concentration and Industry Leaders
- Competitive Differentiation
- Strategic Moves and Market Direction
- Recent Industry Developments
- Company Profiles
- Corvus Energy AS
- Leclanché SA
- EST-Floattech B.V.
- Echandia AB
- Shift Clean Energy Inc.
- Siemens Energy AG
- Wärtsilä Corporation
- Kongsberg Maritime AS
- Saft Groupe S.A.S.
- Toshiba Corporation
- Spear Power Systems, LLC
- Contemporary Amperex Technology Co., Limited
- Appendix
- Research Methodology
- Report Assumptions
- Acronyms and Abbreviations
Battery Chemistry
- Nickel Manganese Cobalt
- Lithium Iron Phosphate
- Lithium Titanate
- Other Chemistries
Vessel Type
- Ferries and Passenger Vessels
- Harbour Craft and Tugs
- Offshore Support Vessels
- Inland Waterway Vessels
- Yachts and Leisure Craft
- Naval and Submarine
Propulsion Configuration
- Hybrid
- Plug-in Hybrid
- Fully Electric
Energy Capacity
- Up to 100 kWh
- 100–1,000 kWh
- 1,000–5,000 kWh
- Above 5,000 kWh
Regions
- North America
- Europe
- Asia Pacific
- Latin America
- Middle East & Africa
Our Research Methodology
Considering the volatility of business today, traditional approaches to strategizing a game plan can be unfruitful if not detrimental. True ambiguity is no way to determine a forecast. A myriad of predetermined factors must be accounted for such as the degree of risk involved, the magnitude of circumstances, as well as conditions or consequences that are not known or unpredictable. To circumvent binary views that cast uncertainty, the application of market research intelligence to strategically posture, move, and enable actionable outcomes is necessary.
View Methodology
Quality Assured
Rigorous Validation Process

Confidentiality Assured
End-to-end Data Security

Custom Research Services
Tailored To Your Objectives
FAQs
The market is valued at US$ 1.1 billion in 2026, or about US$ 1,100 million of battery systems delivered for vessel installation worldwide.
The market is projected to reach US$ 3.6 billion by 2033 at an 18.5% CAGR, adding US$ 2.5 billion across the forecast period.
Ferries and passenger vessels lead with 41% share in 2026, because fixed short routes and daily berth access make electrification practical and fundable.
Asia Pacific grows fastest at a 21.3% CAGR to 2033, led by inland waterway vessels and harbour craft in China and Singapore.
Concentration is medium, because classification society approval rather than manufacturing capacity limits how many suppliers can deliver certified marine systems.
Related Reports
Power EPC Market Size, Share, Insights, Competitive Landscape, and Forecast 2026 to 2033
Power EPC Market is projected to rise from US$ 780.56 billion in 2026 to US$ 1,220.97 billion by 2033 at a 6.6% CAGR. Explore generation and project trends.
Port Electrification Market Size, Share, Insights, Competitive Landscape, and Forecast 2026 to 2033
Explore the port electrification market, valued at US$ 6.8 billion in 2026 and forecast to reach US$ 16.4 billion by 2033, growing at a 13.4% CAGR.
Polycrystalline Solar Cell Market Size, Share, Insights, Competitive Landscape, and Forecast 2026 to 2033
Explore the polycrystalline solar cell market, valued at US$ 5.4 billion in 2026 and projected to reach US$ 6.6 billion by 2033, growing at 2.9% CAGR.
Synchronous Condenser Market Size, Share, Insights, Competitive Landscape, and Forecast 2026 to 2033
The global synchronous condenser market is valued at US$1.20 billion in 2026, reaching US$1.50 billion by 2033, growing at a 3.2% CAGR
Water and Wastewater Treatment Market Size, Share, Insights, Competitive Landscape, and Forecast 2026 to 2033
Water and wastewater treatment market to reach US$ 508.0 billion by 2033 from US$ 345.0 billion in 2026 at a 5.7% CAGR. Explore trends, segments and regions.
Vehicle-to-Grid Technology Market Size, Share, Insights, Competitive Landscape, and Forecast 2026 to 2033
Explore the vehicle-to-grid technology market, forecast to reach US$6.9 billion by 2033 at 28.4% CAGR, with component, application and regional insights.