



On-Demand Transportation Market
On-Demand Transportation Market Size, Share, Insights, Competitive Landscape, and Forecast 2026 to 2033
On-Demand Transportation Market Analysis, 2026–2033
On-Demand Transportation Market
On-Demand Transportation Market Size, Share, Insights, Competitive Landscape, and Forecast 2026 to 2033
On-Demand Transportation Market Size and Trend Analysis
How Fast Is the On-Demand Transportation Market Growing?
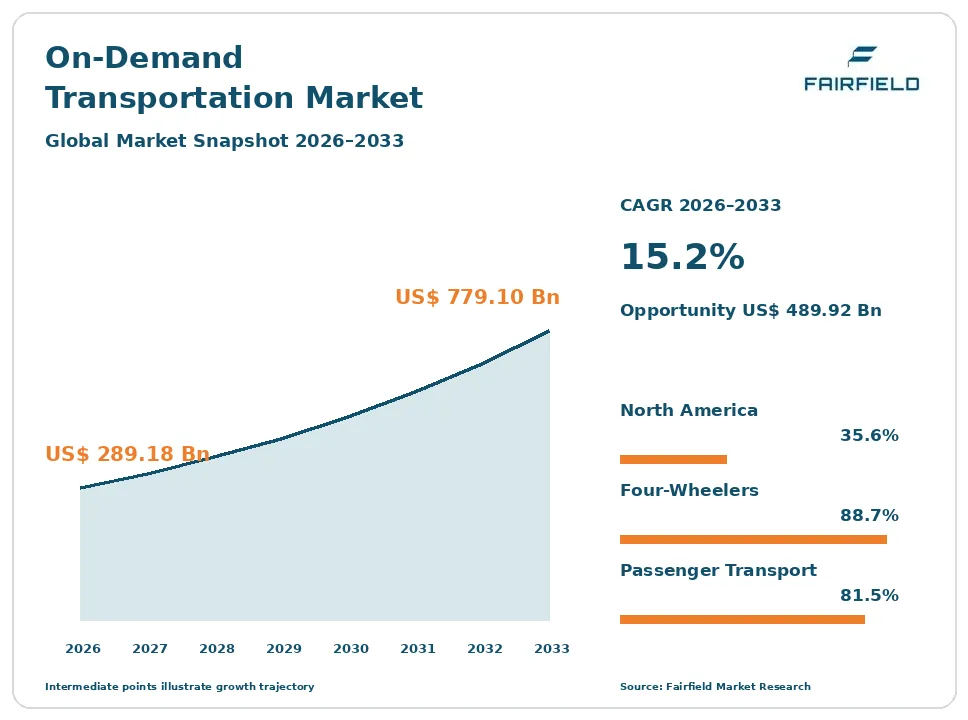
The global on-demand transportation market size is expected to be valued at US$ 289.18 billion in 2026 and projected to reach US$ 779.10 billion by 2033, growing at a CAGR of 15.2% between 2026 and 2033.
Between 2020 and 2025, the market grew at a CAGR of about 14%, after a sharp fall in 2020 followed by a strong rebound as travel reopened. Three factors now drive growth: rising smartphone use and urbanization, lower car ownership among younger city residents, and expanding services beyond rides to delivery, rentals, and public transit links. The market is shifting from simple ride-hailing toward mobility as a service apps that combine taxis, car sharing, micro-mobility such as e-scooters and e-bikes, buses, and trains in one place. Robotaxi services from Waymo, Zoox, Baidu Apollo Go, and Pony.ai are moving from pilots to paid operations in more cities.
Key Report Takeaways
- By Service Type: E-hailing held 37.6% share in 2026, while Car Sharing is projected to expand at an 18.4% CAGR through 2033, driven by urban residents who want car access without ownership.
- By Vehicle Type: Four-Wheelers held 88.7% share in 2026, while Micro-Mobility is projected to expand at a 21.2% CAGR through 2033, driven by e-scooters and e-bikes for short urban trips.
- By Application: Passenger Transportation held 81.5% share in 2026, while Goods Transportation is projected to expand at a 17.6% CAGR through 2033, driven by same-day parcel and food delivery by ride-hailing apps.
- By Region: North America held 35.6% share in 2026, while Asia Pacific is projected to expand at an 18.1% CAGR through 2033, driven by smartphone adoption and urbanization in India, Indonesia, and Vietnam.
Global On-Demand Transportation Market Trends and Insights
Drivers Impact Analysis
| Driver | Impact on CAGR Forecast | Geographic Relevance | Impact Timeline |
| Urbanization and declining car ownership | High | Global | Long term (≥4 years) |
| Autonomous vehicles and electric fleets | High | North America, Asia Pacific, Middle East & Africa | Medium term (2-4 years) |
Two drivers carry the strongest influence on on-demand transportation demand during the forecast period.
Urbanization and Smartphone Use Are Driving the On-Demand Transportation Market
Urbanization and declining car ownership are the strongest driver of the on-demand transportation market. City residents increasingly use apps to get around instead of owning cars.
The mechanism is rising city populations, high car costs, and convenient digital services. More than 4 billion people live in cities, and the number keeps rising, especially in Asia Pacific and Middle East & Africa. Parking shortages, congestion charges, insurance, and fuel costs make car ownership expensive in large cities such as London, Singapore, and New York. Younger people are delaying driver’s licenses and car purchases. Smartphone penetration and digital payments make it easy to book and pay for rides instantly. Platforms such as Uber, DiDi, Grab, Ola, and Bolt operate in thousands of cities. Corporate travel and airport trips add reliable demand. These factors drive strong trip growth.
Autonomous and Electric Fleets Are Expanding the On-Demand Transportation Market
Autonomous vehicles and electric fleets are expanding the on-demand transportation market. New technology promises lower costs per trip and new service models.
The cause is rapid progress in self-driving technology and electrification. Waymo provides paid robotaxi rides in several United States cities and announced expansion to Orlando, Dallas, Houston, and San Antonio in 2026. Zoox launched a public robotaxi service in Las Vegas in 2025. Uber agreed in 2025 to deploy at least 20,000 Lucid vehicles with Nuro self-driving technology over six years. Baidu Apollo Go and Pony.ai run large fleets in China and are expanding to Middle East & Africa. Electric vehicles lower fuel and maintenance costs for drivers, and platforms offer incentives to switch. These advances can lower fares and widen demand over time.
Restraints Impact Analysis
| Restraint | Impact on CAGR Forecast | Geographic Relevance | Impact Timeline |
| Regulation and driver employment issues | High | Europe, North America, Asia Pacific | Medium term (2-4 years) |
| Profitability pressure and price competition | Medium | Global | Short term (≤2 years) |
Two restraints limit how quickly the on-demand transportation market grows.
Regulation and Driver Issues Slow the On-Demand Transportation Market
Regulation and driver employment issues slow the on-demand transportation market. Governments are tightening rules for platforms and their workers.
The specific causes are labor laws, licensing, and city limits. The European Union Platform Work Directive may lead to many drivers being classified as employees, raising costs. California, New York, and Minnesota have set minimum pay rules for ride-hailing drivers. Some cities cap the number of ride-hailing licenses or charge congestion fees. Taxi industry groups have challenged platforms in court in Europe, Latin America, and Asia Pacific. Self-driving vehicles need permits, and incidents can lead to suspensions, as happened to Cruise in California in 2023. Data and safety rules add compliance costs. These factors raise costs and slow expansion into new cities.
Profitability Pressure Restricts the On-Demand Transportation Market
Profitability pressure and price competition restrict the on-demand transportation market. Many platforms struggled for years to make money.
The underlying causes are high driver incentives, marketing costs, and intense competition. Platforms compete for both riders and drivers, often with discounts and bonuses that cut margins. Fuel price spikes and inflation raise driver costs, leading to driver shortages and higher fares. Several micro-mobility companies, including Bird, went through bankruptcy or consolidation. Autonomous vehicles need very large upfront investments in vehicles, sensors, and depots. Insurance costs for commercial drivers are rising, especially in the United States. Investors now demand steady profits rather than growth at any cost. Some platforms have exited smaller markets to focus on profitable cities. These factors slow investment in new markets and new services.
Market Opportunities
Robotaxis and Electric Fleets Open a High-Growth Revenue Pool
Robotaxi services and electric fleets open a high-growth revenue pool in the on-demand transportation market. Removing the driver can sharply lower operating costs.
Platforms, technology firms, and carmakers can capture this opportunity. Waymo, Zoox, Baidu Apollo Go, Pony.ai, WeRide, and Tesla are scaling robotaxi services, while Uber and Lyft partner with several autonomous developers to put their vehicles on ride-hailing networks. Lyft and May Mobility began a pilot in Atlanta in 2025. Cities in Saudi Arabia and the United Arab Emirates are inviting robotaxi services. Fleet operators can earn revenue from charging, cleaning, and maintenance. Electric air taxis are also planned, with Uber and Joby Aviation preparing a service in Dubai. These services can command premium prices initially, and data from autonomous fleets improves safety and routing over time.
Asia Pacific and Multimodal Mobility Create a Volume Revenue Pool
Fast-growing cities in Asia Pacific and multimodal mobility as a service create a volume revenue pool in the on-demand transportation market. Hundreds of millions of people are joining the digital economy.
Platforms with local services and affordable options can capture this opportunity. India has large ride-hailing markets led by Ola, Uber, and Rapido, with bike taxis and auto-rickshaws offering low-cost rides. Indonesia, Vietnam, and the Philippines have strong motorcycle taxi services from Grab and Gojek. China is the largest single market, led by DiDi. Apps that combine rides, transit tickets, bike sharing, and delivery increase usage per customer. Partnerships with transit agencies and employers add new demand, and mobility as a service subscriptions encourage loyalty. Local language apps and cash payment options help reach new users in smaller cities.
Segment Analysis
By Service Type: E-hailing Leads While Car Sharing Grows Fastest
E-hailing held 37.6% share in 2026. Ride-hailing apps connect riders with drivers for point-to-point trips at prices set by the platform. Uber, DiDi, Lyft, Grab, Ola, and Bolt are the largest operators. Services include standard, premium, shared, and airport rides. Car rental and station-based mobility, such as bike sharing docks and taxi stands linked to apps, form other service types.
Car Sharing is the fastest-growing service type, expanding at an 18.4% CAGR through 2033. Car sharing lets members rent cars by the minute or hour through apps, with free-floating or station-based models. Peer-to-peer platforms such as Turo let owners rent out private cars. Electric car sharing fleets support city climate goals. For the market, car sharing growth reduces private car ownership.
By Vehicle Type: Four-Wheelers Lead While Micro-Mobility Grows Fastest
Four-Wheelers held 88.7% share in 2026. Cars, SUVs, and vans carry most on-demand trips and generate the highest revenue per ride. Electric and hybrid cars are a growing share of fleets. Two-wheelers and three-wheelers serve large markets in India, Indonesia, and Vietnam where motorcycle taxis and auto-rickshaws are common.
Micro-Mobility is the fastest-growing vehicle type, expanding at a 21.2% CAGR through 2033. Shared e-scooters and e-bikes from Lime, Tier-Dott, and Voi cover short trips and first- and last-mile links to transit. Cities are building more bike lanes and parking zones. Better vehicles and battery swapping improve economics. Regulation of parking and speed is improving public acceptance. For the market, micro-mobility growth widens access.
By Application: Passenger Transportation Leads While Goods Transportation Grows Fastest
Passenger Transportation held 81.5% share in 2026. Commuting, airport trips, nightlife, business travel, and medical appointments generate most on-demand trips. Corporate accounts and partnerships with airlines and hotels add steady demand. Accessibility services for older and disabled riders are growing, and non-emergency medical transport through apps is expanding in the United States. School and shift-worker transport also use on-demand platforms.
Goods Transportation is the fastest-growing application, expanding at a 17.6% CAGR through 2033. Ride-hailing platforms use their driver networks for parcel, grocery, and food delivery, with services such as Uber Connect, Grab Express, and Porter in India. Same-day delivery demand from e-commerce supports this growth. Small businesses use these services for local deliveries without their own fleets. For the market, goods growth increases driver utilization.
Geography Analysis
Which Region Is Leading the On-Demand Transportation Market?
North America is leading the on-demand transportation market with a 35.6% share in 2026. The United States is home to Uber and Lyft, high fares, strong airport and business travel demand, and the most advanced robotaxi deployments by Waymo, Zoox, and Tesla. Uber reached sustained profitability and is partnering with many autonomous vehicle developers. Canada has strong ride-hailing use in Toronto, Montreal, and Vancouver. Car sharing services and peer-to-peer rentals are expanding. Driver pay rules in several states raise costs. One change shaping the region is robotaxi expansion to more cities.
Europe Advances the On-Demand Transportation Market Through Multimodal Services
Europe is a major on-demand transportation market. The United Kingdom, Germany, France, Spain, and Poland have large ride-hailing and taxi app markets, led by Uber, Bolt, and FREENOW, which Lyft acquired in 2025. Car sharing and e-scooter services are popular in Paris, Berlin, Madrid, and Stockholm. Cities favor multimodal apps linked to public transit and rail tickets. The Platform Work Directive may raise driver costs. Key barriers include strict city rules and taxi licensing. One opportunity is electric fleets and robotaxi trials in London.
Which Region Is Growing Fastest in the On-Demand Transportation Market?
Asia Pacific is growing fastest in the on-demand transportation market at an 18.1% CAGR through 2033. China is the largest country market in the region, led by DiDi, with large robotaxi operations by Baidu Apollo Go and Pony.ai. India has fast-growing ride-hailing and bike taxi services from Ola, Uber, and Rapido. Indonesia, Vietnam, Thailand, and the Philippines rely on Grab and Gojek. Japan has relaxed rules to allow ride-sharing, and Australia has mature app use. One opportunity is low-cost two-wheeler and three-wheeler rides.
Latin America Grows the On-Demand Transportation Market Through Ride-Hailing Adoption
Latin America is a growing on-demand transportation market. Brazil and Mexico are among Uber’s largest markets, with strong competition from DiDi and 99. Colombia, Chile, Argentina, and Peru have large urban populations that rely on ride-hailing for safety and convenience. Motorcycle taxi services are growing in Brazil and Colombia, offering cheaper and faster rides through traffic. Car rental and car sharing apps are expanding in São Paulo and Mexico City. Electric ride-hailing fleets from BYD are entering the region. Key barriers include regulatory disputes and economic swings. One opportunity is affordable motorcycle and shared rides.
Middle East & Africa Builds the On-Demand Transportation Market
Middle East & Africa is an emerging on-demand transportation market. Saudi Arabia and the United Arab Emirates have strong ride-hailing use through Careem and Uber, and Dubai and Abu Dhabi are launching robotaxi and air taxi services. Egypt, Nigeria, Kenya, and South Africa have growing ride-hailing markets with Bolt, Uber, and local apps such as inDrive. Motorcycle taxis are popular in Kenya and Nigeria, and electric motorcycle startups are growing. Key barriers include fuel costs, regulation, and low incomes. One opportunity is autonomous and shared mobility in planned smart cities such as NEOM.
Competitive Landscape
The on-demand transportation market is moderately concentrated. Uber Technologies, DiDi Global, Lyft, Grab Holdings, ANI Technologies (Ola), Bolt, Careem, and GoTo (Gojek) lead ride-hailing, while Waymo, Zoox, Baidu Apollo Go, Pony.ai, and WeRide lead robotaxi services. Car rental and car sharing companies such as Avis Budget Group, Hertz, Free2Move, and Turo, and micro-mobility operators such as Lime, Tier-Dott, and Voi, add competition.
Companies compete on price, wait times, coverage, safety, driver supply, app features, and loyalty programs. Large platforms benefit from network effects, since more riders attract more drivers and shorten wait times. Super apps that bundle rides, delivery, and payments increase customer engagement. Autonomous vehicle partnerships are becoming a key area of competition, as platforms try to secure access to robotaxi fleets. Local players compete strongly in markets such as India and China.
Strategic moves show how competition is changing. In July 2025, Uber announced a partnership with Lucid and Nuro to deploy at least 20,000 robotaxis, and Lyft completed its acquisition of FREENOW. In September 2025, Zoox launched public robotaxi rides in Las Vegas. In February 2026, Waymo announced expansion to four more United States cities, and Uber partnered with Joby Aviation for air taxis in Dubai. These moves show competition shifting toward autonomous vehicles and global expansion.
Three themes shape vendor strategy. First, platforms are partnering on autonomous vehicles. Second, they are expanding through acquisitions in new regions. Third, they are bundling more services to raise usage.
On-Demand Transportation Market Industry Leaders
- Uber Technologies
- DiDi Global
- Lyft
- Grab Holdings
- ANI Technologies (Ola)
Recent Industry Developments
- February 2026: Waymo announced expansion of its robotaxi service to Orlando, Dallas, Houston, and San Antonio - extends driverless rides across the United States.
- February 2026: Uber partnered with Joby Aviation to launch Uber Air in Dubai - adds electric air taxi trips to the Uber app.
- September 2025: Zoox launched a public autonomous ride-hailing service in Las Vegas - brings purpose-built robotaxis to paying riders.
- July 2025: Lyft completed its acquisition of FREENOW - expands Lyft into taxi and ride-hailing markets across Europe.
- July 2025: Uber announced plans with Lucid and Nuro to deploy at least 20,000 robotaxis over six years - scales autonomous rides on its network.
Companies Covered in the Report
- Uber Technologies
- DiDi Global
- Lyft
- Grab Holdings
- ANI Technologies (Ola)
- Bolt
- Careem
- GoTo (Gojek)
- Waymo
- Baidu Apollo Go
- Avis Budget Group
- Lime
On-Demand Transportation Market Report Scope
This report covers on-demand transportation, including e-hailing, car sharing, car rental, and station-based mobility services using four-wheelers, two- and three-wheelers, and micro-mobility vehicles, for passenger and goods transportation, booked through digital platforms. It includes robotaxi services but excludes scheduled public transit and long-distance freight. The base year is 2025, and the forecast period runs from 2026 to 2033. All values are expressed in US$ Billion.
Service Type
- E-hailing
- Car Sharing
- Car Rental
- Station-Based Mobility
Vehicle Type
- Four-Wheelers
- Two- & Three-Wheelers
- Micro-Mobility
Application
- Passenger Transportation
- Goods Transportation
Regions
- North America
- Europe
- Asia Pacific
- Latin America
- Middle East & Africa
Key Questions Answered in the Report
How big is the on-demand transportation market in 2026?
The on-demand transportation market is valued at US$ 289.18 billion in 2026, led by e-hailing services using four-wheelers.
What is the on-demand transportation market forecast to 2033?
The market is projected to reach US$ 779.10 billion by 2033, growing at a 15.2% CAGR and adding US$ 489.92 billion.
Which vehicle type is growing fastest in on-demand transportation?
Micro-mobility is growing fastest at a 21.2% CAGR through 2033, driven by shared e-scooters and e-bikes for short urban trips.
Which region is growing fastest in the on-demand transportation market?
Asia Pacific is growing fastest at an 18.1% CAGR through 2033, driven by smartphone adoption and urbanization in India and Indonesia.
Which region holds the largest on-demand transportation market share?
North America holds the largest share at 35.6% in 2026, supported by high fares, Uber and Lyft, and robotaxi deployments.
1. Executive Summary
1.1. Global On-Demand Transportation Market Snapshot
1.2. Future Projections
1.3. Key Report Takeaways
1.4. Regional Snapshot
2. Market Overview
2.1. Market Definition and Report Scope
2.2. Historical Trends 2020–2025
2.3. Market Dynamics
2.3.1. Drivers
2.3.1.1. Urbanization and Smartphone Use Are Driving the On-Demand Transportation Market
2.3.1.2. Autonomous and Electric Fleets Are Expanding the On-Demand Transportation Market
2.3.2. Restraints
2.3.2.1. Regulation and Driver Issues Slow the On-Demand Transportation Market
2.3.2.2. Profitability Pressure Restricts the On-Demand Transportation Market
2.3.3. Market Opportunities
2.3.3.1. Robotaxis and Electric Fleets Open a High-Growth Revenue Pool
2.3.3.2. Asia Pacific and Multimodal Mobility Create a Volume Revenue Pool
3. Global On-Demand Transportation Market Outlook, 2020-2033
3.1. Global On-Demand Transportation Market Outlook, by Service Type, Value (US$ Billion), 2020-2033
3.1.1. E-hailing
3.1.2. Car Sharing
3.1.3. Car Rental
3.1.4. Station-Based Mobility
3.2. Global On-Demand Transportation Market Outlook, by Vehicle Type, Value (US$ Billion), 2020-2033
3.2.1. Four-Wheelers
3.2.2. Two- & Three-Wheelers
3.2.3. Micro-Mobility
3.3. Global On-Demand Transportation Market Outlook, by Application, Value (US$ Billion), 2020-2033
3.3.1. Passenger Transportation
3.3.2. Goods Transportation
3.4. Global On-Demand Transportation Market Outlook, by Region, Value (US$ Billion), 2020-2033
3.4.1. North America
3.4.2. Europe
3.4.3. Asia Pacific
3.4.4. Latin America
3.4.5. Middle East & Africa
4. North America On-Demand Transportation Market Outlook, 2020-2033
4.1. North America On-Demand Transportation Market Outlook, by Service Type, Value (US$ Billion), 2020-2033
4.1.1. E-hailing
4.1.2. Car Sharing
4.1.3. Car Rental
4.1.4. Station-Based Mobility
4.2. North America On-Demand Transportation Market Outlook, by Vehicle Type, Value (US$ Billion), 2020-2033
4.2.1. Four-Wheelers
4.2.2. Two- & Three-Wheelers
4.2.3. Micro-Mobility
4.3. North America On-Demand Transportation Market Outlook, by Application, Value (US$ Billion), 2020-2033
4.3.1. Passenger Transportation
4.3.2. Goods Transportation
4.4. North America On-Demand Transportation Market Outlook, by Country, Value (US$ Billion), 2020-2033
4.4.1. United States On-Demand Transportation Market Outlook, by Service Type, 2020-2033
4.4.2. United States On-Demand Transportation Market Outlook, by Vehicle Type, 2020-2033
4.4.3. United States On-Demand Transportation Market Outlook, by Application, 2020-2033
4.4.4. Canada On-Demand Transportation Market Outlook, by Service Type, 2020-2033
4.4.5. Canada On-Demand Transportation Market Outlook, by Vehicle Type, 2020-2033
4.4.6. Canada On-Demand Transportation Market Outlook, by Application, 2020-2033
5. Europe On-Demand Transportation Market Outlook, 2020-2033
5.1. Europe On-Demand Transportation Market Outlook, by Service Type, Value (US$ Billion), 2020-2033
5.1.1. E-hailing
5.1.2. Car Sharing
5.1.3. Car Rental
5.1.4. Station-Based Mobility
5.2. Europe On-Demand Transportation Market Outlook, by Vehicle Type, Value (US$ Billion), 2020-2033
5.2.1. Four-Wheelers
5.2.2. Two- & Three-Wheelers
5.2.3. Micro-Mobility
5.3. Europe On-Demand Transportation Market Outlook, by Application, Value (US$ Billion), 2020-2033
5.3.1. Passenger Transportation
5.3.2. Goods Transportation
5.4. Europe On-Demand Transportation Market Outlook, by Country, Value (US$ Billion), 2020-2033
5.4.1. United Kingdom On-Demand Transportation Market Outlook, by Service Type, 2020-2033
5.4.2. United Kingdom On-Demand Transportation Market Outlook, by Vehicle Type, 2020-2033
5.4.3. United Kingdom On-Demand Transportation Market Outlook, by Application, 2020-2033
5.4.4. Germany On-Demand Transportation Market Outlook, by Service Type, 2020-2033
5.4.5. Germany On-Demand Transportation Market Outlook, by Vehicle Type, 2020-2033
5.4.6. Germany On-Demand Transportation Market Outlook, by Application, 2020-2033
5.4.7. France On-Demand Transportation Market Outlook, by Service Type, 2020-2033
5.4.8. France On-Demand Transportation Market Outlook, by Vehicle Type, 2020-2033
5.4.9. France On-Demand Transportation Market Outlook, by Application, 2020-2033
5.4.10. Spain On-Demand Transportation Market Outlook, by Service Type, 2020-2033
5.4.11. Spain On-Demand Transportation Market Outlook, by Vehicle Type, 2020-2033
5.4.12. Spain On-Demand Transportation Market Outlook, by Application, 2020-2033
5.4.13. Poland On-Demand Transportation Market Outlook, by Service Type, 2020-2033
5.4.14. Poland On-Demand Transportation Market Outlook, by Vehicle Type, 2020-2033
5.4.15. Poland On-Demand Transportation Market Outlook, by Application, 2020-2033
6. Asia Pacific On-Demand Transportation Market Outlook, 2020-2033
6.1. Asia Pacific On-Demand Transportation Market Outlook, by Service Type, Value (US$ Billion), 2020-2033
6.1.1. E-hailing
6.1.2. Car Sharing
6.1.3. Car Rental
6.1.4. Station-Based Mobility
6.2. Asia Pacific On-Demand Transportation Market Outlook, by Vehicle Type, Value (US$ Billion), 2020-2033
6.2.1. Four-Wheelers
6.2.2. Two- & Three-Wheelers
6.2.3. Micro-Mobility
6.3. Asia Pacific On-Demand Transportation Market Outlook, by Application, Value (US$ Billion), 2020-2033
6.3.1. Passenger Transportation
6.3.2. Goods Transportation
6.4. Asia Pacific On-Demand Transportation Market Outlook, by Country, Value (US$ Billion), 2020-2033
6.4.1. China On-Demand Transportation Market Outlook, by Service Type, 2020-2033
6.4.2. China On-Demand Transportation Market Outlook, by Vehicle Type, 2020-2033
6.4.3. China On-Demand Transportation Market Outlook, by Application, 2020-2033
6.4.4. India On-Demand Transportation Market Outlook, by Service Type, 2020-2033
6.4.5. India On-Demand Transportation Market Outlook, by Vehicle Type, 2020-2033
6.4.6. India On-Demand Transportation Market Outlook, by Application, 2020-2033
6.4.7. Indonesia On-Demand Transportation Market Outlook, by Service Type, 2020-2033
6.4.8. Indonesia On-Demand Transportation Market Outlook, by Vehicle Type, 2020-2033
6.4.9. Indonesia On-Demand Transportation Market Outlook, by Application, 2020-2033
6.4.10. Vietnam On-Demand Transportation Market Outlook, by Service Type, 2020-2033
6.4.11. Vietnam On-Demand Transportation Market Outlook, by Vehicle Type, 2020-2033
6.4.12. Vietnam On-Demand Transportation Market Outlook, by Application, 2020-2033
6.4.13. Thailand On-Demand Transportation Market Outlook, by Service Type, 2020-2033
6.4.14. Thailand On-Demand Transportation Market Outlook, by Vehicle Type, 2020-2033
6.4.15. Thailand On-Demand Transportation Market Outlook, by Application, 2020-2033
6.4.16. Philippines On-Demand Transportation Market Outlook, by Service Type, 2020-2033
6.4.17. Philippines On-Demand Transportation Market Outlook, by Vehicle Type, 2020-2033
6.4.18. Philippines On-Demand Transportation Market Outlook, by Application, 2020-2033
6.4.19. Japan On-Demand Transportation Market Outlook, by Service Type, 2020-2033
6.4.20. Japan On-Demand Transportation Market Outlook, by Vehicle Type, 2020-2033
6.4.21. Japan On-Demand Transportation Market Outlook, by Application, 2020-2033
6.4.22. Australia On-Demand Transportation Market Outlook, by Service Type, 2020-2033
6.4.23. Australia On-Demand Transportation Market Outlook, by Vehicle Type, 2020-2033
6.4.24. Australia On-Demand Transportation Market Outlook, by Application, 2020-2033
7. Latin America On-Demand Transportation Market Outlook, 2020-2033
7.1. Latin America On-Demand Transportation Market Outlook, by Service Type, Value (US$ Billion), 2020-2033
7.1.1. E-hailing
7.1.2. Car Sharing
7.1.3. Car Rental
7.1.4. Station-Based Mobility
7.2. Latin America On-Demand Transportation Market Outlook, by Vehicle Type, Value (US$ Billion), 2020-2033
7.2.1. Four-Wheelers
7.2.2. Two- & Three-Wheelers
7.2.3. Micro-Mobility
7.3. Latin America On-Demand Transportation Market Outlook, by Application, Value (US$ Billion), 2020-2033
7.3.1. Passenger Transportation
7.3.2. Goods Transportation
7.4. Latin America On-Demand Transportation Market Outlook, by Country, Value (US$ Billion), 2020-2033
7.4.1. Brazil On-Demand Transportation Market Outlook, by Service Type, 2020-2033
7.4.2. Brazil On-Demand Transportation Market Outlook, by Vehicle Type, 2020-2033
7.4.3. Brazil On-Demand Transportation Market Outlook, by Application, 2020-2033
7.4.4. Mexico On-Demand Transportation Market Outlook, by Service Type, 2020-2033
7.4.5. Mexico On-Demand Transportation Market Outlook, by Vehicle Type, 2020-2033
7.4.6. Mexico On-Demand Transportation Market Outlook, by Application, 2020-2033
7.4.7. Colombia On-Demand Transportation Market Outlook, by Service Type, 2020-2033
7.4.8. Colombia On-Demand Transportation Market Outlook, by Vehicle Type, 2020-2033
7.4.9. Colombia On-Demand Transportation Market Outlook, by Application, 2020-2033
7.4.10. Chile On-Demand Transportation Market Outlook, by Service Type, 2020-2033
7.4.11. Chile On-Demand Transportation Market Outlook, by Vehicle Type, 2020-2033
7.4.12. Chile On-Demand Transportation Market Outlook, by Application, 2020-2033
7.4.13. Argentina On-Demand Transportation Market Outlook, by Service Type, 2020-2033
7.4.14. Argentina On-Demand Transportation Market Outlook, by Vehicle Type, 2020-2033
7.4.15. Argentina On-Demand Transportation Market Outlook, by Application, 2020-2033
7.4.16. Peru On-Demand Transportation Market Outlook, by Service Type, 2020-2033
7.4.17. Peru On-Demand Transportation Market Outlook, by Vehicle Type, 2020-2033
7.4.18. Peru On-Demand Transportation Market Outlook, by Application, 2020-2033
8. Middle East & Africa On-Demand Transportation Market Outlook, 2020-2033
8.1. Middle East & Africa On-Demand Transportation Market Outlook, by Service Type, Value (US$ Billion), 2020-2033
8.1.1. E-hailing
8.1.2. Car Sharing
8.1.3. Car Rental
8.1.4. Station-Based Mobility
8.2. Middle East & Africa On-Demand Transportation Market Outlook, by Vehicle Type, Value (US$ Billion), 2020-2033
8.2.1. Four-Wheelers
8.2.2. Two- & Three-Wheelers
8.2.3. Micro-Mobility
8.3. Middle East & Africa On-Demand Transportation Market Outlook, by Application, Value (US$ Billion), 2020-2033
8.3.1. Passenger Transportation
8.3.2. Goods Transportation
8.4. Middle East & Africa On-Demand Transportation Market Outlook, by Country, Value (US$ Billion), 2020-2033
8.4.1. Saudi Arabia On-Demand Transportation Market Outlook, by Service Type, 2020-2033
8.4.2. Saudi Arabia On-Demand Transportation Market Outlook, by Vehicle Type, 2020-2033
8.4.3. Saudi Arabia On-Demand Transportation Market Outlook, by Application, 2020-2033
8.4.4. United Arab Emirates On-Demand Transportation Market Outlook, by Service Type, 2020-2033
8.4.5. United Arab Emirates On-Demand Transportation Market Outlook, by Vehicle Type, 2020-2033
8.4.6. United Arab Emirates On-Demand Transportation Market Outlook, by Application, 2020-2033
8.4.7. Egypt On-Demand Transportation Market Outlook, by Service Type, 2020-2033
8.4.8. Egypt On-Demand Transportation Market Outlook, by Vehicle Type, 2020-2033
8.4.9. Egypt On-Demand Transportation Market Outlook, by Application, 2020-2033
8.4.10. Nigeria On-Demand Transportation Market Outlook, by Service Type, 2020-2033
8.4.11. Nigeria On-Demand Transportation Market Outlook, by Vehicle Type, 2020-2033
8.4.12. Nigeria On-Demand Transportation Market Outlook, by Application, 2020-2033
8.4.13. Kenya On-Demand Transportation Market Outlook, by Service Type, 2020-2033
8.4.14. Kenya On-Demand Transportation Market Outlook, by Vehicle Type, 2020-2033
8.4.15. Kenya On-Demand Transportation Market Outlook, by Application, 2020-2033
8.4.16. South Africa On-Demand Transportation Market Outlook, by Service Type, 2020-2033
8.4.17. South Africa On-Demand Transportation Market Outlook, by Vehicle Type, 2020-2033
8.4.18. South Africa On-Demand Transportation Market Outlook, by Application, 2020-2033
9. Competitive Landscape
9.1. Market Concentration and Industry Leaders
9.2. Competitive Differentiation
9.3. Strategic Moves and Market Direction
9.4. Recent Industry Developments
9.5. Company Profiles
9.5.1. Uber Technologies
9.5.2. DiDi Global
9.5.3. Lyft
9.5.4. Grab Holdings
9.5.5. ANI Technologies (Ola)
9.5.6. Bolt
9.5.7. Careem
9.5.8. GoTo (Gojek)
9.5.9. Waymo
9.5.10. Baidu Apollo Go
9.5.11. Avis Budget Group
9.5.12. Lime
10. Appendix
10.1. Research Methodology
10.2. Report Assumptions
10.3. Acronyms and Abbreviations
| Service Type | E-hailing, Car Sharing, Car Rental, Station-Based Mobility |
| Vehicle Type | Four-Wheelers, Two- & Three-Wheelers, Micro-Mobility |
| Application | Passenger Transportation, Goods Transportation |
| Regions | North America, Europe, Asia Pacific, Latin America, Middle East & Africa |
Our Research Methodology
Considering the volatility of business today, traditional approaches to strategizing a game plan can be unfruitful if not detrimental. True ambiguity is no way to determine a forecast. A myriad of predetermined factors must be accounted for such as the degree of risk involved, the magnitude of circumstances, as well as conditions or consequences that are not known or unpredictable. To circumvent binary views that cast uncertainty, the application of market research intelligence to strategically posture, move, and enable actionable outcomes is necessary.
View Methodology
Quality Assured
Rigorous Validation Process

Confidentiality Assured
End-to-end Data Security

Custom Research Services
Tailored To Your Objectives
FAQs
The on-demand transportation market is valued at US$ 289.18 billion in 2026, led by e-hailing services using four-wheelers.
The market is projected to reach US$ 779.10 billion by 2033, growing at a 15.2% CAGR and adding US$ 489.92 billion.
Micro-mobility is growing fastest at a 21.2% CAGR through 2033, driven by shared e-scooters and e-bikes for short urban trips.
Asia Pacific is growing fastest at an 18.1% CAGR through 2033, driven by smartphone adoption and urbanization in India and Indonesia.
North America holds the largest share at 35.6% in 2026, supported by high fares, Uber and Lyft, and robotaxi deployments.
Related Reports
Electric Vehicle Sound Generator Market Size, Share, Insights, Competitive Landscape, and Forecast 2026 to 2033
Electric vehicle sound generator market to grow from US$1.2 Bn in 2026 to US$3.2 Bn by 2033 at 15.0% CAGR. Explore systems, components and regions.
On-Demand Warehousing Market Size, Share, Insights, Competitive Landscape, and Forecast 2026 to 2033
On-demand warehousing market to grow from US$17.20 Bn in 2026 to US$47.51 Bn by 2033 at 15.6% CAGR. Explore services, storage duration and regional trends.
On-Demand Trucking Market Size, Share, Insights, Competitive Landscape, and Forecast 2026 to 2033
On-demand trucking market to grow from US$11.00 Bn in 2026 to US$30.52 Bn by 2033 at 15.7% CAGR. Explore truck types, services, industries and regions.
On-Board Diagnostics (OBD) Aftermarket Size, Share, Insights, Competitive Landscape, and Forecast 2026 to 2033
On-board diagnostics (OBD) aftermarket to grow from US$4.74 Bn in 2026 to US$21.02 Bn by 2033 at 23.7% CAGR. Explore connectivity, applications and regions.
On-Board Charger Market Size, Share, Insights, Competitive Landscape, and Forecast 2026 to 2033
On-board charger market to grow from US$10.13 Bn in 2026 to US$27.16 Bn by 2033 at 15.1% CAGR. Explore propulsion, power output, vehicles and regions.
Second Life EV Battery Market Size, Share, Insights, Competitive Landscape, and Forecast 2026 to 2033
Second life EV battery market to reach US$ 19.52 billion by 2033 at a 41.7% CAGR. Explore applications, battery chemistries and regional trends.