



Plastic Resins Market
Plastic Resins Market
Plastic Resins Market Snapshot
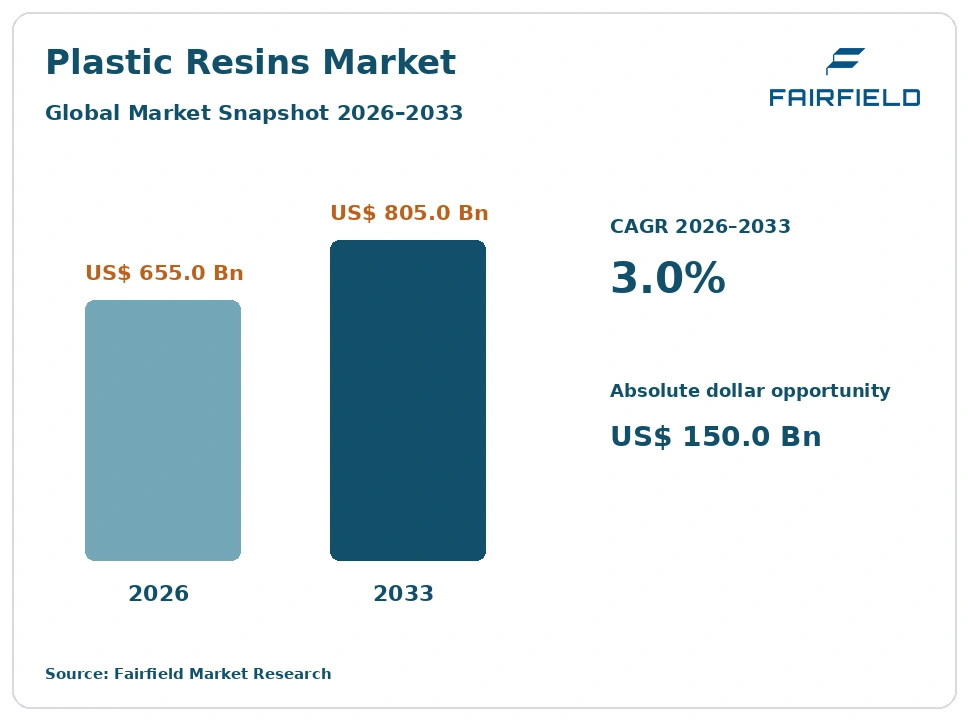
The global plastic resins market size is expected to be valued at US$ 655.0 billion in 2026 and projected to reach US$ 805.0 billion by 2033, growing at a CAGR of 3.0% between 2026 and 2033.
The market grew at roughly 2.4% a year between 2020 and 2025, with tonnage rising while prices and margins fell. Three forces shape the outlook. Packaging, construction and healthcare demand continues to add volume faster than global population growth. A long wave of capacity additions has left most commodity polymers oversupplied, holding prices near cash cost. And recycled-content rules are arriving across packaging, vehicles and construction at the same time, obliging producers to supply recyclate alongside virgin grades. The direction is steady volume growth with weak pricing, and a slow reallocation of investment from new virgin capacity toward recycling and certified-circular material.
Key Report Takeaways
- By Resin Type: polyethylene held 29.8% share in 2026, while engineering thermoplastics are projected to expand at a 3.9% CAGR through 2033, supported by electrical, electronics and vehicle electrification applications that need heat and dimensional performance.
- By Material Origin: virgin resin held 88.4% share in 2026, while chemically recycled resin is projected to grow at a 12.8% CAGR through 2033 from a very small base, provided unit economics improve enough to sustain plant utilisation.
- By End Use Industry: packaging held 38.2% share in 2026, while healthcare is projected to expand at a 4.0% CAGR through 2033, reflecting single-use medical device volumes and sterile packaging requirements.
- By Processing Method: extrusion held 37.4% share in 2026, while injection molding is projected to grow at a 3.6% CAGR through 2033, as component manufacturing shifts toward thin-wall and multi-material parts.
- By Geography: Asia Pacific held 51.8% share in 2026, while Middle East & Africa is projected to expand at a 4.2% CAGR through 2033, combining gas-advantaged production with low per-capita consumption that still has room to rise.
Global Plastic Resins Market Trends and Insights
Drivers Impact Analysis
Two very different forces add volume: ordinary end-market consumption, and demand created by law.
| Driver | Impact on CAGR Forecast | Geographic Relevance | Impact Timeline |
| Packaging, construction and healthcare consumption growth | High | Asia Pacific, Middle East & Africa, Latin America | Long term ≥4 years |
| Statutory recycled-content requirements across multiple sectors | Medium | Europe, North America | Medium term 2–4 years |
Packaging and Infrastructure Volume Keeps Resin Consumption Climbing
Polymer demand still tracks urbanisation more closely than it tracks any environmental debate, and that keeps tonnage rising. Food packaging, pipes, cable insulation, window profiles, insulation board and medical disposables all consume resin in direct proportion to housing, water infrastructure, electrification and healthcare provision. Consumption per person in large developing economies remains far below levels in wealthier markets, so the arithmetic of catch-up alone adds several million tonnes a year.
The mechanism is substitution against heavier materials. Polyethylene and polyvinyl chloride pipe replaces metal and concrete because it does not corrode and installs faster with less equipment. Polypropylene displaces metal in appliances and vehicle interiors on weight and tooling cost. Insulation and glazing requirements in building codes pull expandable polystyrene and rigid profiles into construction. Each substitution is driven by installed cost and durability rather than by preference, which makes the resulting demand unusually resistant to price movement.
Statutory Recycled-Content Rules Create Obligated Demand for Recyclate
Recycled resin now has a buyer who is legally required to appear, which is a structurally different kind of demand. Minimum recycled-content thresholds for beverage bottles already apply in the European Union, proposals under the end-of-life vehicle framework would extend requirements to new cars, and construction specifications increasingly carry recycled-content criteria. Converters must source compliant material regardless of whether it is the cheapest option available.
The causal chain runs from obligation to specification to purchase order. Once a threshold is written into law, brand owners rewrite supplier qualification documents, and resin producers must supply grades with traceable recycled content and documented food-contact status. The European Union rules on recycled plastic materials intended to come into contact with food are the specific gate for recycled polyethylene terephthalate in packaging, and national plastic packaging taxes in the United Kingdom, Spain and Italy add a direct financial penalty for falling short of recycled thresholds.
Restraints Impact Analysis
Two conditions suppress profitability even while volumes grow.
| Restraint | Impact on CAGR Forecast | Geographic Relevance | Impact Timeline |
| Capacity oversupply and feedstock cost divergence between regions | High | Europe, Asia Pacific, exporters globally | Long term ≥4 years |
| Recyclate cost above virgin resin and unresolved global policy | Medium | Global | Medium term 2–4 years |
Capacity Additions Outran Demand and Depressed Polymer Margins
The industry is working through an oversupply trough that it built itself. Large cracker and polymerisation projects commissioned in gas-advantaged regions and in China added capacity faster than consumption grew, and the resulting surplus has pushed commodity polymer margins toward cash cost. Older assets in Europe and parts of Asia Pacific now run at reduced rates, and rationalisation of subscale sites has become the standard response.
The underlying cause is feedstock cost divergence, not demand weakness. Producers cracking cheap ethane in North America and the Gulf sit far below naphtha-based competitors on the cost curve, so they export surplus material and set delivered prices in third markets. Naphtha crackers paying European gas and power tariffs, plus carbon compliance costs, cannot match that. Anti-dumping measures on several commodity resins and volatile ocean freight alter the picture temporarily but do not change the underlying cost ranking.
Recyclate Costs More Than Virgin and Policy Direction Remains Unsettled
Mechanical recycling capacity has in several cases run ahead of profitable demand, which is an uncomfortable fact for the circular transition. Recycled polyolefin and polyethylene terephthalate have at times sold above virgin equivalents, because collection, sorting, washing and pelletising cost more per tonne than making new polymer from cheap feedstock. Brands holding to price targets have reverted to virgin material where no rule obliges otherwise, leaving recyclers with idle lines.
Quality adds a second constraint. Mixed, contaminated post-consumer streams yield resin with variable melt flow, colour and odour, so converters restrict it to less demanding applications. Policy uncertainty compounds the problem: negotiations toward a global agreement on plastic pollution remain unresolved, and the eventual treatment of production limits, product design and chemicals of concern is genuinely unknown. Investment committees discount projects whose economics depend on rules that have not been written.
Market Opportunities
Two revenue pools sit apart from commodity tonnage and reward different capabilities.
Certified Circular and Chemically Recycled Grades Open a Premium Resin Pool
Material that carries an auditable circularity claim sells at a premium that commodity resin never earns. Mass-balance certified grades, food-contact approved recycled polyethylene terephthalate and chemically recycled polyolefins all command higher prices because obligated buyers have few alternative sources. For a producer, this converts a sustainability programme into a differentiated product line with contracted offtake rather than spot exposure.
The customers are packaging converters serving regulated brand owners, automotive tier suppliers preparing for vehicle recycled-content requirements, and electronics manufacturers facing procurement criteria. Capturing the pool requires feedstock security, certification under recognised chain-of-custody schemes, and regulatory approval for food contact where relevant. Chemical recycling can reach contaminated and mixed streams that mechanical routes cannot, though its economics only close with scale, cheap energy and reliable feedstock supply. Producers that integrate collection or secure long-term waste contracts hold the advantage.
Healthcare, Infrastructure and Feedstock-Advantaged Capacity Carry the Margin
Three pools remain genuinely profitable while commodity grades struggle. Medical and pharmaceutical resins earn premiums for regulatory documentation, batch traceability, sterilisation resistance and change-control commitments that general-purpose suppliers cannot provide. Water, gas and telecom infrastructure consumes high-performance pipe grades on long qualification cycles. Gas-advantaged new capacity, meanwhile, generates cash at price levels that force others to curtail.
The demand comes from hospital systems and device manufacturers, from utilities and municipal water programmes replacing ageing networks, and from export markets that cannot produce competitively. Each pool rewards a different capability: quality systems and documentation for healthcare, long-term approvals and technical service for infrastructure, and feedstock position for export grades. Producers with Gulf or North American feedstock integration can supply the third pool while using the first two to stabilise earnings through the cycle.
Segment Analysis
By Resin Type: Polyethylene Holds the Volume While Engineering Grades Grow Fastest
Polyethylene led with 29.8% of the market in 2026 across low density, linear low density and high density grades, because film, bottles, pipe and cable compounds consume it everywhere. Polypropylene follows closely, then polyvinyl chloride in construction, polyethylene terephthalate in bottles and fibre chip, and polystyrene with expandable polystyrene in appliances, packaging and insulation. Engineering thermoplastics, covering polycarbonate, polyamides, acetal and related polymers, are the fastest-growing group at a 3.9% CAGR to 2033. Electrification, connector miniaturisation, battery housings and thermal management applications demand heat resistance and dimensional stability that commodity polymers cannot deliver. ABS and other styrenics occupy the middle ground. The commercial reading is that volume and value are diverging: the biggest tonnages are the least profitable, so producers increasingly pursue specialty grades within their existing polymer families rather than adding commodity capacity.
By Material Origin: Virgin Resin Still Dominates While Chemical Routes Scale Up
Virgin resin accounted for 88.4% of market value in 2026, and it remains the default because it is cheaper, cleaner and consistently specified. Mechanically recycled resin holds most of the remainder and serves non-food packaging, construction, agriculture and consumer durables. Chemically recycled resin is the fastest-growing origin at a 12.8% CAGR to 2033, but the base is very small and growth depends on economics that have not yet closed. Pyrolysis and depolymerisation routes handle mixed and contaminated waste that mechanical recycling rejects, and they produce material that qualifies for food contact where mechanical recyclate often cannot. Regulatory approval, mass-balance accounting rules and feedstock contracts determine who can supply it. For buyers, the key point is that recycled share will be set by feedstock availability and cost, not by stated ambition.
By End Use Industry: Packaging Dominates While Healthcare Grows Quickest
Packaging took 38.2% of resin demand in 2026, the inevitable result of film, rigid containers, closures and bottles consuming polymer in enormous volume. Building and construction follows, using polyvinyl chloride profiles and pipe, insulation foam and membranes. Automotive and transportation, electrical and electronics, consumer goods and agriculture account for most of the balance. Healthcare is the fastest-growing end use at a 4.0% CAGR to 2033, driven by single-use devices, intravenous and dialysis sets, sterile barrier packaging and diagnostics consumables. Healthcare grades sell at a premium because regulatory documentation and change control matter more than price per kilogram. Agriculture, through mulch film, greenhouse covering and irrigation pipe, is the segment most exposed to recycled-content and collection rules. The implication is that end-market mix now explains profitability differences between producers better than scale does.
By Processing Method: Extrusion Consumes the Most Resin While Injection Molding Accelerates
Extrusion accounted for 37.4% of resin consumption in 2026, covering film, sheet, pipe, profile and cable insulation, which are the highest-tonnage plastic products made. Blow molding supplies bottles and containers, thermoforming serves trays and cups, and rotational molding handles tanks and large hollow parts. Injection molding is the fastest-growing method at a 3.6% CAGR to 2033, because component manufacturing is shifting toward thin-wall packaging, complex multi-material parts and electrical housings that only this route can produce economically at volume. Processing method matters commercially because it determines grade specification: melt flow index, additive package and thermal stability differ sharply between a film grade and a thin-wall molding grade. Producers that supply technical service alongside pellets hold stronger positions with converters, particularly where recycled content must be processed without disrupting line speeds.
Geography Analysis
North America Exports Its Feedstock Advantage as Finished Polymer
North America held 18.6% of global demand in 2026, with the United States dominating production and Mexico and Canada adding significant converting capacity. The region’s defining feature is cheap ethane, which places its crackers among the lowest-cost polyethylene producers anywhere and makes it a structural exporter of surplus resin. Domestic demand is led by packaging, construction and healthcare, with automotive consumption concentrated around light vehicle assembly. Recycled-content policy here is state-led rather than federal, producing a patchwork of obligations that converters must track separately. Anti-dumping actions on imported resins recur and shape trade flows. The main barrier is logistics: moving large export volumes depends on port and rail capacity that has been stretched. The clearest regional opportunity lies in healthcare and infrastructure grades, where documentation and proximity outweigh delivered cost.
Europe Rationalises Older Crackers While Writing the Circularity Rules
Europe accounted for 15.2% of demand in 2026 and is the region where the margin squeeze is most visible. Producers in Germany, Belgium, the Netherlands, Italy and France run naphtha-based crackers that pay high gas and power prices, so several subscale sites have been rationalised and more are under review. Carbon compliance adds cost to the same assets. At the same time the region sets the circularity agenda that the rest of the world trades into: rules governing recycled plastics in food contact materials, plastic packaging taxes in the United Kingdom, Spain and Italy, and modulated producer responsibility fees that reward recyclable design. Demand is mature, so growth is slow. The opportunity is in recycled and certified-circular grades, where regulation guarantees buyers that no other region can match in reliability.
Which Region Leads the Plastic Resins Market?
Asia Pacific leads with 51.8% of global demand in 2026, consuming more resin than every other region combined. China alone accounts for the largest national share, with integrated refinery-to-polymer complexes, coal-to-olefins capacity and the world’s deepest converting base. India is the fastest-expanding large consumer, supported by packaging, pipe and automotive demand. Japan, Korea, Taiwan, Thailand, Indonesia and Vietnam contribute both production and consumption. Leadership rests on manufacturing concentration: most of the world’s packaged goods, appliances, electronics and textiles are made here, so the resin is consumed where the converting happens. The region is also the main source of oversupply, because capacity additions continued through a period of slower domestic demand. That combination makes it simultaneously the largest market and the principal reason global polymer margins remain compressed.
Latin America Balances Local Production Against Rising Import Pressure
Latin America represented 6.3% of demand in 2026, led by Brazil and Mexico with Argentina, Colombia and Chile following. The region has genuine polymer production, including polyolefin and polyvinyl chloride capacity, but local producers face sustained competition from low-cost imports that arrive at prices domestic naphtha-based plants struggle to meet. Demand is solid, supported by food packaging, agriculture, construction and nearshored manufacturing serving United States customers. Barriers are mainly economic: currency volatility, the cost of capital for petrochemical investment, and uneven waste collection infrastructure that limits recyclate supply. Trade remedy actions on imported resin have become a recurring feature. The most significant regional change is agricultural film and irrigation demand, which grows with export crop production and increasingly carries collection and recycling obligations that create a domestic recyclate stream.
Which Region Is Growing Fastest in the Plastic Resins Market?
Middle East & Africa is growing fastest at a 4.2% CAGR between 2026 and 2033, from an 8.1% share in 2026. Two separate dynamics combine. Saudi Arabia, the United Arab Emirates and Qatar hold cheap gas feedstock and have built world-scale polyolefin capacity aimed largely at export, with further downstream converting now being added to retain value locally. Meanwhile consumption across the continent rises from a low per-capita base as packaged food, construction and water infrastructure expand in Egypt, Nigeria, Kenya and South Africa. Barriers are substantial: waste collection systems are underdeveloped, industrial power is unreliable in several markets, and project finance is expensive outside the Gulf. The clearest opportunity is import substitution, since much of the region still buys finished converted products that local capacity could supply.
Competitive Landscape
The plastic resins market is moderately concentrated at the top and fragmented below it. A group of integrated producers including Dow, LyondellBasell, ExxonMobil, SABIC, INEOS, BASF, Sinopec, Formosa Plastics Corporation, Chevron Phillips Chemical and TotalEnergies holds a large share of world capacity, yet hundreds of regional producers supply specific polymers and markets. Concentration varies sharply by resin: polycarbonate and polyamide have few suppliers, while polyvinyl chloride and polystyrene are widely produced. Consolidation in the current cycle takes the form of asset closures and portfolio exits rather than large transactions.
Competition in commodity grades reduces to delivered cost, which means feedstock position, cracker scale, energy price and logistics. Above that, producers compete on grade breadth, technical service, supply reliability and increasingly on certification: mass-balance accounting, food-contact approval for recycled material, and documented carbon footprints. Newer entrants come from outside the traditional industry, including waste management groups and chemical recycling ventures that enter from the feedstock end rather than the polymer end.
Strategic positioning now divides producers into two camps. Those with cheap feedstock defend volume and export aggressively through the trough. Those without are narrowing portfolios toward specialty, recycled and regulated-application grades where qualification protects margin, while closing subscale commodity assets.
The common thread across vendor strategy is preparation for obligation rather than pursuit of growth. Securing recyclate feedstock, obtaining certification, improving energy efficiency at existing crackers, and keeping capital flexible until global policy settles now matter as much as cost leadership. Partnership behaviour reflects that: producers increasingly work with waste management groups, converters and brand owners to lock in feedstock and offtake, because neither recycling economics nor regulatory scope can be solved by a polymer producer acting alone.
Plastic Resins Industry Leaders
- Dow
- LyondellBasell
- ExxonMobil
- SABIC
- INEOS
Recent Industry Developments
- December 2024: The fifth session of the United Nations intergovernmental negotiating committee on plastic pollution closed in Busan without agreement on a treaty text – leaving production limits and chemicals of concern unresolved for investors.
- January 2025: The European Union single-use plastics requirement for polyethylene terephthalate beverage bottles to contain at least 25% recycled plastic took effect – creating the first large block of legally obligated recyclate demand.
- August 2025: The resumed negotiating session in Geneva again ended without a final agreement on a global plastics instrument – extending planning uncertainty for capacity and recycling investment decisions.
- January 2026: The definitive phase of the European Union carbon border adjustment mechanism began, with certificate obligations for covered imports – keeping petrochemical producers’ exposure to future scope extension under active review.
Companies Covered in the Report
- Dow
- LyondellBasell
- ExxonMobil
- SABIC
- INEOS
- BASF
- Chevron Phillips Chemical
- Sinopec
- Formosa Plastics Corporation
- Borealis
- TotalEnergies
- Braskem
- Reliance Industries
- LG Chem
Plastic Resins Market Report Scope
This study covers virgin and recycled thermoplastic resins in primary form, including polyethylene, polypropylene, polyvinyl chloride, polystyrene, polyethylene terephthalate, styrenics and engineering thermoplastics sold into packaging, construction, automotive, electronics, consumer goods, agriculture and healthcare. Compounds, masterbatches, thermosets and elastomers are excluded and examined separately. The base year is 2025 and the forecast period runs from 2026 to 2033, expressed in US$ Billion.
| Metric | Value |
| Study Period | 2020–2033 |
| Market Size 2026 | US$ 655.0 Billion |
| Market Size 2033 | US$ 805.0 Billion |
| CAGR 2026–2033 | 3.0% |
| Absolute Dollar Opportunity | US$ 150.0 Billion |
| Largest Market | Asia Pacific (51.8% share, 2026) |
| Fastest-Growing Market | Middle East & Africa (4.2% CAGR) |
| Market Concentration | Medium |
| Major Players | Dow, LyondellBasell, ExxonMobil, SABIC, INEOS |
Resin Type
- Polyethylene (LDPE, LLDPE, HDPE)
- Polypropylene
- Polyvinyl Chloride
- Polystyrene and Expandable Polystyrene
- Polyethylene Terephthalate
- ABS and Other Styrenics
- Engineering Thermoplastics
Material Origin
- Virgin Resin
- Mechanically Recycled Resin
- Chemically Recycled Resin
End Use Industry
- Packaging
- Building and Construction
- Automotive and Transportation
- Electrical and Electronics
- Consumer Goods
- Agriculture
- Healthcare
Processing Method
- Extrusion
- Injection Molding
- Blow Molding
- Thermoforming
- Rotational Molding and Other
Regions
- North America
- Europe
- Asia Pacific
- Latin America
- Middle East & Africa
1. Executive Summary
1.1. Global Plastic Resins Market Snapshot
1.2. Future Projections, 2026-2033
1.3. Key Market Trends
1.4. Regional Snapshot
2. Market Overview
2.1. Market Definition and Scope
2.2. Historical Market Trends, 2020-2025
2.3. Market Dynamics
2.3.1. Drivers Impact Analysis
2.3.1.1. Packaging and Infrastructure Volume Keeps Resin Consumption Climbing
2.3.1.2. Statutory Recycled-Content Rules Create Obligated Demand for Recyclate
2.3.2. Restraints Impact Analysis
2.3.2.1. Capacity Additions Outran Demand and Depressed Polymer Margins
2.3.2.2. Recyclate Costs More Than Virgin and Policy Direction Remains Unsettled
2.3.3. Market Opportunities
2.3.3.1. Certified Circular and Chemically Recycled Grades Open a Premium Resin Pool
2.3.3.2. Healthcare, Infrastructure and Feedstock-Advantaged Capacity Carry the Margin
3. Global Plastic Resins Market Outlook, 2020-2033
3.1. Global Plastic Resins Market Outlook, by Resin Type, Value (US$ Billion), 2020-2033
3.1.1. Polyethylene (LDPE, LLDPE, HDPE)
3.1.2. Polypropylene
3.1.3. Polyvinyl Chloride
3.1.4. Polystyrene and Expandable Polystyrene
3.1.5. Polyethylene Terephthalate
3.1.6. ABS and Other Styrenics
3.1.7. Engineering Thermoplastics
3.2. Global Plastic Resins Market Outlook, by Material Origin, Value (US$ Billion), 2020-2033
3.2.1. Virgin Resin
3.2.2. Mechanically Recycled Resin
3.2.3. Chemically Recycled Resin
3.3. Global Plastic Resins Market Outlook, by End Use Industry, Value (US$ Billion), 2020-2033
3.3.1. Packaging
3.3.2. Building and Construction
3.3.3. Automotive and Transportation
3.3.4. Electrical and Electronics
3.3.5. Consumer Goods
3.3.6. Agriculture
3.3.7. Healthcare
3.4. Global Plastic Resins Market Outlook, by Processing Method, Value (US$ Billion), 2020-2033
3.4.1. Extrusion
3.4.2. Injection Molding
3.4.3. Blow Molding
3.4.4. Thermoforming
3.4.5. Rotational Molding and Other
3.5. Global Plastic Resins Market Outlook, by Region, Value (US$ Billion), 2020-2033
3.5.1. North America
3.5.2. Europe
3.5.3. Asia Pacific
3.5.4. Latin America
3.5.5. Middle East & Africa
4. North America Plastic Resins Market Outlook, 2020-2033
4.1. North America Plastic Resins Market Outlook, by Resin Type, Value (US$ Billion), 2020-2033
4.1.1. Polyethylene (LDPE, LLDPE, HDPE)
4.1.2. Polypropylene
4.1.3. Polyvinyl Chloride
4.1.4. Polystyrene and Expandable Polystyrene
4.1.5. Polyethylene Terephthalate
4.1.6. ABS and Other Styrenics
4.1.7. Engineering Thermoplastics
4.2. North America Plastic Resins Market Outlook, by Material Origin, Value (US$ Billion), 2020-2033
4.2.1. Virgin Resin
4.2.2. Mechanically Recycled Resin
4.2.3. Chemically Recycled Resin
4.3. North America Plastic Resins Market Outlook, by End Use Industry, Value (US$ Billion), 2020-2033
4.3.1. Packaging
4.3.2. Building and Construction
4.3.3. Automotive and Transportation
4.3.4. Electrical and Electronics
4.3.5. Consumer Goods
4.3.6. Agriculture
4.3.7. Healthcare
4.4. North America Plastic Resins Market Outlook, by Processing Method, Value (US$ Billion), 2020-2033
4.4.1. Extrusion
4.4.2. Injection Molding
4.4.3. Blow Molding
4.4.4. Thermoforming
4.4.5. Rotational Molding and Other
4.5. North America Plastic Resins Market Outlook, by Country, Value (US$ Billion), 2020-2033
4.5.1. United States Plastic Resins Market Outlook, by Resin Type, 2020-2033
4.5.2. United States Plastic Resins Market Outlook, by Material Origin, 2020-2033
4.5.3. United States Plastic Resins Market Outlook, by End Use Industry, 2020-2033
4.5.4. United States Plastic Resins Market Outlook, by Processing Method, 2020-2033
4.5.5. Mexico Plastic Resins Market Outlook, by Resin Type, 2020-2033
4.5.6. Mexico Plastic Resins Market Outlook, by Material Origin, 2020-2033
4.5.7. Mexico Plastic Resins Market Outlook, by End Use Industry, 2020-2033
4.5.8. Mexico Plastic Resins Market Outlook, by Processing Method, 2020-2033
4.5.9. Canada Plastic Resins Market Outlook, by Resin Type, 2020-2033
4.5.10. Canada Plastic Resins Market Outlook, by Material Origin, 2020-2033
4.5.11. Canada Plastic Resins Market Outlook, by End Use Industry, 2020-2033
4.5.12. Canada Plastic Resins Market Outlook, by Processing Method, 2020-2033
5. Europe Plastic Resins Market Outlook, 2020-2033
5.1. Europe Plastic Resins Market Outlook, by Resin Type, Value (US$ Billion), 2020-2033
5.1.1. Polyethylene (LDPE, LLDPE, HDPE)
5.1.2. Polypropylene
5.1.3. Polyvinyl Chloride
5.1.4. Polystyrene and Expandable Polystyrene
5.1.5. Polyethylene Terephthalate
5.1.6. ABS and Other Styrenics
5.1.7. Engineering Thermoplastics
5.2. Europe Plastic Resins Market Outlook, by Material Origin, Value (US$ Billion), 2020-2033
5.2.1. Virgin Resin
5.2.2. Mechanically Recycled Resin
5.2.3. Chemically Recycled Resin
5.3. Europe Plastic Resins Market Outlook, by End Use Industry, Value (US$ Billion), 2020-2033
5.3.1. Packaging
5.3.2. Building and Construction
5.3.3. Automotive and Transportation
5.3.4. Electrical and Electronics
5.3.5. Consumer Goods
5.3.6. Agriculture
5.3.7. Healthcare
5.4. Europe Plastic Resins Market Outlook, by Processing Method, Value (US$ Billion), 2020-2033
5.4.1. Extrusion
5.4.2. Injection Molding
5.4.3. Blow Molding
5.4.4. Thermoforming
5.4.5. Rotational Molding and Other
5.5. Europe Plastic Resins Market Outlook, by Country, Value (US$ Billion), 2020-2033
5.5.1. Germany Plastic Resins Market Outlook, by Resin Type, 2020-2033
5.5.2. Germany Plastic Resins Market Outlook, by Material Origin, 2020-2033
5.5.3. Germany Plastic Resins Market Outlook, by End Use Industry, 2020-2033
5.5.4. Germany Plastic Resins Market Outlook, by Processing Method, 2020-2033
5.5.5. Belgium Plastic Resins Market Outlook, by Resin Type, 2020-2033
5.5.6. Belgium Plastic Resins Market Outlook, by Material Origin, 2020-2033
5.5.7. Belgium Plastic Resins Market Outlook, by End Use Industry, 2020-2033
5.5.8. Belgium Plastic Resins Market Outlook, by Processing Method, 2020-2033
5.5.9. Netherlands Plastic Resins Market Outlook, by Resin Type, 2020-2033
5.5.10. Netherlands Plastic Resins Market Outlook, by Material Origin, 2020-2033
5.5.11. Netherlands Plastic Resins Market Outlook, by End Use Industry, 2020-2033
5.5.12. Netherlands Plastic Resins Market Outlook, by Processing Method, 2020-2033
5.5.13. Italy Plastic Resins Market Outlook, by Resin Type, 2020-2033
5.5.14. Italy Plastic Resins Market Outlook, by Material Origin, 2020-2033
5.5.15. Italy Plastic Resins Market Outlook, by End Use Industry, 2020-2033
5.5.16. Italy Plastic Resins Market Outlook, by Processing Method, 2020-2033
5.5.17. France Plastic Resins Market Outlook, by Resin Type, 2020-2033
5.5.18. France Plastic Resins Market Outlook, by Material Origin, 2020-2033
5.5.19. France Plastic Resins Market Outlook, by End Use Industry, 2020-2033
5.5.20. France Plastic Resins Market Outlook, by Processing Method, 2020-2033
5.5.21. United Kingdom Plastic Resins Market Outlook, by Resin Type, 2020-2033
5.5.22. United Kingdom Plastic Resins Market Outlook, by Material Origin, 2020-2033
5.5.23. United Kingdom Plastic Resins Market Outlook, by End Use Industry, 2020-2033
5.5.24. United Kingdom Plastic Resins Market Outlook, by Processing Method, 2020-2033
5.5.25. Spain Plastic Resins Market Outlook, by Resin Type, 2020-2033
5.5.26. Spain Plastic Resins Market Outlook, by Material Origin, 2020-2033
5.5.27. Spain Plastic Resins Market Outlook, by End Use Industry, 2020-2033
5.5.28. Spain Plastic Resins Market Outlook, by Processing Method, 2020-2033
6. Asia Pacific Plastic Resins Market Outlook, 2020-2033
6.1. Asia Pacific Plastic Resins Market Outlook, by Resin Type, Value (US$ Billion), 2020-2033
6.1.1. Polyethylene (LDPE, LLDPE, HDPE)
6.1.2. Polypropylene
6.1.3. Polyvinyl Chloride
6.1.4. Polystyrene and Expandable Polystyrene
6.1.5. Polyethylene Terephthalate
6.1.6. ABS and Other Styrenics
6.1.7. Engineering Thermoplastics
6.2. Asia Pacific Plastic Resins Market Outlook, by Material Origin, Value (US$ Billion), 2020-2033
6.2.1. Virgin Resin
6.2.2. Mechanically Recycled Resin
6.2.3. Chemically Recycled Resin
6.3. Asia Pacific Plastic Resins Market Outlook, by End Use Industry, Value (US$ Billion), 2020-2033
6.3.1. Packaging
6.3.2. Building and Construction
6.3.3. Automotive and Transportation
6.3.4. Electrical and Electronics
6.3.5. Consumer Goods
6.3.6. Agriculture
6.3.7. Healthcare
6.4. Asia Pacific Plastic Resins Market Outlook, by Processing Method, Value (US$ Billion), 2020-2033
6.4.1. Extrusion
6.4.2. Injection Molding
6.4.3. Blow Molding
6.4.4. Thermoforming
6.4.5. Rotational Molding and Other
6.5. Asia Pacific Plastic Resins Market Outlook, by Country, Value (US$ Billion), 2020-2033
6.5.1. China Plastic Resins Market Outlook, by Resin Type, 2020-2033
6.5.2. China Plastic Resins Market Outlook, by Material Origin, 2020-2033
6.5.3. China Plastic Resins Market Outlook, by End Use Industry, 2020-2033
6.5.4. China Plastic Resins Market Outlook, by Processing Method, 2020-2033
6.5.5. India Plastic Resins Market Outlook, by Resin Type, 2020-2033
6.5.6. India Plastic Resins Market Outlook, by Material Origin, 2020-2033
6.5.7. India Plastic Resins Market Outlook, by End Use Industry, 2020-2033
6.5.8. India Plastic Resins Market Outlook, by Processing Method, 2020-2033
6.5.9. Japan Plastic Resins Market Outlook, by Resin Type, 2020-2033
6.5.10. Japan Plastic Resins Market Outlook, by Material Origin, 2020-2033
6.5.11. Japan Plastic Resins Market Outlook, by End Use Industry, 2020-2033
6.5.12. Japan Plastic Resins Market Outlook, by Processing Method, 2020-2033
6.5.13. Korea Plastic Resins Market Outlook, by Resin Type, 2020-2033
6.5.14. Korea Plastic Resins Market Outlook, by Material Origin, 2020-2033
6.5.15. Korea Plastic Resins Market Outlook, by End Use Industry, 2020-2033
6.5.16. Korea Plastic Resins Market Outlook, by Processing Method, 2020-2033
6.5.17. Taiwan Plastic Resins Market Outlook, by Resin Type, 2020-2033
6.5.18. Taiwan Plastic Resins Market Outlook, by Material Origin, 2020-2033
6.5.19. Taiwan Plastic Resins Market Outlook, by End Use Industry, 2020-2033
6.5.20. Taiwan Plastic Resins Market Outlook, by Processing Method, 2020-2033
6.5.21. Thailand Plastic Resins Market Outlook, by Resin Type, 2020-2033
6.5.22. Thailand Plastic Resins Market Outlook, by Material Origin, 2020-2033
6.5.23. Thailand Plastic Resins Market Outlook, by End Use Industry, 2020-2033
6.5.24. Thailand Plastic Resins Market Outlook, by Processing Method, 2020-2033
6.5.25. Indonesia Plastic Resins Market Outlook, by Resin Type, 2020-2033
6.5.26. Indonesia Plastic Resins Market Outlook, by Material Origin, 2020-2033
6.5.27. Indonesia Plastic Resins Market Outlook, by End Use Industry, 2020-2033
6.5.28. Indonesia Plastic Resins Market Outlook, by Processing Method, 2020-2033
6.5.29. Vietnam Plastic Resins Market Outlook, by Resin Type, 2020-2033
6.5.30. Vietnam Plastic Resins Market Outlook, by Material Origin, 2020-2033
6.5.31. Vietnam Plastic Resins Market Outlook, by End Use Industry, 2020-2033
6.5.32. Vietnam Plastic Resins Market Outlook, by Processing Method, 2020-2033
7. Latin America Plastic Resins Market Outlook, 2020-2033
7.1. Latin America Plastic Resins Market Outlook, by Resin Type, Value (US$ Billion), 2020-2033
7.1.1. Polyethylene (LDPE, LLDPE, HDPE)
7.1.2. Polypropylene
7.1.3. Polyvinyl Chloride
7.1.4. Polystyrene and Expandable Polystyrene
7.1.5. Polyethylene Terephthalate
7.1.6. ABS and Other Styrenics
7.1.7. Engineering Thermoplastics
7.2. Latin America Plastic Resins Market Outlook, by Material Origin, Value (US$ Billion), 2020-2033
7.2.1. Virgin Resin
7.2.2. Mechanically Recycled Resin
7.2.3. Chemically Recycled Resin
7.3. Latin America Plastic Resins Market Outlook, by End Use Industry, Value (US$ Billion), 2020-2033
7.3.1. Packaging
7.3.2. Building and Construction
7.3.3. Automotive and Transportation
7.3.4. Electrical and Electronics
7.3.5. Consumer Goods
7.3.6. Agriculture
7.3.7. Healthcare
7.4. Latin America Plastic Resins Market Outlook, by Processing Method, Value (US$ Billion), 2020-2033
7.4.1. Extrusion
7.4.2. Injection Molding
7.4.3. Blow Molding
7.4.4. Thermoforming
7.4.5. Rotational Molding and Other
7.5. Latin America Plastic Resins Market Outlook, by Country, Value (US$ Billion), 2020-2033
7.5.1. Brazil Plastic Resins Market Outlook, by Resin Type, 2020-2033
7.5.2. Brazil Plastic Resins Market Outlook, by Material Origin, 2020-2033
7.5.3. Brazil Plastic Resins Market Outlook, by End Use Industry, 2020-2033
7.5.4. Brazil Plastic Resins Market Outlook, by Processing Method, 2020-2033
7.5.5. Mexico Plastic Resins Market Outlook, by Resin Type, 2020-2033
7.5.6. Mexico Plastic Resins Market Outlook, by Material Origin, 2020-2033
7.5.7. Mexico Plastic Resins Market Outlook, by End Use Industry, 2020-2033
7.5.8. Mexico Plastic Resins Market Outlook, by Processing Method, 2020-2033
7.5.9. Argentina Plastic Resins Market Outlook, by Resin Type, 2020-2033
7.5.10. Argentina Plastic Resins Market Outlook, by Material Origin, 2020-2033
7.5.11. Argentina Plastic Resins Market Outlook, by End Use Industry, 2020-2033
7.5.12. Argentina Plastic Resins Market Outlook, by Processing Method, 2020-2033
7.5.13. Colombia Plastic Resins Market Outlook, by Resin Type, 2020-2033
7.5.14. Colombia Plastic Resins Market Outlook, by Material Origin, 2020-2033
7.5.15. Colombia Plastic Resins Market Outlook, by End Use Industry, 2020-2033
7.5.16. Colombia Plastic Resins Market Outlook, by Processing Method, 2020-2033
7.5.17. Chile Plastic Resins Market Outlook, by Resin Type, 2020-2033
7.5.18. Chile Plastic Resins Market Outlook, by Material Origin, 2020-2033
7.5.19. Chile Plastic Resins Market Outlook, by End Use Industry, 2020-2033
7.5.20. Chile Plastic Resins Market Outlook, by Processing Method, 2020-2033
8. Middle East & Africa Plastic Resins Market Outlook, 2020-2033
8.1. Middle East & Africa Plastic Resins Market Outlook, by Resin Type, Value (US$ Billion), 2020-2033
8.1.1. Polyethylene (LDPE, LLDPE, HDPE)
8.1.2. Polypropylene
8.1.3. Polyvinyl Chloride
8.1.4. Polystyrene and Expandable Polystyrene
8.1.5. Polyethylene Terephthalate
8.1.6. ABS and Other Styrenics
8.1.7. Engineering Thermoplastics
8.2. Middle East & Africa Plastic Resins Market Outlook, by Material Origin, Value (US$ Billion), 2020-2033
8.2.1. Virgin Resin
8.2.2. Mechanically Recycled Resin
8.2.3. Chemically Recycled Resin
8.3. Middle East & Africa Plastic Resins Market Outlook, by End Use Industry, Value (US$ Billion), 2020-2033
8.3.1. Packaging
8.3.2. Building and Construction
8.3.3. Automotive and Transportation
8.3.4. Electrical and Electronics
8.3.5. Consumer Goods
8.3.6. Agriculture
8.3.7. Healthcare
8.4. Middle East & Africa Plastic Resins Market Outlook, by Processing Method, Value (US$ Billion), 2020-2033
8.4.1. Extrusion
8.4.2. Injection Molding
8.4.3. Blow Molding
8.4.4. Thermoforming
8.4.5. Rotational Molding and Other
8.5. Middle East & Africa Plastic Resins Market Outlook, by Country and Subregion, Value (US$ Billion), 2020-2033
8.5.1. Saudi Arabia Plastic Resins Market Outlook, by Resin Type, 2020-2033
8.5.2. Saudi Arabia Plastic Resins Market Outlook, by Material Origin, 2020-2033
8.5.3. Saudi Arabia Plastic Resins Market Outlook, by End Use Industry, 2020-2033
8.5.4. Saudi Arabia Plastic Resins Market Outlook, by Processing Method, 2020-2033
8.5.5. United Arab Emirates Plastic Resins Market Outlook, by Resin Type, 2020-2033
8.5.6. United Arab Emirates Plastic Resins Market Outlook, by Material Origin, 2020-2033
8.5.7. United Arab Emirates Plastic Resins Market Outlook, by End Use Industry, 2020-2033
8.5.8. United Arab Emirates Plastic Resins Market Outlook, by Processing Method, 2020-2033
8.5.9. Qatar Plastic Resins Market Outlook, by Resin Type, 2020-2033
8.5.10. Qatar Plastic Resins Market Outlook, by Material Origin, 2020-2033
8.5.11. Qatar Plastic Resins Market Outlook, by End Use Industry, 2020-2033
8.5.12. Qatar Plastic Resins Market Outlook, by Processing Method, 2020-2033
8.5.13. Egypt Plastic Resins Market Outlook, by Resin Type, 2020-2033
8.5.14. Egypt Plastic Resins Market Outlook, by Material Origin, 2020-2033
8.5.15. Egypt Plastic Resins Market Outlook, by End Use Industry, 2020-2033
8.5.16. Egypt Plastic Resins Market Outlook, by Processing Method, 2020-2033
8.5.17. Nigeria Plastic Resins Market Outlook, by Resin Type, 2020-2033
8.5.18. Nigeria Plastic Resins Market Outlook, by Material Origin, 2020-2033
8.5.19. Nigeria Plastic Resins Market Outlook, by End Use Industry, 2020-2033
8.5.20. Nigeria Plastic Resins Market Outlook, by Processing Method, 2020-2033
8.5.21. Kenya Plastic Resins Market Outlook, by Resin Type, 2020-2033
8.5.22. Kenya Plastic Resins Market Outlook, by Material Origin, 2020-2033
8.5.23. Kenya Plastic Resins Market Outlook, by End Use Industry, 2020-2033
8.5.24. Kenya Plastic Resins Market Outlook, by Processing Method, 2020-2033
8.5.25. South Africa Plastic Resins Market Outlook, by Resin Type, 2020-2033
8.5.26. South Africa Plastic Resins Market Outlook, by Material Origin, 2020-2033
8.5.27. South Africa Plastic Resins Market Outlook, by End Use Industry, 2020-2033
8.5.28. South Africa Plastic Resins Market Outlook, by Processing Method, 2020-2033
8.5.29. Gulf Plastic Resins Market Outlook, by Resin Type, 2020-2033
8.5.30. Gulf Plastic Resins Market Outlook, by Material Origin, 2020-2033
8.5.31. Gulf Plastic Resins Market Outlook, by End Use Industry, 2020-2033
8.5.32. Gulf Plastic Resins Market Outlook, by Processing Method, 2020-2033
9. Competitive Landscape
9.1. Industry Leaders
9.2. Recent Industry Developments
9.3. Company Profiles
9.3.1. Dow
9.3.2. LyondellBasell
9.3.3. ExxonMobil
9.3.4. SABIC
9.3.5. INEOS
9.3.6. BASF
9.3.7. Chevron Phillips Chemical
9.3.8. Sinopec
9.3.9. Formosa Plastics Corporation
9.3.10. Borealis
9.3.11. TotalEnergies
9.3.12. Braskem
9.3.13. Reliance Industries
9.3.14. LG Chem
10. Appendix
10.1. Research Methodology
10.2. Report Assumptions
10.3. Acronyms and Abbreviations
| Segment | Categories |
| Resin Type | Polyethylene (LDPE, LLDPE, HDPE), Polypropylene, Polyvinyl Chloride, Polystyrene and Expandable Polystyrene, Polyethylene Terephthalate, ABS and Other Styrenics, Engineering Thermoplastics |
| Material Origin | Virgin Resin, Mechanically Recycled Resin, Chemically Recycled Resin |
| End Use Industry | Packaging, Building and Construction, Automotive and Transportation, Electrical and Electronics, Consumer Goods, Agriculture, Healthcare |
| Processing Method | Extrusion, Injection Molding, Blow Molding, Thermoforming, Rotational Molding and Other |
| Regions | North America, Europe, Asia Pacific, Latin America, Middle East & Africa |
Our Research Methodology
Considering the volatility of business today, traditional approaches to strategizing a game plan can be unfruitful if not detrimental. True ambiguity is no way to determine a forecast. A myriad of predetermined factors must be accounted for such as the degree of risk involved, the magnitude of circumstances, as well as conditions or consequences that are not known or unpredictable. To circumvent binary views that cast uncertainty, the application of market research intelligence to strategically posture, move, and enable actionable outcomes is necessary.
View Methodology
Quality Assured
Rigorous Validation Process

Confidentiality Assured
End-to-end Data Security

Custom Research Services
Tailored To Your Objectives
FAQs
The market is valued at US$ 655.0 billion in 2026, counting virgin and recycled thermoplastic resins supplied in primary form worldwide.
Value is projected to reach US$ 805.0 billion by 2033 at a 3.0% CAGR, adding US$ 150.0 billion in absolute opportunity.
Polyethylene leads with 29.8% of the market in 2026, consumed across film, bottles, pipe and cable applications in every region.
Healthcare grows fastest at a 4.0% CAGR, driven by single-use devices, sterile barrier packaging and diagnostics consumables requiring documented resin grades.
Concentration is medium; a group of integrated producers holds most capacity, while hundreds of regional suppliers serve specific polymers and markets.
Related Reports
Polytetrafluoroethylene Market Size, Share, Insights, Competitive Landscape, and Forecast 2026 to 2033
The global polytetrafluoroethylene market is valued at US$4.3 billion in 2026, reaching US$6.1 billion by 2033, growing at a 5.1% CAGR
Detergent Chemicals Market Size, Share, Insights, Competitive Landscape, and Forecast 2026 to 2033
The detergent chemicals market is forecast to grow from US$ 72.0 billion in 2026 to US$ 99.3 billion by 2033 at a 4.7% CAGR.
Aviation Carbon Fiber Market Size, Share, Insights, Competitive Landscape, and Forecast 2026 to 2033
The aviation carbon fiber market is forecast to reach US$ 5.10 billion by 2033 from US$ 2.65 billion in 2026, growing at a 9.8% CAGR.
Transportation Composites Market Size, Share, Insights, Competitive Landscape, and Forecast 2026 to 2033
The global transportation composites market is valued at US$48.6 billion in 2026, reaching US$78.5 billion by 2033, growing at a 7.1% CAGR
Tamper Evident Packaging Market Size, Share, Insights, Competitive Landscape, and Forecast 2026 to 2033
The global tamper evident packaging market is valued at US$18.5 billion in 2026, reaching US$26.9 billion by 2033, growing at a 5.5% CAGR
Personal Care Ingredients Market Size, Share, Insights, Competitive Landscape, and Forecast 2026 to 2033
The global personal care ingredients market is valued at US$18.6 billion in 2026, reaching US$28.2 billion by 2033, growing at a 6.1% CAGR