



Western Blotting Market
Western Blotting Market Size, Share, Insights, Competitive Landscape, and Forecast 2026 to 2033
Western Blotting Market Size and Trend Analysis
How Big Is the Western Blotting Market in 2026?
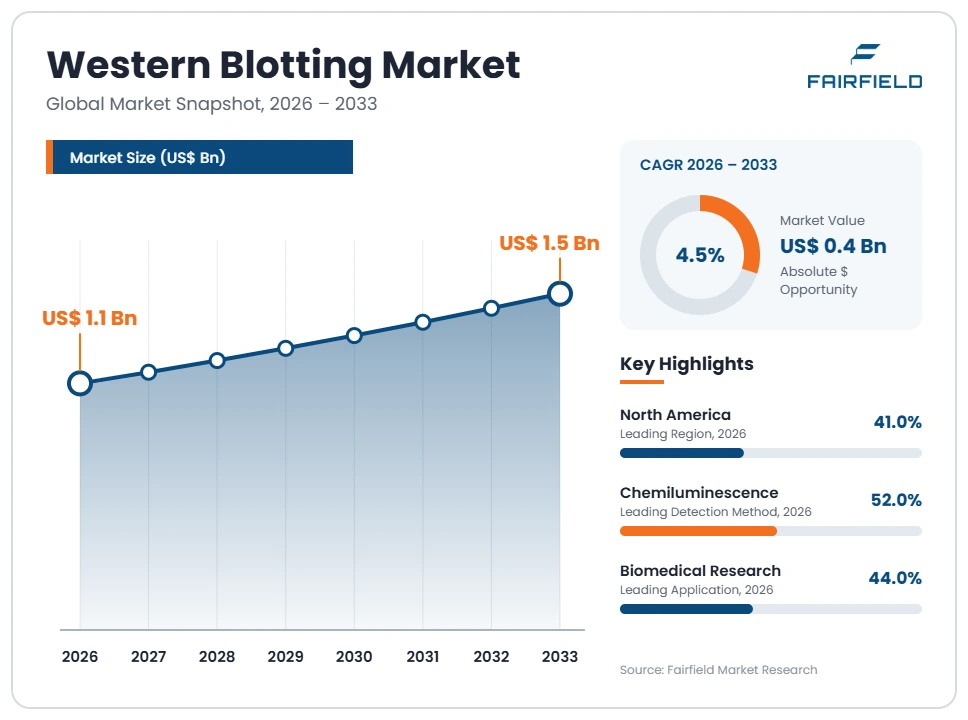
The global Western Blotting market size is expected to be valued at US$ 1.1 billion in 2026 and projected to reach US$ 1.5 billion by 2033, growing at a CAGR of 4.5% between 2026 and 2033.
The market grew at roughly 3.6% annually between 2020 and 2025, as pandemic-era research spending faded and academic budgets flattened. Three forces now set the pace. Biopharmaceutical developers rely on immunoblotting for identity confirmation, host cell protein work and comparability studies under Good Laboratory Practice and GMP quality systems. Funders and publishers demand reproducible protein detection data, pushing laboratories toward validated antibodies and quantitative fluorescent detection. Automated and capillary-based platforms are absorbing work that manual gels once handled. Revenue sits overwhelmingly in consumables and antibodies rather than instruments, so the direction of travel is mix shift and premium pricing rather than volume expansion. Bench-scale manual blotting is flat to declining in mature laboratories.
Key Report Takeaways
- By Product Type: Consumables and Reagents held 41% share in 2026, while Antibodies are projected to expand at a 5.9% CAGR through 2033, driven by laboratory consolidation on recombinant clones carrying published knockout validation evidence.
- By Detection Method: Chemiluminescence held 52% share in 2026, while Fluorescence is projected to expand at a 6.6% CAGR through 2033, driven by multiplexing of target and loading control on a single membrane.
- By Application: Biomedical Research held 44% share in 2026, while Biopharmaceutical Characterisation and Quality Control is projected to expand at a 7.0% CAGR through 2033, driven by biosimilar comparability and impurity testing workloads.
- By End User: Academic and Research Institutes held 36% share in 2026, while Contract Research Organisations are projected to expand at a 6.5% CAGR through 2033, driven by sponsors outsourcing validated assay execution to accredited laboratories.
- By Geography: North America held 41% share in 2026, while Asia Pacific is projected to expand at a 6.8% CAGR through 2033, driven by contract research capacity additions and domestic reagent manufacturing in China and India.
Global Western Blotting Market Trends and Insights
Drivers Impact Analysis
Two forces explain most of the forecast growth in immunoblotting consumables and instruments.
| Driver | Impact on CAGR Forecast | Geographic Relevance | Impact Timeline |
| Reproducibility and antibody validation requirements in publicly funded research | Medium | North America, Europe | Medium term (2–4 years) |
| Regulated biopharmaceutical characterisation and release testing workloads | High | North America, Europe, Asia Pacific | Long term (≥4 years) |
Reproducibility Rules in Funded Research Shift Western Blotting Spend Toward Validated Antibodies
Reproducibility requirements now shape reagent purchasing more than list price does. The National Institutes of Health applied rigour and transparency criteria to grant applications from 2016, and reviewers expect authentication of key biological resources. Journals reinforce this by requesting uncropped full-length blots and by screening submitted figures for image duplication. Laboratories answer by buying better-characterised reagents rather than cheaper ones.
The mechanism runs from publication risk to reagent spend. A rejected or corrected figure costs far more than a validated antibody, so investigators consolidate orders with suppliers that publish specificity evidence. The International Working Group for Antibody Validation set out five conceptual validation pillars, and the YCharOS open science initiative has characterised widely used antibodies against knockout cell lines. Both push demand toward lot-traceable recombinant clones, lifting average selling prices even where membrane volumes stay flat.
Biopharmaceutical Release and Comparability Testing Anchors Regulated Western Blotting Volumes
Regulated manufacturing provides the most durable demand in this market. Biologics developers use immunoblotting to confirm identity, detect truncated or aggregated species and support host cell protein assays during characterisation. These assays run inside GMP and Good Laboratory Practice quality systems, so protocols, reagent lots and imaging records are locked and revalidated rather than improvised. That rigidity converts a single approved method into years of repeat consumable purchasing.
The underlying driver is pipeline composition. Monoclonal antibodies, fusion proteins, cell therapies and biosimilars all require comparability packages when processes or sites change. Analytical procedure expectations set out in ICH Q2(R2) and ICH Q14 push sponsors to justify method performance formally, which favours documented instruments, precast gels and validated detection chemistries. Contract manufacturers and quality control laboratories therefore buy standardised kits and imaging systems with audit trails, at higher margins than academic equivalents.
Restraints Impact Analysis
Two structural limits hold the growth rate of this protein detection market below the wider life science tools average.
| Restraint | Impact on CAGR Forecast | Geographic Relevance | Impact Timeline |
| Semi-quantitative performance and documented antibody non-specificity | High | Global | Short term (≤2 years) |
| Substitution by automated immunoassay and mass spectrometry platforms | Medium | North America, Europe | Long term (≥4 years) |
Semi-Quantitative Output and Antibody Non-Specificity Limit Western Blotting in Decision-Grade Work
Technical limitations keep immunoblotting out of applications that command premium pricing. The method is semi-quantitative, with results sensitive to transfer efficiency, blocking conditions, exposure time and normalisation choice. Independent characterisation studies have repeatedly found that a substantial share of commercial antibodies fail specificity testing against knockout controls. Laboratories that need defensible numbers increasingly route those assays elsewhere.
The cause is distributed across the workflow rather than concentrated in one component. Polyclonal antisera vary between bleeds, so lot-to-lot performance drifts; chemiluminescent signal saturates, compressing the dynamic range at high abundance; and housekeeping protein normalisation can fail when treatment alters the reference target. Each correction, including stain-free total protein normalisation and recombinant antibody adoption, raises cost per lane. For laboratories under flat funding, that cost pressure suppresses the number of blots run rather than improving them.
Automated Immunoassay and Mass Spectrometry Alternatives Erode Manual Western Blotting Workloads
Substitution is the clearest long-term constraint on manual blotting demand. ELISA delivers true quantitation with far higher throughput for established targets. Targeted mass spectrometry provides sequence-level confidence without antibody dependence. Capillary electrophoresis immunoassays automate separation, immunoprobing and detection in one cartridge. Each alternative removes a category of work from the gel bench.
The economics explain the shift. A manual blot consumes one to two days of skilled technician time across casting, running, transfer, blocking, incubation and imaging, and failed runs must be repeated in full. Labour, not reagent cost, dominates. Automated platforms compress that to a few hours of unattended operation with standardised reporting, which matters most in pharmaceutical quality control and contract research where staff capacity is the binding constraint. Mature laboratories therefore reserve manual blotting for exploratory and low-volume confirmatory work.
Market Opportunities
Growth is concentrated in two revenue pools that sit outside conventional manual bench workflows.
Automated and Capillary Western Platforms Open an Instrument and Service Revenue Pool
Automation creates the largest untapped revenue pool in this market. Capillary western systems, automated membrane processors and walk-away imaging stations convert a labour-intensive manual protocol into an instrument placement with a recurring cartridge or reagent stream. The attached software licence, qualification service and annual maintenance contract extend the revenue beyond the hardware sale, which is attractive in a market where instrument units grow slowly.
Vendors with installed chromatography and imaging footprints are best placed to capture this. Demand originates with biopharmaceutical quality control groups, contract research organisations and large translational cores that run the same assay hundreds of times. Regulatory expectations for documented analytical procedures favour systems producing audit-ready electronic records. Pricing power follows, because a validated cartridge cannot be substituted mid-programme without a comparability exercise, making the consumable stream unusually defensible.
Knockout-Validated Recombinant Antibody Catalogues Create a Premium Reagent Pool
Validated antibodies represent a premium reagent pool that barely existed a decade ago. Suppliers that publish knockout, orthogonal or independent-antibody evidence can price well above catalogue polyclonals, because the buyer is purchasing avoided experimental failure rather than a protein. Recombinant production also removes animal-to-animal variability, enabling the lot consistency that regulated users require and that reviewers increasingly expect to see documented.
The customer base is broad but the margin sits with regulated and high-visibility users. Pharmaceutical discovery groups, core facilities and journals-facing academic laboratories drive the switch, while contract research organisations standardise on validated clones to protect client deliverables. Open characterisation work by the YCharOS consortium and the validation framework from the International Working Group for Antibody Validation supply the public evidence base. Suppliers that publish rather than assert specificity gain share in a crowded reagent catalogue.
Segment Analysis
- By Product Type: Consumables and Reagents Lead While Antibodies Accelerate
Consumables and Reagents held 41% of revenue in 2026, because gels, membranes, buffers, blocking agents and chemiluminescent substrates are consumed on every run and repurchased continuously. Precast gels and transfer cassettes have displaced hand-cast systems in most funded laboratories, raising spend per experiment. Instruments contributed 23%, with electrophoresis tanks, transfer units and digital imagers replaced only on long cycles, while Software and Services accounted for 6%.
Antibodies are the fastest-growing product line at a 5.9% CAGR to 2033, holding 30% share. Growth comes from the switch to recombinant, knockout-validated clones that carry documented specificity data and consistent lot performance. The business implication is clear: revenue growth is a price and mix story. Vendors competing only on instrument placement will underperform suppliers that own the validated reagent and secondary antibody catalogue attached to each installed base.
- By Detection Method: Chemiluminescence Dominates as Fluorescence Gains Ground
Chemiluminescence accounted for 52% of detection revenue in 2026, reflecting its sensitivity, low instrument cost and deep protocol familiarity across academic and clinical research laboratories. Enhanced chemiluminescent substrates detect low-abundance targets on standard membranes, and film-free digital imagers have extended the format’s life. Colorimetric detection retains a modest share in teaching and screening work, while radioactive detection continues to decline on handling and disposal grounds.
Fluorescent detection is expanding fastest at a 6.6% CAGR through 2033. Near-infrared and multiplexed fluorescent substrates allow a target and its loading control to be measured on the same membrane without stripping and reprobing, which removes a major source of quantitative error. Journals and funders that ask for quantitative evidence favour this approach. For vendors, the shift pulls revenue toward higher-value imaging hardware and the fluorophore-conjugated secondary antibodies that only work with it.
- By Application: Biomedical Research Holds Scale While Biopharmaceutical Quality Work Grows Quickest
Biomedical Research represented 44% of applications in 2026, supported by signalling, neuroscience, oncology and immunology laboratories that use immunoblotting to confirm protein expression and post-translational modification. The technique remains the accepted confirmatory assay in thousands of publications each year, which sustains volume even as alternatives take routine quantitation. Disease Diagnostics contributed a smaller share, concentrated in confirmatory serology and a narrow band of specialist tests, and Agriculture and Food Testing remains niche.
Biopharmaceutical Characterisation and Quality Control is growing fastest at a 7.0% CAGR to 2033. Biosimilar comparability, host cell protein monitoring, identity testing and cell therapy characterisation all generate repeat, protocol-locked blot volumes inside regulated quality systems. The implication for suppliers is that growth favours products built for audit: documented reagent lots, qualified instruments and traceable imaging records rather than flexible research-grade kits.
- By End User: Academic Laboratories Remain the Base as Contract Research Organisations Expand
Academic and Research Institutes held 36% of end user revenue in 2026, the largest single block, because university and institute laboratories operate the broadest installed base of electrophoresis and transfer equipment. Their purchasing is price-sensitive and tied to grant cycles, so unit volumes are large but spend per laboratory is modest. Pharmaceutical and Biotechnology Companies followed at 34%, buying fewer but far more expensive validated systems and reagent packages.
Contract Research Organisations are the fastest-growing end user at a 6.5% CAGR through 2033. Sponsors increasingly outsource characterisation and bioanalytical work to accredited laboratories that can run validated assays at scale and absorb audit exposure. Hospitals and Diagnostic Laboratories make up the remainder. The commercial consequence is a gradual concentration of purchasing power: fewer, larger buyers negotiating multi-year reagent supply agreements rather than thousands of individual catalogue orders.
Geography Analysis
- Which Region Is Leading the Western Blotting Market?
North America leads the western blot market with 41% revenue share in 2026, growing at about 3.6% annually to 2033. The United States supplies most of that value through National Institutes of Health funded research, a dense concentration of biologics manufacturers and the headquarters of several major reagent and imaging suppliers. Canada adds strength in open science antibody characterisation. Federal expectations for rigour, transparency and data sharing have made validated reagents a procurement requirement rather than a preference, which raises revenue per experiment even where experiment counts are flat.
The binding constraint is funding. Flat federal research budgets and cautious biotechnology capital have slowed instrument replacement cycles, so suppliers depend on consumables and antibodies for growth. The clearest regional opportunity is conversion of manual quality control workflows in biologics plants to automated, audit-ready platforms.
- Europe Sustains Demand Through Biosimilar Manufacturing and Shared Core Facilities
Europe held 28% of revenue in 2026 and is forecast to grow near 3.9% annually through 2033. Germany, the United Kingdom, France, Switzerland and Ireland account for most spending, combining public research funding with the continent’s large biosimilar and contract manufacturing base. Centralised core facilities at major institutes concentrate purchasing, favouring suppliers that can service shared imaging platforms and supply qualified consumables across multiple user groups.
Regulatory and publishing culture reinforces quality over volume. Institutional open access mandates and journal image-integrity screening have made full-membrane documentation standard practice, supporting demand for digital imagers over film. Price pressure from public tendering limits margin on commodity gels and membranes. The growth opening lies in validated recombinant antibodies and in quality control blotting tied to biosimilar comparability programmes, where buyers accept premium pricing for documented specificity.
- Which Region Is Growing Fastest in the Western Blotting Market?
Asia Pacific is growing fastest at a 6.8% CAGR between 2026 and 2033, from 22% share in 2026. China drives the largest absolute gain through expanded academic capacity, a maturing biosimilar sector and a growing base of domestic reagent and instrument manufacturers that compete on price. India adds rapid contract research and contract manufacturing growth, while Japan and South Korea contribute high-value demand from established pharmaceutical quality control laboratories and Singapore anchors regional translational research.
Two mechanisms explain the pace. First, new laboratory construction means first-time instrument purchases rather than replacements, so hardware grows faster here than elsewhere. Second, export-oriented biologics manufacturers must satisfy stringent overseas regulators, which pulls them toward validated antibodies and qualified imaging systems. Local reagent substitution is the main risk to international suppliers’ pricing.
- Latin America Builds Research Capacity Against Import and Funding Constraints
Latin America accounted for 5% of revenue in 2026 and is projected to grow at about 5.0% annually through 2033. Brazil leads through public university systems, the Oswaldo Cruz Foundation network and a growing domestic biologics sector, with Mexico, Argentina, Chile and Colombia supplying the remainder. Clinical research activity and vaccine manufacturing investment have lifted demand for protein detection reagents in both academic and industrial laboratories.
Barriers are mainly commercial rather than scientific. Import duties, customs delays and currency volatility raise landed reagent costs, and cold chain gaps complicate antibody distribution outside major cities. Public research funding is volatile across budget cycles, which stalls instrument purchases. The clearest opportunity is regional distribution and local stockholding, which shortens lead times and makes validated antibody catalogues affordable to laboratories currently buying commodity alternatives.
- Middle East & Africa Expands From a Small Base as Research Infrastructure Matures
Middle East & Africa represented 4% of revenue in 2026, with growth near 4.8% annually to 2033. Saudi Arabia and the United Arab Emirates are investing heavily in biomedical research universities and hospital research institutes under national diversification programmes. Israel contributes disproportionate demand through its biotechnology sector, while South Africa, Egypt and Kenya anchor infectious disease and immunology research supported by international funders.
Constraints are structural. Few countries have the density of trained technicians or service engineers needed to support large installed bases, and antibody cold chain reliability varies widely outside major centres. Procurement often runs through slow public tenders. The growth opening is in centralised core facilities attached to new research universities and in infectious disease programmes, where donor funding supports instrument placement and multi-year reagent supply.
Competitive Landscape
The western blot market is moderately concentrated. A small group of diversified life science suppliers controls most instrument placements and a large share of consumables, while the antibody layer remains highly fragmented across hundreds of catalogue and specialist vendors. Bio-Rad Laboratories, Thermo Fisher Scientific, Merck KGaA, Bio-Techne Corporation and Cytiva hold the strongest combined positions across separation, transfer, detection and reagent supply. Consolidation has been steady rather than dramatic, with large suppliers acquiring antibody catalogues and automation specialists to attach recurring revenue to installed hardware.
Competition turns on four factors rather than price alone. The first is antibody specificity evidence, where published knockout or orthogonal validation now functions as a product feature. The second is workflow integration, linking gels, transfer devices, imagers and analysis software into a single validated chain. The third is regulatory readiness, including audit trails, electronic records and documented qualification for laboratories operating under GMP. The fourth is service coverage, which determines instrument uptime. New entrants compete mainly at the edges: automation specialists offering capillary immunoassays, open science consortia such as YCharOS publishing independent antibody characterisation, and regional reagent manufacturers in China and India undercutting catalogue pricing.
Strategic direction across the sector is consistent. Vendors are moving revenue away from one-off instrument sales toward recurring reagents, cartridges and software subscriptions. They are investing in recombinant antibody manufacturing to improve lot consistency, extending fluorescent and multiplexed detection portfolios, and positioning automated systems for regulated quality control rather than exploratory research. Suppliers are also publishing validation data more openly, recognising that documented specificity has become a purchasing criterion in funded and regulated laboratories alike.
Recent Industry Developments
- January 2016: The National Institutes of Health applied enhanced rigour and transparency requirements, including authentication of key biological resources, to research grant applications – making documented antibody validation a condition of competitive funding.
- September 2016: The International Working Group for Antibody Validation published five conceptual pillars for antibody validation – giving suppliers and journals a common framework for specificity evidence.
- August 2022: The White House Office of Science and Technology Policy issued public access guidance requiring federally funded research results to be freely available without embargo – increasing scrutiny of published blot images.
- January 2023: The National Institutes of Health Data Management and Sharing Policy took effect – obliging grantees to plan for sharing underlying data, including full-length membrane images.
- November 2023: The International Council for Harmonisation reached Step 4 on ICH Q2(R2) and ICH Q14 covering analytical procedure validation and development – raising documentation expectations for immunoblotting used in regulated release testing.
Companies Covered in the Report
- Bio-Rad Laboratories, Inc.
- Thermo Fisher Scientific Inc.
- Merck KGaA
- Bio-Techne Corporation
- Cytiva
- Abcam plc
- Cell Signaling Technology, Inc.
- Agilent Technologies, Inc.
- LI-COR Biosciences
- Azure Biosystems, Inc.
- Santa Cruz Biotechnology, Inc.
- Jackson ImmunoResearch Laboratories, Inc.
- Takara Bio Inc.
- Revvity, Inc.
Western Blotting Market Report Scope
| Metric | Value |
| Study Period | 2020–2033 |
| Market Size 2026 | US$ 1.1 Billion |
| Market Size 2033 | US$ 1.5 Billion |
| CAGR 2026–2033 | 4.5% |
| Absolute Dollar Opportunity | US$ 0.4 Billion |
| Largest Market | North America (41% share in 2026) |
| Fastest-Growing Market | Asia Pacific (6.8% CAGR) |
| Market Concentration | Medium |
| Major Players | Bio-Rad Laboratories, Thermo Fisher Scientific, Merck KGaA, Bio-Techne Corporation, Cytiva |
Western Blotting Market Segmentation
Product Type
- Consumables and Reagents
- Antibodies
- Instruments
- Software and Services
Detection Method
- Chemiluminescence
- Fluorescence
- Colorimetric
- Radioactive
Application
- Biomedical Research
- Disease Diagnostics
- Biopharmaceutical Characterisation and Quality Control
- Agriculture and Food Testing
End User
- Academic and Research Institutes
- Pharmaceutical and Biotechnology Companies
- Contract Research Organisations
- Hospitals and Diagnostic Laboratories
Regions
- North America
- Europe
- Asia Pacific
- Latin America
- Middle East & Africa
- Executive Summary
- Global Western Blotting Market Snapshot
- Future Projections
- Key Report Takeaways
- Regional Snapshot
- Market Overview
- Market Definition and Report Scope
- Historical Trends 2020–2025
- Market Dynamics
- Drivers
- Reproducibility Rules in Funded Research Shift Western Blotting Spend Toward Validated Antibodies
- Biopharmaceutical Release and Comparability Testing Anchors Regulated Western Blotting Volumes
- Restraints
- Semi-Quantitative Output and Antibody Non-Specificity Limit Western Blotting in Decision-Grade Work
- Automated Immunoassay and Mass Spectrometry Alternatives Erode Manual Western Blotting Workloads
- Market Opportunities
- Automated and Capillary Western Platforms Open an Instrument and Service Revenue Pool
- Knockout-Validated Recombinant Antibody Catalogues Create a Premium Reagent Pool
- Drivers
- Global Western Blotting Market Outlook, 2020–2033
- Global Western Blotting Market Outlook, by Product Type, Value (US$ Billion), 2020–2033
- Consumables and Reagents
- Antibodies
- Instruments
- Software and Services
- Global Western Blotting Market Outlook, by Detection Method, Value (US$ Billion), 2020–2033
- Chemiluminescence
- Fluorescence
- Colorimetric
- Radioactive
- Global Western Blotting Market Outlook, by Application, Value (US$ Billion), 2020–2033
- Biomedical Research
- Disease Diagnostics
- Biopharmaceutical Characterisation and Quality Control
- Agriculture and Food Testing
- Global Western Blotting Market Outlook, by End User, Value (US$ Billion), 2020–2033
- Academic and Research Institutes
- Pharmaceutical and Biotechnology Companies
- Contract Research Organisations
- Hospitals and Diagnostic Laboratories
- Global Western Blotting Market Outlook, by Region, Value (US$ Billion), 2020–2033
- North America
- Europe
- Asia Pacific
- Latin America
- Middle East & Africa
- Global Western Blotting Market Outlook, by Product Type, Value (US$ Billion), 2020–2033
- North America Western Blotting Market Outlook, 2020–2033
- North America Western Blotting Market Outlook, by Product Type, Value (US$ Billion), 2020–2033
- Consumables and Reagents
- Antibodies
- Instruments
- Software and Services
- North America Western Blotting Market Outlook, by Detection Method, Value (US$ Billion), 2020–2033
- Chemiluminescence
- Fluorescence
- Colorimetric
- Radioactive
- North America Western Blotting Market Outlook, by Application, Value (US$ Billion), 2020–2033
- Biomedical Research
- Disease Diagnostics
- Biopharmaceutical Characterisation and Quality Control
- Agriculture and Food Testing
- North America Western Blotting Market Outlook, by End User, Value (US$ Billion), 2020–2033
- Academic and Research Institutes
- Pharmaceutical and Biotechnology Companies
- Contract Research Organisations
- Hospitals and Diagnostic Laboratories
- North America Western Blotting Market Outlook, by Country, Value (US$ Billion), 2020–2033
- United States Western Blotting Market Outlook, by Product Type, 2020–2033
- United States Western Blotting Market Outlook, by Detection Method, 2020–2033
- United States Western Blotting Market Outlook, by Application, 2020–2033
- United States Western Blotting Market Outlook, by End User, 2020–2033
- Canada Western Blotting Market Outlook, by Product Type, 2020–2033
- Canada Western Blotting Market Outlook, by Detection Method, 2020–2033
- Canada Western Blotting Market Outlook, by Application, 2020–2033
- Canada Western Blotting Market Outlook, by End User, 2020–2033
- North America Western Blotting Market Outlook, by Product Type, Value (US$ Billion), 2020–2033
- Europe Western Blotting Market Outlook, 2020–2033
- Europe Western Blotting Market Outlook, by Product Type, Value (US$ Billion), 2020–2033
- Consumables and Reagents
- Antibodies
- Instruments
- Software and Services
- Europe Western Blotting Market Outlook, by Detection Method, Value (US$ Billion), 2020–2033
- Chemiluminescence
- Fluorescence
- Colorimetric
- Radioactive
- Europe Western Blotting Market Outlook, by Application, Value (US$ Billion), 2020–2033
- Biomedical Research
- Disease Diagnostics
- Biopharmaceutical Characterisation and Quality Control
- Agriculture and Food Testing
- Europe Western Blotting Market Outlook, by End User, Value (US$ Billion), 2020–2033
- Academic and Research Institutes
- Pharmaceutical and Biotechnology Companies
- Contract Research Organisations
- Hospitals and Diagnostic Laboratories
- Europe Western Blotting Market Outlook, by Country, Value (US$ Billion), 2020–2033
- Germany Western Blotting Market Outlook, by Product Type, 2020–2033
- Germany Western Blotting Market Outlook, by Detection Method, 2020–2033
- Germany Western Blotting Market Outlook, by Application, 2020–2033
- Germany Western Blotting Market Outlook, by End User, 2020–2033
- United Kingdom Western Blotting Market Outlook, by Product Type, 2020–2033
- United Kingdom Western Blotting Market Outlook, by Detection Method, 2020–2033
- United Kingdom Western Blotting Market Outlook, by Application, 2020–2033
- United Kingdom Western Blotting Market Outlook, by End User, 2020–2033
- France Western Blotting Market Outlook, by Product Type, 2020–2033
- France Western Blotting Market Outlook, by Detection Method, 2020–2033
- France Western Blotting Market Outlook, by Application, 2020–2033
- France Western Blotting Market Outlook, by End User, 2020–2033
- Switzerland Western Blotting Market Outlook, by Product Type, 2020–2033
- Switzerland Western Blotting Market Outlook, by Detection Method, 2020–2033
- Switzerland Western Blotting Market Outlook, by Application, 2020–2033
- Switzerland Western Blotting Market Outlook, by End User, 2020–2033
- Ireland Western Blotting Market Outlook, by Product Type, 2020–2033
- Ireland Western Blotting Market Outlook, by Detection Method, 2020–2033
- Ireland Western Blotting Market Outlook, by Application, 2020–2033
- Ireland Western Blotting Market Outlook, by End User, 2020–2033
- Europe Western Blotting Market Outlook, by Product Type, Value (US$ Billion), 2020–2033
- Asia Pacific Western Blotting Market Outlook, 2020–2033
- Asia Pacific Western Blotting Market Outlook, by Product Type, Value (US$ Billion), 2020–2033
- Consumables and Reagents
- Antibodies
- Instruments
- Software and Services
- Asia Pacific Western Blotting Market Outlook, by Detection Method, Value (US$ Billion), 2020–2033
- Chemiluminescence
- Fluorescence
- Colorimetric
- Radioactive
- Asia Pacific Western Blotting Market Outlook, by Application, Value (US$ Billion), 2020–2033
- Biomedical Research
- Disease Diagnostics
- Biopharmaceutical Characterisation and Quality Control
- Agriculture and Food Testing
- Asia Pacific Western Blotting Market Outlook, by End User, Value (US$ Billion), 2020–2033
- Academic and Research Institutes
- Pharmaceutical and Biotechnology Companies
- Contract Research Organisations
- Hospitals and Diagnostic Laboratories
- Asia Pacific Western Blotting Market Outlook, by Country, Value (US$ Billion), 2020–2033
- China Western Blotting Market Outlook, by Product Type, 2020–2033
- China Western Blotting Market Outlook, by Detection Method, 2020–2033
- China Western Blotting Market Outlook, by Application, 2020–2033
- China Western Blotting Market Outlook, by End User, 2020–2033
- India Western Blotting Market Outlook, by Product Type, 2020–2033
- India Western Blotting Market Outlook, by Detection Method, 2020–2033
- India Western Blotting Market Outlook, by Application, 2020–2033
- India Western Blotting Market Outlook, by End User, 2020–2033
- Japan Western Blotting Market Outlook, by Product Type, 2020–2033
- Japan Western Blotting Market Outlook, by Detection Method, 2020–2033
- Japan Western Blotting Market Outlook, by Application, 2020–2033
- Japan Western Blotting Market Outlook, by End User, 2020–2033
- South Korea Western Blotting Market Outlook, by Product Type, 2020–2033
- South Korea Western Blotting Market Outlook, by Detection Method, 2020–2033
- South Korea Western Blotting Market Outlook, by Application, 2020–2033
- South Korea Western Blotting Market Outlook, by End User, 2020–2033
- Singapore Western Blotting Market Outlook, by Product Type, 2020–2033
- Singapore Western Blotting Market Outlook, by Detection Method, 2020–2033
- Singapore Western Blotting Market Outlook, by Application, 2020–2033
- Singapore Western Blotting Market Outlook, by End User, 2020–2033
- Asia Pacific Western Blotting Market Outlook, by Product Type, Value (US$ Billion), 2020–2033
- Latin America Western Blotting Market Outlook, 2020–2033
- Latin America Western Blotting Market Outlook, by Product Type, Value (US$ Billion), 2020–2033
- Consumables and Reagents
- Antibodies
- Instruments
- Software and Services
- Latin America Western Blotting Market Outlook, by Detection Method, Value (US$ Billion), 2020–2033
- Chemiluminescence
- Fluorescence
- Colorimetric
- Radioactive
- Latin America Western Blotting Market Outlook, by Application, Value (US$ Billion), 2020–2033
- Biomedical Research
- Disease Diagnostics
- Biopharmaceutical Characterisation and Quality Control
- Agriculture and Food Testing
- Latin America Western Blotting Market Outlook, by End User, Value (US$ Billion), 2020–2033
- Academic and Research Institutes
- Pharmaceutical and Biotechnology Companies
- Contract Research Organisations
- Hospitals and Diagnostic Laboratories
- Latin America Western Blotting Market Outlook, by Country, Value (US$ Billion), 2020–2033
- Brazil Western Blotting Market Outlook, by Product Type, 2020–2033
- Brazil Western Blotting Market Outlook, by Detection Method, 2020–2033
- Brazil Western Blotting Market Outlook, by Application, 2020–2033
- Brazil Western Blotting Market Outlook, by End User, 2020–2033
- Mexico Western Blotting Market Outlook, by Product Type, 2020–2033
- Mexico Western Blotting Market Outlook, by Detection Method, 2020–2033
- Mexico Western Blotting Market Outlook, by Application, 2020–2033
- Mexico Western Blotting Market Outlook, by End User, 2020–2033
- Argentina Western Blotting Market Outlook, by Product Type, 2020–2033
- Argentina Western Blotting Market Outlook, by Detection Method, 2020–2033
- Argentina Western Blotting Market Outlook, by Application, 2020–2033
- Argentina Western Blotting Market Outlook, by End User, 2020–2033
- Chile Western Blotting Market Outlook, by Product Type, 2020–2033
- Chile Western Blotting Market Outlook, by Detection Method, 2020–2033
- Chile Western Blotting Market Outlook, by Application, 2020–2033
- Chile Western Blotting Market Outlook, by End User, 2020–2033
- Colombia Western Blotting Market Outlook, by Product Type, 2020–2033
- Colombia Western Blotting Market Outlook, by Detection Method, 2020–2033
- Colombia Western Blotting Market Outlook, by Application, 2020–2033
- Colombia Western Blotting Market Outlook, by End User, 2020–2033
- Latin America Western Blotting Market Outlook, by Product Type, Value (US$ Billion), 2020–2033
- Middle East & Africa Western Blotting Market Outlook, 2020–2033
- Middle East & Africa Western Blotting Market Outlook, by Product Type, Value (US$ Billion), 2020–2033
- Consumables and Reagents
- Antibodies
- Instruments
- Software and Services
- Middle East & Africa Western Blotting Market Outlook, by Detection Method, Value (US$ Billion), 2020–2033
- Chemiluminescence
- Fluorescence
- Colorimetric
- Radioactive
- Middle East & Africa Western Blotting Market Outlook, by Application, Value (US$ Billion), 2020–2033
- Biomedical Research
- Disease Diagnostics
- Biopharmaceutical Characterisation and Quality Control
- Agriculture and Food Testing
- Middle East & Africa Western Blotting Market Outlook, by End User, Value (US$ Billion), 2020–2033
- Academic and Research Institutes
- Pharmaceutical and Biotechnology Companies
- Contract Research Organisations
- Hospitals and Diagnostic Laboratories
- Middle East & Africa Western Blotting Market Outlook, by Country, Value (US$ Billion), 2020–2033
- Saudi Arabia Western Blotting Market Outlook, by Product Type, 2020–2033
- Saudi Arabia Western Blotting Market Outlook, by Detection Method, 2020–2033
- Saudi Arabia Western Blotting Market Outlook, by Application, 2020–2033
- Saudi Arabia Western Blotting Market Outlook, by End User, 2020–2033
- United Arab Emirates Western Blotting Market Outlook, by Product Type, 2020–2033
- United Arab Emirates Western Blotting Market Outlook, by Detection Method, 2020–2033
- United Arab Emirates Western Blotting Market Outlook, by Application, 2020–2033
- United Arab Emirates Western Blotting Market Outlook, by End User, 2020–2033
- Israel Western Blotting Market Outlook, by Product Type, 2020–2033
- Israel Western Blotting Market Outlook, by Detection Method, 2020–2033
- Israel Western Blotting Market Outlook, by Application, 2020–2033
- Israel Western Blotting Market Outlook, by End User, 2020–2033
- South Africa Western Blotting Market Outlook, by Product Type, 2020–2033
- South Africa Western Blotting Market Outlook, by Detection Method, 2020–2033
- South Africa Western Blotting Market Outlook, by Application, 2020–2033
- South Africa Western Blotting Market Outlook, by End User, 2020–2033
- Egypt Western Blotting Market Outlook, by Product Type, 2020–2033
- Egypt Western Blotting Market Outlook, by Detection Method, 2020–2033
- Egypt Western Blotting Market Outlook, by Application, 2020–2033
- Egypt Western Blotting Market Outlook, by End User, 2020–2033
- Kenya Western Blotting Market Outlook, by Product Type, 2020–2033
- Kenya Western Blotting Market Outlook, by Detection Method, 2020–2033
- Kenya Western Blotting Market Outlook, by Application, 2020–2033
- Kenya Western Blotting Market Outlook, by End User, 2020–2033
- Middle East & Africa Western Blotting Market Outlook, by Product Type, Value (US$ Billion), 2020–2033
- Competitive Landscape
- Market Concentration and Industry Leaders
- Competitive Differentiation
- Strategic Moves and Market Direction
- Recent Industry Developments
- Company Profiles
- Bio-Rad Laboratories, Inc.
- Thermo Fisher Scientific Inc.
- Merck KGaA
- Bio-Techne Corporation
- Cytiva
- Abcam plc
- Cell Signaling Technology, Inc.
- Agilent Technologies, Inc.
- LI-COR Biosciences
- Azure Biosystems, Inc.
- Santa Cruz Biotechnology, Inc.
- Jackson ImmunoResearch Laboratories, Inc.
- Takara Bio Inc.
- Revvity, Inc.
- Appendix
- Research Methodology
- Report Assumptions
- Acronyms and Abbreviations
Product Type
- Consumables and Reagents
- Antibodies
- Instruments
- Software and Services
Detection Method
- Chemiluminescence
- Fluorescence
- Colorimetric
- Radioactive
Application
- Biomedical Research
- Disease Diagnostics
- Biopharmaceutical Characterisation and Quality Control
- Agriculture and Food Testing
End User
- Academic and Research Institutes
- Pharmaceutical and Biotechnology Companies
- Contract Research Organisations
- Hospitals and Diagnostic Laboratories
Regions
- North America
- Europe
- Asia Pacific
- Latin America
- Middle East & Africa
Our Research Methodology
Considering the volatility of business today, traditional approaches to strategizing a game plan can be unfruitful if not detrimental. True ambiguity is no way to determine a forecast. A myriad of predetermined factors must be accounted for such as the degree of risk involved, the magnitude of circumstances, as well as conditions or consequences that are not known or unpredictable. To circumvent binary views that cast uncertainty, the application of market research intelligence to strategically posture, move, and enable actionable outcomes is necessary.
View Methodology
Quality Assured
Rigorous Validation Process

Confidentiality Assured
End-to-end Data Security

Custom Research Services
Tailored To Your Objectives
FAQs
The global market is valued at US$ 1.1 billion in 2026, covering immunoblotting instruments, consumables, antibodies, detection substrates, imaging systems and analysis software worldwide.
Revenue is projected to reach US$ 1.5 billion by 2033, expanding at a 4.5% CAGR and creating an absolute opportunity of US$ 0.4 billion over the period.
Consumables and Reagents lead with 41% share in 2026, because gels, membranes, buffers and substrates are consumed and repurchased on every single run.
Biopharmaceutical Characterisation and Quality Control grows fastest at a 7.0% CAGR, driven by biosimilar comparability studies, host cell protein monitoring and regulated release testing.
North America holds 41% share in 2026, supported by federal research funding, concentrated biologics manufacturing and the headquarters of several leading reagent suppliers.
Related Reports
3D Cell Culture Market Size, Share, Insights, Competitive Landscape, and Forecast 2026 to 2033
The global 3D cell culture market is valued at US$2.42 billion in 2026, reaching US$6.05 billion by 2033, growing at a 13.99% CAGR
Cold and Flu Supplements Market Size, Share, Insights, Competitive Landscape, and Forecast 2026 to 2033
The global cold and flu supplements market is valued at US$24.65 billion in 2026, reaching US$54.60 billion by 2033, growing at a 12.0% CAGR
Cell Isolation Market Size, Share, Insights, Competitive Landscape, and Forecast 2026 to 2033
The global cell isolation market is valued at US$4.39 billion in 2026, reaching US$10.14 billion by 2033, growing at a 12.7% CAGR
Cell & Gene Therapy Bioanalytical Testing Services Market Size, Share, Insights, Competitive Landscape, and Forecast 2026 to 2033
The cell & gene therapy bioanalytical testing services market is valued at US$0.633 billion in 2026, reaching US$1.041 billion by 2033, at 7.4% CAGR
AI in Pharmaceutical Market Size, Share, Insights, Competitive Landscape, and Forecast 2026 to 2033
The global AI in pharmaceutical market is valued at US$1.94 billion in 2026, reaching US$13.93 billion by 2033, growing at a 32.5% CAGR
Agentic AI in Pharmaceuticals Market Size, Share, Insights, Competitive Landscape, and Forecast 2026 to 2033
The global agentic AI in pharmaceuticals market is valued at US$1.3 billion in 2026, reaching US$13.0 billion by 2033, growing at a 38.95% CAGR