



Wheelchair Market
Wheelchair Market Size, Share, Insights, Competitive Landscape, and Forecast 2026 to 2033
Wheelchair Market Size and Trend Analysis
What Is the Growth Outlook for the Wheelchair Market?
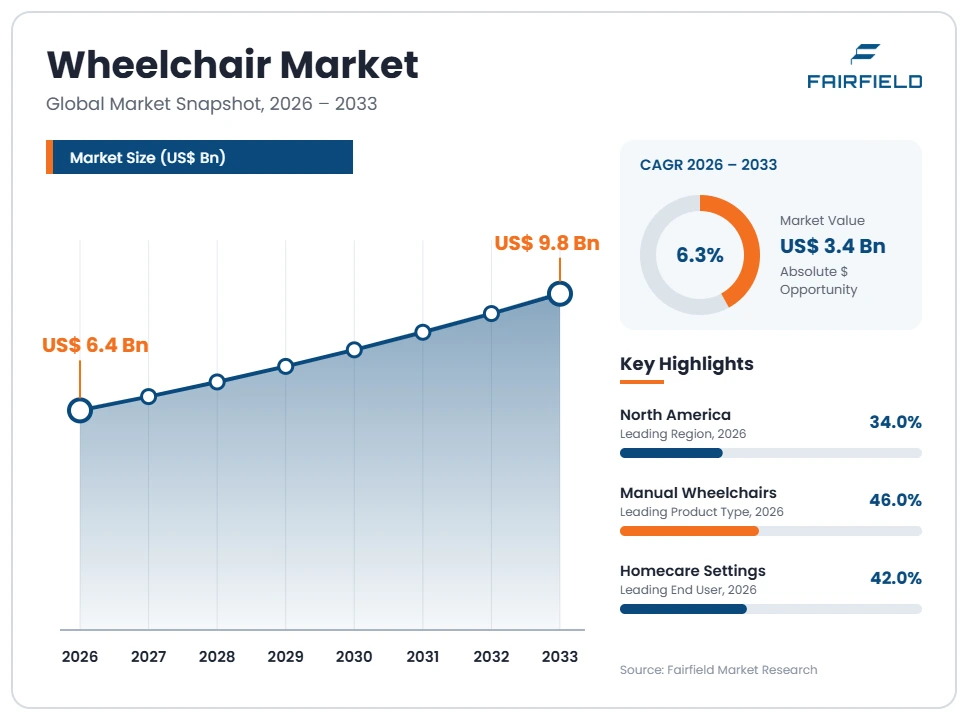
The global Wheelchair market size is expected to be valued at US$ 6.4 billion in 2026 and projected to reach US$ 9.8 billion by 2033, growing at a CAGR of 6.3% between 2026 and 2033.
The market expanded at roughly 5.6% annually between 2020 and 2025, recovering from pandemic-era disruption to clinic-based assessment and fitting. Three forces now set the pace. Population ageing in high-income countries is enlarging the group of people living with mobility limitation for years rather than months. Powered chairs and configurable seating carry far higher unit value than standard manual frames, so revenue grows faster than unit volume. Public provision programmes in middle-income countries are converting unmet need into funded purchases. The binding constraint is reimbursement rather than manufacturing capacity: coverage policy, coding and prior authorisation decide which chair a person actually receives.
Key Report Takeaways
- By Product Type: Manual Wheelchairs held 46% share in 2026, while Powered Wheelchairs are projected to expand at a 7.6% CAGR through 2033, driven by population ageing and wider coverage of power mobility devices in developed health systems.
- By Design Category: Standard Wheelchairs held 44% share in 2026, while Lightweight and Ultralight Wheelchairs are projected to expand at a 7.2% CAGR through 2033, driven by aluminium, titanium and carbon fibre rigid frames that reduce shoulder strain.
- By End User: Homecare Settings held 42% share in 2026, while Rehabilitation Centres are projected to expand at a 7.1% CAGR through 2033, driven by national investment in rehabilitation services and structured wheelchair provision pathways.
- By Distribution Channel: Institutional and Specialist Dealers held 47% share in 2026, while Online Channels are projected to expand at an 8.4% CAGR through 2033, driven by direct purchase of standard manual frames outside reimbursement routes.
- By Geography: North America held 34% share in 2026, while Asia Pacific is projected to expand at an 8.1% CAGR through 2033, driven by ageing populations, public insurance expansion and large domestic manufacturing bases.
Global Wheelchair Market Trends and Insights
Drivers Impact Analysis
Two forces explain most of the forecast growth in wheelchairs and seating systems.
| Driver | Impact on CAGR Forecast | Geographic Relevance | Impact Timeline |
| Population ageing and rising prevalence of long-term mobility limitation | High | Global | Long term (≥4 years) |
| Public provision programmes and assistive technology policy commitments | Medium | Asia Pacific, Latin America, Middle East & Africa | Medium term (2–4 years) |
Population Ageing Expands the Long-Term User Base for Wheelchairs and Seating Systems
Demographic change is the strongest single driver of mobility equipment demand. The number of people aged over sixty-five is rising steadily across Japan, Germany, Italy, the United States and China, and mobility limitation becomes more common with age. Stroke, osteoarthritis, dementia and frailty all produce long-duration rather than temporary need, which converts one-off rentals into sustained equipment ownership.
The mechanism runs through duration and complexity, not headcount alone. Someone using a chair for a decade requires replacement frames, cushion renewals, repairs and reassessment as their condition changes. Older users more often need tilt, recline and pressure-redistribution seating to manage skin integrity and posture, which raises equipment value well above a basic frame. Health systems also prefer supported home living to institutional care, and a suitable chair is often the component that makes discharge home possible, shifting purchasing toward durable home-use configurations.
Assistive Technology Policy Commitments Convert Unmet Wheelchair Need Into Funded Demand
Public provision policy is turning documented unmet need into purchasable demand. The World Health Organization has described a large global gap between the number of people who need a wheelchair and the number who have an appropriate one, concentrated in low- and middle-income countries. Governments responding to that evidence are funding procurement programmes, service workshops and trained provision personnel rather than relying on donated equipment.
The causal chain is policy to budget to tender. Commitments under the United Nations Convention on the Rights of Persons with Disabilities oblige signatory states to improve access to mobility aids at affordable cost. The World Health Organization wheelchair provision guidelines set out the assessment, fitting, training and follow-up steps that make provision clinically effective. Ministries converting those guidelines into national programmes issue multi-year tenders for durable chairs suited to rough terrain, creating volume demand that does not depend on individual purchasing power.
Restraints Impact Analysis
Two constraints hold back conversion of clinical need into delivered wheelchairs.
| Restraint | Impact on CAGR Forecast | Geographic Relevance | Impact Timeline |
| Reimbursement coding, coverage limits and prior authorisation delays | High | North America, Europe | Short term (≤2 years) |
| Shortage of trained assessors, fitters and repair service capacity | Medium | Global | Long term (≥4 years) |
Reimbursement Coding and Prior Authorisation Delays Restrict Access to Complex Wheelchairs
Reimbursement, not production, determines who receives which chair in developed markets. Coverage rules decide whether a person qualifies for a standard frame or a configured power chair, and the HCPCS coding system fixes the payment band for each configuration. Prior authorisation adds weeks between assessment and delivery. Denials and appeals absorb clinician and supplier time, and some users accept less suitable equipment rather than wait.
The cost pressure is structural. Competitive bidding has compressed payment for commodity mobility equipment, while complex rehabilitation technology is treated separately in recognition of its individualised nature. Suppliers still carry the cost of assessment visits, trials, configuration, delivery and documentation before payment arrives, which strains working capital for independent dealers. Where payment bands have not kept pace with component and labour costs, dealers withdraw from complex configurations entirely, reducing local availability regardless of manufacturing capacity.
Shortage of Trained Fitters and Repair Capacity Delays Wheelchair Delivery and Shortens Service Life
Service capacity is a persistent constraint on the delivered value of mobility equipment. Appropriate provision requires assessment, measurement, fitting, user training and follow-up, and relatively few clinicians hold seating and mobility credentials. Waiting lists for assessment are long in many public systems. Once a chair is in use, slow repair turnaround leaves people without mobility for weeks, which damages confidence in funded provision.
The underlying cause is workforce economics rather than engineering. Technician roles require training in electronics, seating hardware and documentation but are paid against compressed service reimbursement, so vacancies persist and travel-heavy rural coverage is uneconomic. Spare part availability for powered chairs depends on long international supply chains, and control electronics are rarely field-repairable. In lower-resourced settings the World Health Organization has linked absent repair infrastructure directly to abandoned equipment and avoidable pressure injuries.
Market Opportunities
Two revenue pools sit outside the conventional funded manual wheelchair channel.
Configured Power Mobility and Seating Packages Open a High-Value Revenue Pool
Configured power mobility is the highest-value revenue pool in this market. A complex rehabilitation power chair with powered tilt, recline, elevating legrests, seat elevation and an alternative drive control carries many times the price of a standard manual frame, and each element is separately specified and coded. Pressure-redistribution cushions, custom moulded backs and positioning hardware add a recurring replacement stream tied to clinical review.
Manufacturers with clinical specialist networks and credentialled dealer channels are positioned to capture this. Demand comes from people with spinal cord injury, muscular dystrophy, multiple sclerosis, cerebral palsy and advanced neurological conditions, where posture and skin integrity management are clinical priorities rather than conveniences. Recognition of complex rehabilitation technology as a distinct category in coverage policy protects these configurations from commodity price compression, giving suppliers a defensible margin that standard mobility equipment no longer offers.
Durable Low-Cost Chairs for Less-Resourced Settings Create a Tender-Driven Volume Pool
Programme procurement in less-resourced settings represents a large unserved volume pool. The World Health Organization has documented that most people who need a wheelchair in low-income countries do not have an appropriate one. Chairs designed for unpaved roads, humid conditions and limited maintenance differ fundamentally from products built for smooth indoor surfaces, and designs meeting those requirements can be manufactured at accessible price points.
Capture depends on tender capability rather than brand strength. Buyers are health ministries, international donors, disabled people’s organisations and non-governmental programmes purchasing in batches with service training attached. Manufacturers that meet ISO 7176 durability testing, supply locally stocked spare parts and train regional technicians win repeat awards. The World Health Organization assistive technology agenda and national disability strategies supply the funding mechanism, making this a policy-led rather than consumer-led revenue stream.
Segment Analysis
- By Product Type: Manual Frames Hold Revenue Leadership While Powered Chairs Accelerate
Manual Wheelchairs held 46% of revenue in 2026, and a far larger share of units, because they remain the default prescription for temporary need, institutional use and self-propelling users with upper-body function. Low purchase price, simple maintenance and transportability keep them dominant in hospitals, care homes and household ownership. Seating and Positioning Systems contributed 11%, and Sports and All-Terrain Wheelchairs around 5%, a small but visible category.
Powered Wheelchairs are the fastest-growing product line at a 7.6% CAGR to 2033, from 38% share. Lithium battery packs, lighter folding designs and better drive electronics have widened the addressable user group beyond complex rehabilitation cases. Because a powered chair can cost ten times a standard manual frame, modest unit growth produces large revenue gains. For manufacturers, this makes power platform investment and seating integration the main determinant of revenue growth.
- By Design Category: Standard Frames Lead as Lightweight and Ultralight Models Gain Share
Standard Wheelchairs accounted for 44% of the market in 2026, sustained by institutional purchasing, transport chairs and entry-level home use where cost dominates the specification. Hospitals and care facilities buy these in volume for short-distance transfers, and public programmes default to them when budgets are fixed. Bariatric Wheelchairs held 12%, reflecting rising obesity prevalence and the reinforced frames and wider seats it requires, while Paediatric Wheelchairs represented 9%.
Lightweight and Ultralight Wheelchairs are expanding fastest at a 7.2% CAGR through 2033, from 35% share. Aluminium, titanium and carbon fibre rigid frames reduce propulsion effort and shoulder loading, which matters to full-time self-propelling users over decades of use. Clinicians increasingly specify them to protect upper limb function. The implication is that material science and frame geometry, not motor technology, drive premium pricing in the manual category.
- By End User: Home Settings Dominate While Rehabilitation Centres Grow Fastest
Homecare Settings represented 42% of demand in 2026, the largest end user block, because most wheelchairs are used daily in and around the home rather than in clinical facilities. Policies favouring ageing in place and supported discharge push equipment into private residences, where durability, indoor manoeuvrability and transportability govern product choice. Hospitals and Clinics accounted for 24%, mainly transport chairs with short replacement cycles and heavy utilisation.
Rehabilitation Centres are the fastest-growing end user at a 7.1% CAGR to 2033, from 19% share, with Long-Term Care and Elder Care Facilities holding the remaining 15%. Governments are expanding rehabilitation services as part of broader health system strengthening, and these centres perform the assessment, trial and fitting that complex equipment requires. The business implication is that clinical channel relationships increasingly determine which manufacturers reach high-value users.
- By Distribution Channel: Specialist Dealers Retain Control as Online Purchasing Grows Quickest
Institutional and Specialist Dealers held 47% of distribution in 2026, because funded provision of configured chairs requires assessment, measurement, trial, delivery and documentation that only credentialled channels perform. Payers route complex rehabilitation technology through these suppliers precisely because of that service obligation. Direct Tenders and Government Procurement accounted for a substantial further block, concentrated in public health systems and donor-funded programmes buying standardised designs in volume.
Online Channels are growing fastest at an 8.4% CAGR through 2033, though from a small base, alongside Retail Pharmacies and Medical Supply Stores. Growth is confined to self-funded purchases of standard manual frames, transport chairs and accessories, where configuration needs are minimal and price comparison is straightforward. The commercial consequence is a widening split: commoditised products migrate online and compress margin, while configured mobility stays firmly inside service-led channels.
Geography Analysis
- Which Region Is Leading the Wheelchair Market?
North America leads the wheelchair market with 34% revenue share in 2026, growing at about 5.6% annually to 2033. The United States supplies most of that value because public and private insurance fund a high proportion of power mobility devices, and because complex rehabilitation technology is recognised as a distinct category rather than commodity equipment. Canada adds provincially funded provision programmes. The Americans with Disabilities Act has shaped decades of accessible building, transit and sidewalk design, which makes independent wheelchair use practical and sustains demand for everyday mobility.
Reimbursement is both the engine and the brake. HCPCS coding, documentation requirements and prior authorisation determine access, and payment band compression has pushed some independent dealers out of complex configurations. The clearest opportunity lies in seat elevation and configured power seating, where coverage recognition has improved the funding case for clinically justified features.
- Europe Combines Strict Device Regulation With Publicly Funded Wheelchair Provision
Europe held 27% of revenue in 2026 and is forecast to grow near 5.3% annually through 2033. Germany, the United Kingdom, France, Italy, Sweden and the Netherlands account for most spending, with statutory health insurance or national health services funding the majority of provision. The region also hosts several of the sector’s largest manufacturers, supporting a dense service and repair network and strong clinical seating expertise.
Regulation shapes the commercial picture. Regulation (EU) 2017/745 raised clinical evidence, traceability and post-market surveillance requirements for mobility devices, and the transition extension under Regulation (EU) 2023/607 gave manufacturers additional time to recertify legacy products. Compliance cost favours larger suppliers. Public tendering limits price on standard frames, so growth concentrates in configured power chairs, paediatric seating and refurbishment or recycling schemes that extend equipment life within fixed budgets.
- Which Region Is Growing Fastest in the Wheelchair Market?
Asia Pacific is growing fastest at an 8.1% CAGR between 2026 and 2033, from 28% share in 2026. China drives the largest absolute gain, combining the world’s biggest ageing population with extensive domestic manufacturing that supplies both local demand and global export markets. Japan contributes high-value demand through long-term care insurance that funds equipment rental and replacement. India is expanding rapidly from a low base as disability schemes and private hospital rehabilitation capacity grow, with Australia and South Korea adding funded provision through national disability and insurance programmes.
Manual chairs account for most units here, keeping average selling prices below other regions. The shift toward powered models and better seating is the main growth mechanism. Weak rural service networks and uneven repair access remain the principal limits on sustained equipment use.
- Latin America Builds Provision Programmes Against Funding and Service Constraints
Latin America accounted for 6% of revenue in 2026 and is projected to grow at roughly 6.3% annually through 2033. Brazil leads through its public health system, which funds mobility equipment through state and municipal programmes, with Mexico, Argentina, Colombia and Chile supplying the remainder. Disability rights legislation across the region has strengthened entitlement to assistive products, and urban accessibility investment in large cities supports everyday use.
Barriers are mainly economic and logistical. Import duties and currency volatility raise the landed cost of powered chairs and components, and public budgets fluctuate between administrations, stalling tender cycles. Trained fitters and repair workshops are concentrated in capital cities, leaving rural users poorly served. The clearest opportunity is local assembly and regional spare-part stockholding, which lowers delivered cost and shortens repair turnaround for publicly funded programmes.
- Middle East & Africa Shows Large Unmet Need Alongside Expanding Rehabilitation Investment
Middle East & Africa represented 5% of revenue in 2026, with growth near 6.0% annually to 2033. Saudi Arabia, the United Arab Emirates and Qatar are investing in rehabilitation hospitals and accessibility standards under national development programmes, generating demand for configured power chairs. South Africa, Egypt, Nigeria and Kenya represent high-volume need served largely through public and donor-funded provision of durable manual chairs.
Constraints are severe in lower-income countries. Trained provision personnel are scarce, repair workshops are rare outside major cities, and donated equipment often arrives without fitting or follow-up, leading to abandonment. Terrain and distance make unsuitable chairs unusable. The growth opening lies in programme procurement of rough-terrain designs tested to recognised durability standards, bundled with technician training and local spare-part supply that keeps equipment in service.
Competitive Landscape
The wheelchair market is moderately concentrated, with a clear split between two competitive worlds. A handful of international manufacturers dominates configured power mobility and clinical seating, where engineering depth, regulatory compliance and credentialled dealer networks create real barriers to entry. Invacare Holdings Corporation, Sunrise Medical, Permobil AB, Ottobock SE & Co. KGaA and Pride Mobility Products Corporation hold the strongest positions in that tier. Standard manual chairs, by contrast, are highly fragmented, with large-volume production in China and Taiwan supplying regional distributors and private-label buyers worldwide. Ownership change and private capital involvement have been recurring features of the sector as firms adjust to compressed reimbursement.
Competition in the complex tier turns on clinical outcomes rather than price. Vendors compete on seating and positioning performance, drive control options for users with limited hand function, battery range and charging convenience, serviceability, and the strength of their clinical education programmes for therapists. Compliance with the ISO 7176 wheelchair test series and ISO 16840 seating standards is a prerequisite for institutional purchase. New approaches are arriving from outside the traditional base: power add-on units that convert a manual chair, lightweight folding power chairs aimed at travel, carbon fibre frame specialists, and smart control and remote diagnostic systems that reduce service visits.
Strategic direction is consistent across the sector. Manufacturers are concentrating investment in power platforms and seating, where value per user is highest and commodity competition is weakest. They are building direct relationships with clinicians and funded provision programmes to secure specification at the assessment stage. Many are also strengthening repair and spare-part logistics, recognising that service reliability now influences payer and institutional purchasing decisions as much as product specification does.
Recent Industry Developments
- 2008: The World Health Organization published its guidelines on the provision of manual wheelchairs in less-resourced settings – establishing assessment, fitting, training and follow-up as the benchmark for appropriate provision.
- May 2021: Regulation (EU) 2017/745 became fully applicable across the European Union – raising clinical evidence, traceability and post-market surveillance obligations for wheelchairs and seating systems.
- May 2022: The World Health Organization and UNICEF published the Global Report on Assistive Technology – quantifying the unmet need for mobility products and prompting national procurement commitments.
- March 2023: Regulation (EU) 2023/607 extended the transition periods for legacy medical devices – easing recertification pressure on established wheelchair ranges and reducing the risk of product withdrawal.
- 2023: The World Health Organization issued updated wheelchair provision guidelines covering service delivery and personnel training – giving ministries a procurement framework that links equipment supply to fitting and follow-up.
Companies Covered in the Report
- Invacare Holdings Corporation
- Sunrise Medical
- Permobil AB
- Ottobock SE & Co. KGaA
- Pride Mobility Products Corporation
- Drive DeVilbiss Healthcare
- MEYRA GmbH
- Karman Healthcare, Inc.
- Medline Industries, LP
- GF Health Products, Inc.
- Motion Composites Inc.
- Etac AB
- Nissin Medical Industries Co., Ltd.
- Matsunaga Manufactory Co., Ltd.
Wheelchair Market Report Scope
| Metric | Value |
| Study Period | 2020–2033 |
| Market Size 2026 | US$ 6.4 Billion |
| Market Size 2033 | US$ 9.8 Billion |
| CAGR 2026–2033 | 6.3% |
| Absolute Dollar Opportunity | US$ 3.4 Billion |
| Largest Market | North America (34% share in 2026) |
| Fastest-Growing Market | Asia Pacific (8.1% CAGR) |
| Market Concentration | Medium |
| Major Players | Invacare Holdings Corporation, Sunrise Medical, Permobil AB, Ottobock SE & Co. KGaA, Pride Mobility Products Corporation |
Wheelchair Market Segmentation
Product Type
- Manual Wheelchairs
- Powered Wheelchairs
- Seating and Positioning Systems
- Sports and All-Terrain Wheelchairs
Design Category
- Standard Wheelchairs
- Lightweight and Ultralight Wheelchairs
- Bariatric Wheelchairs
- Paediatric Wheelchairs
End User
- Homecare Settings
- Hospitals and Clinics
- Rehabilitation Centres
- Long-Term Care and Elder Care Facilities
Distribution Channel
- Institutional and Specialist Dealers
- Retail Pharmacies and Medical Supply Stores
- Online Channels
- Direct Tenders and Government Procurement
Regions
- North America
- Europe
- Asia Pacific
- Latin America
- Middle East & Africa
- Executive Summary
- Global Wheelchair Market Snapshot
- Future Projections
- Key Report Takeaways
- Regional Snapshot
- Market Overview
- Market Definition and Report Scope
- Historical Trends 2020–2025
- Market Dynamics
- Drivers
- Population Ageing Expands the Long-Term User Base for Wheelchairs and Seating Systems
- Assistive Technology Policy Commitments Convert Unmet Wheelchair Need Into Funded Demand
- Restraints
- Reimbursement Coding and Prior Authorisation Delays Restrict Access to Complex Wheelchairs
- Shortage of Trained Fitters and Repair Capacity Delays Wheelchair Delivery and Shortens Service Life
- Market Opportunities
- Configured Power Mobility and Seating Packages Open a High-Value Revenue Pool
- Durable Low-Cost Chairs for Less-Resourced Settings Create a Tender-Driven Volume Pool
- Drivers
- Global Wheelchair Market Outlook, 2020–2033
- Global Wheelchair Market Outlook, by Product Type, Value (US$ Billion), 2020–2033
- Manual Wheelchairs
- Powered Wheelchairs
- Seating and Positioning Systems
- Sports and All-Terrain Wheelchairs
- Global Wheelchair Market Outlook, by Design Category, Value (US$ Billion), 2020–2033
- Standard Wheelchairs
- Lightweight and Ultralight Wheelchairs
- Bariatric Wheelchairs
- Paediatric Wheelchairs
- Global Wheelchair Market Outlook, by End User, Value (US$ Billion), 2020–2033
- Homecare Settings
- Hospitals and Clinics
- Rehabilitation Centres
- Long-Term Care and Elder Care Facilities
- Global Wheelchair Market Outlook, by Distribution Channel, Value (US$ Billion), 2020–2033
- Institutional and Specialist Dealers
- Retail Pharmacies and Medical Supply Stores
- Online Channels
- Direct Tenders and Government Procurement
- Global Wheelchair Market Outlook, by Region, Value (US$ Billion), 2020–2033
- North America
- Europe
- Asia Pacific
- Latin America
- Middle East & Africa
- Global Wheelchair Market Outlook, by Product Type, Value (US$ Billion), 2020–2033
- North America Wheelchair Market Outlook, 2020–2033
- North America Wheelchair Market Outlook, by Product Type, Value (US$ Billion), 2020–2033
- Manual Wheelchairs
- Powered Wheelchairs
- Seating and Positioning Systems
- Sports and All-Terrain Wheelchairs
- North America Wheelchair Market Outlook, by Design Category, Value (US$ Billion), 2020–2033
- Standard Wheelchairs
- Lightweight and Ultralight Wheelchairs
- Bariatric Wheelchairs
- Paediatric Wheelchairs
- North America Wheelchair Market Outlook, by End User, Value (US$ Billion), 2020–2033
- Homecare Settings
- Hospitals and Clinics
- Rehabilitation Centres
- Long-Term Care and Elder Care Facilities
- North America Wheelchair Market Outlook, by Distribution Channel, Value (US$ Billion), 2020–2033
- Institutional and Specialist Dealers
- Retail Pharmacies and Medical Supply Stores
- Online Channels
- Direct Tenders and Government Procurement
- North America Wheelchair Market Outlook, by Country, Value (US$ Billion), 2020–2033
- United States Wheelchair Market Outlook, by Product Type, 2020–2033
- United States Wheelchair Market Outlook, by Design Category, 2020–2033
- United States Wheelchair Market Outlook, by End User, 2020–2033
- United States Wheelchair Market Outlook, by Distribution Channel, 2020–2033
- Canada Wheelchair Market Outlook, by Product Type, 2020–2033
- Canada Wheelchair Market Outlook, by Design Category, 2020–2033
- Canada Wheelchair Market Outlook, by End User, 2020–2033
- Canada Wheelchair Market Outlook, by Distribution Channel, 2020–2033
- North America Wheelchair Market Outlook, by Product Type, Value (US$ Billion), 2020–2033
- Europe Wheelchair Market Outlook, 2020–2033
- Europe Wheelchair Market Outlook, by Product Type, Value (US$ Billion), 2020–2033
- Manual Wheelchairs
- Powered Wheelchairs
- Seating and Positioning Systems
- Sports and All-Terrain Wheelchairs
- Europe Wheelchair Market Outlook, by Design Category, Value (US$ Billion), 2020–2033
- Standard Wheelchairs
- Lightweight and Ultralight Wheelchairs
- Bariatric Wheelchairs
- Paediatric Wheelchairs
- Europe Wheelchair Market Outlook, by End User, Value (US$ Billion), 2020–2033
- Homecare Settings
- Hospitals and Clinics
- Rehabilitation Centres
- Long-Term Care and Elder Care Facilities
- Europe Wheelchair Market Outlook, by Distribution Channel, Value (US$ Billion), 2020–2033
- Institutional and Specialist Dealers
- Retail Pharmacies and Medical Supply Stores
- Online Channels
- Direct Tenders and Government Procurement
- Europe Wheelchair Market Outlook, by Country, Value (US$ Billion), 2020–2033
- Germany Wheelchair Market Outlook, by Product Type, 2020–2033
- Germany Wheelchair Market Outlook, by Design Category, 2020–2033
- Germany Wheelchair Market Outlook, by End User, 2020–2033
- Germany Wheelchair Market Outlook, by Distribution Channel, 2020–2033
- United Kingdom Wheelchair Market Outlook, by Product Type, 2020–2033
- United Kingdom Wheelchair Market Outlook, by Design Category, 2020–2033
- United Kingdom Wheelchair Market Outlook, by End User, 2020–2033
- United Kingdom Wheelchair Market Outlook, by Distribution Channel, 2020–2033
- France Wheelchair Market Outlook, by Product Type, 2020–2033
- France Wheelchair Market Outlook, by Design Category, 2020–2033
- France Wheelchair Market Outlook, by End User, 2020–2033
- France Wheelchair Market Outlook, by Distribution Channel, 2020–2033
- Italy Wheelchair Market Outlook, by Product Type, 2020–2033
- Italy Wheelchair Market Outlook, by Design Category, 2020–2033
- Italy Wheelchair Market Outlook, by End User, 2020–2033
- Italy Wheelchair Market Outlook, by Distribution Channel, 2020–2033
- Sweden Wheelchair Market Outlook, by Product Type, 2020–2033
- Sweden Wheelchair Market Outlook, by Design Category, 2020–2033
- Sweden Wheelchair Market Outlook, by End User, 2020–2033
- Sweden Wheelchair Market Outlook, by Distribution Channel, 2020–2033
- Netherlands Wheelchair Market Outlook, by Product Type, 2020–2033
- Netherlands Wheelchair Market Outlook, by Design Category, 2020–2033
- Netherlands Wheelchair Market Outlook, by End User, 2020–2033
- Netherlands Wheelchair Market Outlook, by Distribution Channel, 2020–2033
- Europe Wheelchair Market Outlook, by Product Type, Value (US$ Billion), 2020–2033
- Asia Pacific Wheelchair Market Outlook, 2020–2033
- Asia Pacific Wheelchair Market Outlook, by Product Type, Value (US$ Billion), 2020–2033
- Manual Wheelchairs
- Powered Wheelchairs
- Seating and Positioning Systems
- Sports and All-Terrain Wheelchairs
- Asia Pacific Wheelchair Market Outlook, by Design Category, Value (US$ Billion), 2020–2033
- Standard Wheelchairs
- Lightweight and Ultralight Wheelchairs
- Bariatric Wheelchairs
- Paediatric Wheelchairs
- Asia Pacific Wheelchair Market Outlook, by End User, Value (US$ Billion), 2020–2033
- Homecare Settings
- Hospitals and Clinics
- Rehabilitation Centres
- Long-Term Care and Elder Care Facilities
- Asia Pacific Wheelchair Market Outlook, by Distribution Channel, Value (US$ Billion), 2020–2033
- Institutional and Specialist Dealers
- Retail Pharmacies and Medical Supply Stores
- Online Channels
- Direct Tenders and Government Procurement
- Asia Pacific Wheelchair Market Outlook, by Country, Value (US$ Billion), 2020–2033
- China Wheelchair Market Outlook, by Product Type, 2020–2033
- China Wheelchair Market Outlook, by Design Category, 2020–2033
- China Wheelchair Market Outlook, by End User, 2020–2033
- China Wheelchair Market Outlook, by Distribution Channel, 2020–2033
- Japan Wheelchair Market Outlook, by Product Type, 2020–2033
- Japan Wheelchair Market Outlook, by Design Category, 2020–2033
- Japan Wheelchair Market Outlook, by End User, 2020–2033
- Japan Wheelchair Market Outlook, by Distribution Channel, 2020–2033
- India Wheelchair Market Outlook, by Product Type, 2020–2033
- India Wheelchair Market Outlook, by Design Category, 2020–2033
- India Wheelchair Market Outlook, by End User, 2020–2033
- India Wheelchair Market Outlook, by Distribution Channel, 2020–2033
- Australia Wheelchair Market Outlook, by Product Type, 2020–2033
- Australia Wheelchair Market Outlook, by Design Category, 2020–2033
- Australia Wheelchair Market Outlook, by End User, 2020–2033
- Australia Wheelchair Market Outlook, by Distribution Channel, 2020–2033
- South Korea Wheelchair Market Outlook, by Product Type, 2020–2033
- South Korea Wheelchair Market Outlook, by Design Category, 2020–2033
- South Korea Wheelchair Market Outlook, by End User, 2020–2033
- South Korea Wheelchair Market Outlook, by Distribution Channel, 2020–2033
- Asia Pacific Wheelchair Market Outlook, by Product Type, Value (US$ Billion), 2020–2033
- Latin America Wheelchair Market Outlook, 2020–2033
- Latin America Wheelchair Market Outlook, by Product Type, Value (US$ Billion), 2020–2033
- Manual Wheelchairs
- Powered Wheelchairs
- Seating and Positioning Systems
- Sports and All-Terrain Wheelchairs
- Latin America Wheelchair Market Outlook, by Design Category, Value (US$ Billion), 2020–2033
- Standard Wheelchairs
- Lightweight and Ultralight Wheelchairs
- Bariatric Wheelchairs
- Paediatric Wheelchairs
- Latin America Wheelchair Market Outlook, by End User, Value (US$ Billion), 2020–2033
- Homecare Settings
- Hospitals and Clinics
- Rehabilitation Centres
- Long-Term Care and Elder Care Facilities
- Latin America Wheelchair Market Outlook, by Distribution Channel, Value (US$ Billion), 2020–2033
- Institutional and Specialist Dealers
- Retail Pharmacies and Medical Supply Stores
- Online Channels
- Direct Tenders and Government Procurement
- Latin America Wheelchair Market Outlook, by Country, Value (US$ Billion), 2020–2033
- Brazil Wheelchair Market Outlook, by Product Type, 2020–2033
- Brazil Wheelchair Market Outlook, by Design Category, 2020–2033
- Brazil Wheelchair Market Outlook, by End User, 2020–2033
- Brazil Wheelchair Market Outlook, by Distribution Channel, 2020–2033
- Mexico Wheelchair Market Outlook, by Product Type, 2020–2033
- Mexico Wheelchair Market Outlook, by Design Category, 2020–2033
- Mexico Wheelchair Market Outlook, by End User, 2020–2033
- Mexico Wheelchair Market Outlook, by Distribution Channel, 2020–2033
- Argentina Wheelchair Market Outlook, by Product Type, 2020–2033
- Argentina Wheelchair Market Outlook, by Design Category, 2020–2033
- Argentina Wheelchair Market Outlook, by End User, 2020–2033
- Argentina Wheelchair Market Outlook, by Distribution Channel, 2020–2033
- Colombia Wheelchair Market Outlook, by Product Type, 2020–2033
- Colombia Wheelchair Market Outlook, by Design Category, 2020–2033
- Colombia Wheelchair Market Outlook, by End User, 2020–2033
- Colombia Wheelchair Market Outlook, by Distribution Channel, 2020–2033
- Chile Wheelchair Market Outlook, by Product Type, 2020–2033
- Chile Wheelchair Market Outlook, by Design Category, 2020–2033
- Chile Wheelchair Market Outlook, by End User, 2020–2033
- Chile Wheelchair Market Outlook, by Distribution Channel, 2020–2033
- Latin America Wheelchair Market Outlook, by Product Type, Value (US$ Billion), 2020–2033
- Middle East & Africa Wheelchair Market Outlook, 2020–2033
- Middle East & Africa Wheelchair Market Outlook, by Product Type, Value (US$ Billion), 2020–2033
- Manual Wheelchairs
- Powered Wheelchairs
- Seating and Positioning Systems
- Sports and All-Terrain Wheelchairs
- Middle East & Africa Wheelchair Market Outlook, by Design Category, Value (US$ Billion), 2020–2033
- Standard Wheelchairs
- Lightweight and Ultralight Wheelchairs
- Bariatric Wheelchairs
- Paediatric Wheelchairs
- Middle East & Africa Wheelchair Market Outlook, by End User, Value (US$ Billion), 2020–2033
- Homecare Settings
- Hospitals and Clinics
- Rehabilitation Centres
- Long-Term Care and Elder Care Facilities
- Middle East & Africa Wheelchair Market Outlook, by Distribution Channel, Value (US$ Billion), 2020–2033
- Institutional and Specialist Dealers
- Retail Pharmacies and Medical Supply Stores
- Online Channels
- Direct Tenders and Government Procurement
- Middle East & Africa Wheelchair Market Outlook, by Country, Value (US$ Billion), 2020–2033
- Saudi Arabia Wheelchair Market Outlook, by Product Type, 2020–2033
- Saudi Arabia Wheelchair Market Outlook, by Design Category, 2020–2033
- Saudi Arabia Wheelchair Market Outlook, by End User, 2020–2033
- Saudi Arabia Wheelchair Market Outlook, by Distribution Channel, 2020–2033
- United Arab Emirates Wheelchair Market Outlook, by Product Type, 2020–2033
- United Arab Emirates Wheelchair Market Outlook, by Design Category, 2020–2033
- United Arab Emirates Wheelchair Market Outlook, by End User, 2020–2033
- United Arab Emirates Wheelchair Market Outlook, by Distribution Channel, 2020–2033
- Qatar Wheelchair Market Outlook, by Product Type, 2020–2033
- Qatar Wheelchair Market Outlook, by Design Category, 2020–2033
- Qatar Wheelchair Market Outlook, by End User, 2020–2033
- Qatar Wheelchair Market Outlook, by Distribution Channel, 2020–2033
- South Africa Wheelchair Market Outlook, by Product Type, 2020–2033
- South Africa Wheelchair Market Outlook, by Design Category, 2020–2033
- South Africa Wheelchair Market Outlook, by End User, 2020–2033
- South Africa Wheelchair Market Outlook, by Distribution Channel, 2020–2033
- Egypt Wheelchair Market Outlook, by Product Type, 2020–2033
- Egypt Wheelchair Market Outlook, by Design Category, 2020–2033
- Egypt Wheelchair Market Outlook, by End User, 2020–2033
- Egypt Wheelchair Market Outlook, by Distribution Channel, 2020–2033
- Nigeria Wheelchair Market Outlook, by Product Type, 2020–2033
- Nigeria Wheelchair Market Outlook, by Design Category, 2020–2033
- Nigeria Wheelchair Market Outlook, by End User, 2020–2033
- Nigeria Wheelchair Market Outlook, by Distribution Channel, 2020–2033
- Kenya Wheelchair Market Outlook, by Product Type, 2020–2033
- Kenya Wheelchair Market Outlook, by Design Category, 2020–2033
- Kenya Wheelchair Market Outlook, by End User, 2020–2033
- Kenya Wheelchair Market Outlook, by Distribution Channel, 2020–2033
- Middle East & Africa Wheelchair Market Outlook, by Product Type, Value (US$ Billion), 2020–2033
- Competitive Landscape
- Market Concentration and Industry Leaders
- Competitive Differentiation
- Strategic Moves and Market Direction
- Recent Industry Developments
- Company Profiles
- Invacare Holdings Corporation
- Sunrise Medical
- Permobil AB
- Ottobock SE & Co. KGaA
- Pride Mobility Products Corporation
- Drive DeVilbiss Healthcare
- MEYRA GmbH
- Karman Healthcare, Inc.
- Medline Industries, LP
- GF Health Products, Inc.
- Motion Composites Inc.
- Etac AB
- Nissin Medical Industries Co., Ltd.
- Matsunaga Manufactory Co., Ltd.
- Appendix
- Research Methodology
- Report Assumptions
- Acronyms and Abbreviations
Product Type
- Manual Wheelchairs
- Powered Wheelchairs
- Seating and Positioning Systems
- Sports and All-Terrain Wheelchairs
Design Category
- Standard Wheelchairs
- Lightweight and Ultralight Wheelchairs
- Bariatric Wheelchairs
- Paediatric Wheelchairs
End User
- Homecare Settings
- Hospitals and Clinics
- Rehabilitation Centres
- Long-Term Care and Elder Care Facilities
Distribution Channel
- Institutional and Specialist Dealers
- Retail Pharmacies and Medical Supply Stores
- Online Channels
- Direct Tenders and Government Procurement
Regions
- North America
- Europe
- Asia Pacific
- Latin America
- Middle East & Africa
Our Research Methodology
Considering the volatility of business today, traditional approaches to strategizing a game plan can be unfruitful if not detrimental. True ambiguity is no way to determine a forecast. A myriad of predetermined factors must be accounted for such as the degree of risk involved, the magnitude of circumstances, as well as conditions or consequences that are not known or unpredictable. To circumvent binary views that cast uncertainty, the application of market research intelligence to strategically posture, move, and enable actionable outcomes is necessary.
View Methodology
Quality Assured
Rigorous Validation Process

Confidentiality Assured
End-to-end Data Security

Custom Research Services
Tailored To Your Objectives
FAQs
The global market is valued at US$ 6.4 billion in 2026, covering manual and powered wheelchairs together with seating and positioning systems worldwide.
Revenue is projected to reach US$ 9.8 billion by 2033, expanding at a 6.3% CAGR and creating an absolute opportunity of US$ 3.4 billion.
Manual Wheelchairs lead with 46% revenue share in 2026, supported by low cost, simple maintenance and default use in hospitals, care homes and households.
Online Channels grow fastest at an 8.4% CAGR, as self-funded buyers purchase standard manual frames, transport chairs and accessories outside reimbursement routes.
North America holds 34% share in 2026, because insurance funds a high proportion of power mobility devices and accessibility legislation sustains everyday use.
Related Reports
Zirconia Based Dental Materials Market Size, Share, Insights, Competitive Landscape, and Forecast 2026 to 2033
The global zirconia based dental materials market is valued at US$1.6 billion in 2026, reaching US$2.8 billion by 2033, growing at an 8.3% CAGR
3D Bioprinting Market Size, Share, Insights, Competitive Landscape, and Forecast 2026 to 2033
The global 3D bioprinting market is valued at US$2.81 billion in 2026, reaching US$10.11 billion by 2033, growing at a 20.1% CAGR
3D Bioengineered Skin Grafts Market Size, Share, Insights, Competitive Landscape, and Forecast 2026 to 2033
The global 3D bioengineered skin grafts market is valued at US$2.50 billion in 2026, reaching US$4.45 billion by 2033, growing at an 8.6% CAGR
Respiratory Diagnostics Market Size, Share, Insights, Competitive Landscape, and Forecast 2026 to 2033
The global respiratory diagnostics market is valued at US$9.66 billion in 2026, reaching US$14.69 billion by 2033, growing at a 6.2% CAGR
Microtainer Blood Collection Market Size, Share, Insights, Competitive Landscape, and Forecast 2026 to 2033
The global microtainer blood collection market is valued at US$1.37 billion in 2026, reaching US$2.20 billion by 2033, growing at a 7.0% CAGR
Orthopedic Pulse Lavage Systems Market Size, Share, Insights, Competitive Landscape, and Forecast 2026 to 2033
The global orthopedic pulse lavage systems market is valued at US$0.6 billion in 2026, reaching US$0.9 billion by 2033, at a 6.0% CAGR