



Advanced Materials Market
Advanced Materials Market Size, Share, Insights, Competitive Landscape, and Forecast 2026 to 2033
Advanced Materials Market Size, Share, Insights, Competitive Landscape, and Forecast 2026 to 2033
How Fast Is the Advanced Materials Market Growing?
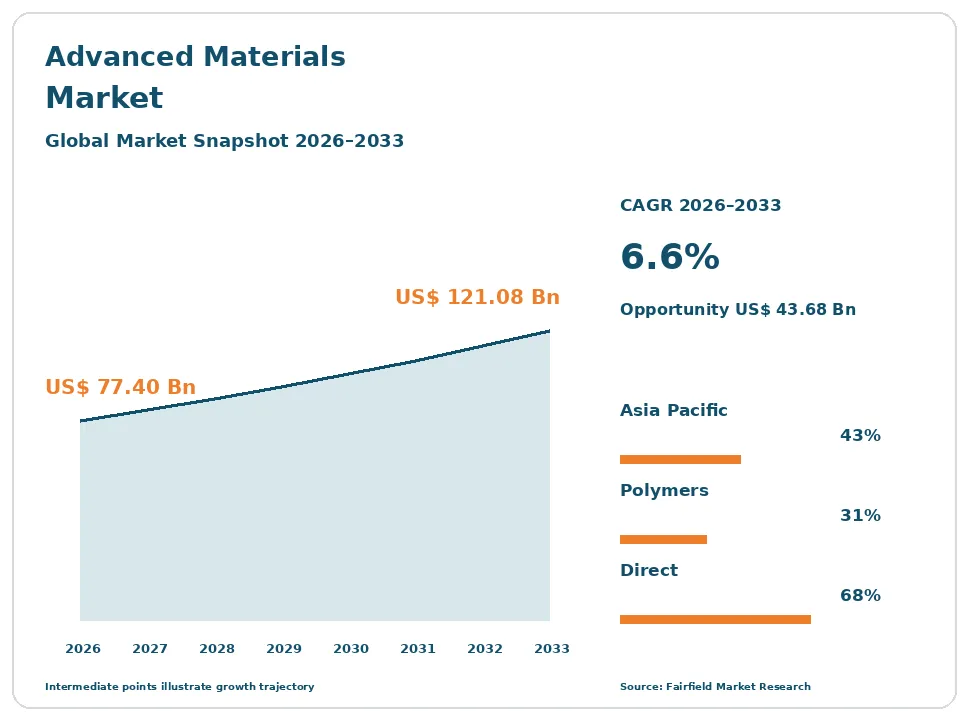
The global advanced materials market size is expected to be valued at US$ 77.40 billion in 2026 and projected to reach US$ 121.08 billion by 2033, growing at a CAGR of 6.6% between 2026 and 2033.
Between 2020 and 2025, the market grew at a CAGR of about 5.8%, dipping in 2020 as aerospace and automotive output fell, then recovering strongly with demand from semiconductors, electric vehicles, renewable energy, and medical devices. Advanced materials are engineered polymers, high-performance composites, technical ceramics, specialty glasses, and special metals and alloys that deliver properties such as light weight, high strength, heat resistance, conductivity, or biocompatibility beyond conventional materials. They enable thinner chips, lighter aircraft, longer-range batteries, efficient wind turbines, and safer implants. Growth comes from electrification, the semiconductor buildout, aerospace recovery, and sustainability goals that favor lightweight and recyclable materials. The market is shifting toward specialty materials for chips, batteries, and clean energy, with more regional production. In March 2026, Toray started a new carbon fiber line in France, raising capacity at its site to 6,000 tonnes per year.
Key Report Takeaways
- By Product Type: Polymers held 31.0% share in 2026, while Composites are projected to expand at a 8.1% CAGR through 2033, driven by carbon fiber demand in aircraft, wind blades, hydrogen tanks, and lightweight electric vehicle structures.
- By Application: Electricals & Electronics held 26.0% share in 2026, while Medical Devices are projected to expand at a 7.9% CAGR through 2033, driven by implants, wearable devices, and minimally invasive tools that need biocompatible polymers and ceramics.
- By Distribution Channel: Direct held 68.0% share in 2026, while Indirect is projected to expand at a 7.0% CAGR through 2033, driven by distributors serving small and mid-sized manufacturers that need smaller volumes and technical support.
- By Region: Asia Pacific held 43.0% share in 2026, while India is projected to expand at a 8.6% CAGR through 2033, driven by semiconductor fabs, electronics manufacturing, electric vehicles, and government production-linked incentives for advanced industries.
Global Advanced Materials Market Trends and Insights
Drivers Impact Analysis
| Driver | Impact on CAGR Forecast | Geographic Relevance | Impact Timeline |
| Semiconductor and electronics expansion | High | Asia Pacific, North America | Long term (≥4 years) |
| Electrification and lightweighting in transport and energy | High | Global | Medium term (2-4 years) |
Two drivers carry the strongest influence on advanced materials demand during the forecast period.
Semiconductor Expansion Is Driving the Advanced Materials Market
Semiconductor and electronics expansion is the strongest driver of the advanced materials market. Every new chip needs ultra-pure materials.
The mechanism is massive investment in chip production. Governments in the United States, Japan, South Korea, Taiwan, India, and Europe are funding new fabs to secure supply of logic, memory, and AI chips. Each fab consumes high-purity chemicals, photoresists, specialty gases, ceramics, quartz, and advanced polymers. Smaller chip geometries and advanced packaging require new materials with tighter purity and performance. Entegris announced a US$ 700 million U.S. research investment, and Sumitomo Chemical signed an agreement with Tata Electronics to explore semiconductor materials supply in India. Data centers, smartphones, and AI servers add demand for thermal management and high-frequency materials. These trends create a long, growing pipeline for specialty materials suppliers.
Electrification and Lightweighting Are Expanding the Advanced Materials Market
Electrification and lightweighting in transport and energy are expanding the advanced materials market. Lighter, more efficient products need better materials.
The cause is pressure to cut emissions and fuel use. Electric vehicles use advanced polymers, ceramics, and composites in battery packs, motors, power electronics, and lightweight body parts. Aircraft makers rely on high-performance composites to reduce weight and fuel burn, and production rates at Airbus and Boeing are rising. Wind turbine blades use glass and carbon fiber composites, and hydrogen tanks use carbon fiber wraps. Solar panels need specialty glass, encapsulants, and coatings. Toray and Hexcel are expanding carbon fiber and composite capacity to meet aerospace and energy demand. Heat-resistant ceramics and specialty alloys are needed in jet engines and gas turbines. These shifts raise material value per product and support steady volume growth.
Restraints Impact Analysis
| Restraint | Impact on CAGR Forecast | Geographic Relevance | Impact Timeline |
| High production costs and capital intensity | High | Global | Long term (≥4 years) |
| Supply chain risks and regulatory pressure on chemicals | Medium | Global | Medium term (2-4 years) |
Two restraints limit how quickly the advanced materials market grows.
High Production Costs Slow the Advanced Materials Market
High production costs and capital intensity slow the advanced materials market. Advanced materials are expensive to make.
The specific causes are complex processes and high energy use. Carbon fiber, technical ceramics, and high-purity chemicals require specialized plants, precise process control, and long qualification periods with customers. Energy costs, especially in Europe, have raised production costs since 2022. Price premiums over conventional steel, aluminum, or commodity plastics limit adoption in cost-sensitive products such as mass-market cars. Aerospace and medical qualification can take years, delaying returns on new capacity. Recycling composites remains difficult, energy-intensive, and costly. Smaller producers struggle to fund new lines, which concentrates supply among large players. These factors slow adoption beyond high-value applications and make capacity investment risky for producers and investors.
Supply Chain and Regulatory Risks Restrict the Advanced Materials Market
Supply chain risks and regulatory pressure on chemicals restrict the advanced materials market. Materials depend on critical inputs and strict rules.
The underlying causes are concentrated supply and environmental regulation. Rare earths, gallium, germanium, graphite, and specialty minerals are concentrated in a few countries, and export controls have disrupted supply. Trade tensions between major economies affect high-tech materials flows. Regulators in Europe and the United States are restricting PFAS and other substances used in fluoropolymers and coatings, forcing reformulation. Compliance and testing costs are rising. Customers must requalify replacement materials, which takes time and money. Shipping disruptions and tariffs add delays and cost. Some buyers now hold larger inventories or dual-source critical materials, which ties up working capital. These risks raise costs and create uncertainty for producers and buyers across the value chain.
Market Opportunities
Clean Energy and Battery Materials Open a Fast-Growth Revenue Pool
Clean energy and battery materials open a fast-growth revenue pool in the advanced materials market. The energy transition needs new materials at scale.
Chemical and materials companies can capture this opportunity. Lithium-ion and next-generation batteries need advanced cathode and anode materials, separators, binders, electrolytes, and thermal barriers. Solid-state batteries require new ceramic and polymer electrolytes. Hydrogen electrolyzers and fuel cells use membranes, catalysts, and coatings. Wind and solar equipment needs composites, glass, and encapsulants. Grid equipment uses advanced insulation materials. Governments in North America, Europe, and Asia Pacific offer incentives for local battery and clean energy supply chains, creating new demand for locally produced materials. Companies with strong research and local production near battery and energy hubs can win long-term supply agreements with cell makers and equipment manufacturers.
Regional Production and Circular Materials Create a Strategic Revenue Pool
Regional production and circular materials create a strategic revenue pool in the advanced materials market. Customers want secure, traceable, and sustainable supply.
Producers can capture this opportunity by building plants close to customers. Governments in the United States, Europe, Japan, and India offer incentives for local production of chip materials, battery materials, and composites. Toray’s new line in France aims to shorten lead times for European customers. Recyclable thermoplastic composites, bio-based polymers, and recycled carbon fiber meet sustainability goals. Automakers and electronics brands increasingly ask suppliers for product carbon footprints and recycled content. Chemical recycling and mass-balance approaches help producers offer lower-carbon versions of existing grades. Companies that offer secure, low-carbon, and recyclable materials can win premium contracts and long-term partnerships.
Segment Analysis
By Product Type: Polymers Lead While Composites Grow Fastest
Polymers held 31.0% share in 2026. High-performance polymers, including fluoropolymers, polyimides, PEEK, and specialty engineering plastics, are used across electronics, automotive, medical, and industrial applications. They offer heat resistance, chemical resistance, and design flexibility. Evonik, BASF, Covestro, Arkema, and 3M are major suppliers.
Composites are the fastest-growing product type, expanding at a 8.1% CAGR through 2033. Carbon fiber and glass fiber composites deliver high strength at low weight for aircraft, wind blades, hydrogen tanks, sports goods, and electric vehicles. Toray, Hexcel, and Owens Corning lead this segment. Metals and alloys, ceramics, and glasses form other product types, with technical ceramics growing in semiconductors and batteries. For the market, composite growth reflects lightweighting needs.
By Application: Electricals & Electronics Lead While Medical Devices Grow Fastest
Electricals & Electronics held 26.0% share in 2026. Semiconductors, displays, printed circuit boards, connectors, and batteries use large volumes of specialty polymers, ceramics, high-purity chemicals, and glass. Chip fab expansion and AI hardware drive demand. Kyocera, Entegris, and Sumitomo Chemical are key suppliers.
Medical Devices are the fastest-growing application, expanding at a 7.9% CAGR through 2033. Orthopedic implants, dental materials, catheters, wearable sensors, and surgical tools need biocompatible polymers, ceramics, and alloys. Aging populations, rising chronic disease, and minimally invasive procedures support demand. Strict regulatory approvals create high barriers to entry and strong pricing for qualified suppliers. Automotive, aerospace, industrial, and power are other applications. For the market, medical growth adds high-value demand.
By Distribution Channel: Direct Leads While Indirect Grows Fastest
Direct held 68.0% share in 2026. Large manufacturers in aerospace, semiconductors, automotive, and medical devices buy directly from producers under long-term supply agreements that include technical support, qualification, and custom grades. Direct relationships help producers understand customer needs early and co-develop new materials, strengthening loyalty.
Indirect is the fastest-growing channel, expanding at a 7.0% CAGR through 2033. Distributors serve small and mid-sized manufacturers, offering smaller lot sizes, local inventory, and technical help. Distributors such as Brenntag and Univar Solutions handle logistics, repackaging, and regulatory paperwork across many countries. Online platforms are emerging for specialty materials, making it easier for engineers to find and sample grades. For the market, indirect growth widens access for smaller buyers.
Geography Analysis
Why Is North America Important to the Advanced Materials Market?
North America is important because it combines strong aerospace, defense, semiconductor, and medical device industries with leading materials companies such as 3M, Hexcel, Entegris, Huntsman, and Owens Corning. The United States is funding new chip fabs and battery plants through federal incentives, raising demand for high-purity chemicals and battery materials. Entegris is investing US$ 700 million in U.S. research. Canada and Mexico add automotive and aerospace demand, with Mexico growing as a manufacturing hub. Key barriers include high costs and PFAS regulation. One change shaping the region is the reshoring of chip and battery supply chains.
Europe Advances the Advanced Materials Market Through Innovation and Sustainability
Europe is a major advanced materials market. Germany, France, the United Kingdom, Belgium, and the Netherlands host leading companies including BASF, Evonik, Covestro, Arkema, and Solvay. Aerospace, automotive, chemicals, medical, and renewable energy industries drive demand, with Airbus a major user of composites, and Toray expanded carbon fiber capacity in France in March 2026. European Union programs fund research in batteries, chips, and circular materials. Key barriers include high energy costs and strict chemical rules. Belgium and the Netherlands host large chemical clusters that supply specialty grades across the region. One opportunity is recyclable and bio-based materials.
Which Region Is Leading the Advanced Materials Market?
Asia Pacific is leading the advanced materials market with a 43.0% share in 2026. China, Japan, South Korea, and Taiwan dominate semiconductor, electronics, battery, and display manufacturing, and host suppliers such as Toray, Kyocera, Sumitomo Chemical, and Resonac. India is the fastest-growing country, expanding at a 8.6% CAGR through 2033, supported by new chip fabs, electronics assembly, and production incentives; Sumitomo Chemical signed an agreement with Tata Electronics in October 2026. Key barriers include trade tensions and export controls. One change shaping the region is supply chain diversification toward India and other countries.
Latin America Grows the Advanced Materials Market Through Manufacturing and Mining
Latin America is a growing advanced materials market. Mexico benefits from automotive, aerospace, and electronics manufacturing linked to North America, while Brazil has strong automotive, aerospace, and medical industries, including Embraer. Chile and Argentina supply lithium for batteries, and Brazil is a major producer of niobium used in specialty alloys. Medical device plants in Costa Rica and Mexico need biocompatible polymers and alloys. Key barriers include limited local production of high-end materials, currency swings, and heavy reliance on imports from Asia Pacific and North America. One opportunity is nearshoring of electronics, medical, and automotive production to Mexico and Costa Rica.
Middle East & Africa Develops the Advanced Materials Market Through Diversification
Middle East & Africa is a developing advanced materials market. Saudi Arabia and the United Arab Emirates are investing in specialty chemicals, composites, and advanced manufacturing as part of economic diversification, supported by large petrochemical producers. Israel has strong technology and medical device sectors. South Africa supplies platinum group metals for catalysts and fuel cells. Large aerospace, defense, and renewable energy projects in the region create new demand for composites and specialty alloys. Key barriers include a limited technical workforce, small local demand, and dependence on imported technology. One change shaping the region is investment in downstream specialty chemicals and advanced manufacturing parks.
Competitive Landscape
The advanced materials market is fragmented. 3M, BASF, Evonik, Toray, and Hexcel are leading players, while Covestro, Arkema, Kyocera, Sumitomo Chemical, Entegris, Huntsman, and Owens Corning compete strongly. Many specialists focus on single material classes or applications, such as carbon fiber, technical ceramics, high-purity chemicals, or medical polymers. Japanese, European, and U.S. producers hold strong positions in high-end grades, while Chinese producers are scaling up quickly in composites, battery materials, and specialty chemicals.
Companies compete on material performance, purity, reliability, technical support, qualification history, price, and sustainability. Material data, testing support, and regulatory documentation also matter. Long qualification processes in aerospace, semiconductors, and medical devices create strong customer loyalty once a material is approved. Research spending is high, and partnerships with customers help develop custom solutions. Portfolio changes are common, as chemical groups sell commodity units and buy specialty businesses.
Strategic moves show how competition is changing. In August 2025, Entegris announced a US$ 700 million U.S. research investment. In March 2026, Toray started a new carbon fiber line in France. In October 2026, Sumitomo Chemical signed an agreement with Tata Electronics to explore semiconductor materials supply in India. These moves show competition shifting toward regional capacity and semiconductor materials.
Three themes shape vendor strategy. First, companies are building capacity near customers to secure supply chains. Second, they are focusing on semiconductor, battery, and clean energy materials. Third, they are developing recyclable and lower-carbon products.
Advanced Materials Market Industry Leaders
- 3M
- BASF
- Evonik
- Toray
- Hexcel
Recent Industry Developments
- October 2026: Sumitomo Chemical signed an agreement with Tata Electronics to explore a stable supply of semiconductor materials in India, including a possible chemicals facility - expands specialty materials supply in India.
- March 2026: Toray started up a new carbon fiber line in France, raising site capacity from 5,000 to 6,000 tonnes per year - strengthens European supply of high-performance composites.
- August 2025: Entegris announced a US$ 700 million research and development investment, including a U.S. technology center in Illinois - accelerates advanced materials for next-generation chips.
Companies Covered in the Report
- 3M
- BASF
- Evonik
- Toray
- Hexcel
- Covestro
- Arkema
- Kyocera
- Sumitomo Chemical
- Entegris
- Huntsman
- Owens Corning
Advanced Materials Market Report Scope
This report covers advanced materials, including polymers, metals and alloys, glasses, composites, and ceramics, sold through direct and indirect channels, for medical devices, automotive, aerospace, electricals and electronics, industrial, power, and other applications. The base year is 2025, and the forecast period runs from 2026 to 2033. All values are expressed in US$ Billion, with regional and segment analysis.
Product Type
- Polymers
- Metals & Alloys
- Glasses
- Composites
- Ceramics
Application
- Medical Devices
- Automotive
- Aerospace
- Electricals & Electronics
- Industrial
- Power
- Others
Distribution Channel
- Direct
- Indirect
Regions
- North America
- Europe
- Asia Pacific
- Latin America
- Middle East & Africa
Key Questions Answered in the Report
How big is the advanced materials market in 2026?
The advanced materials market is valued at US$ 77.40 billion in 2026, led by polymers and Asia Pacific.
What is the advanced materials market forecast to 2033?
The market is projected to reach US$ 121.08 billion by 2033, growing at a 6.6% CAGR and adding US$ 43.68 billion.
Which product type is growing fastest in the advanced materials market?
Composites are growing fastest at an 8.1% CAGR through 2033, driven by carbon fiber demand in aircraft, wind, and vehicles.
Which country is growing fastest in the advanced materials market?
India is growing fastest at an 8.6% CAGR through 2033, driven by chip fabs, electronics manufacturing, and production-linked incentives.
Which region holds the largest advanced materials market share?
Asia Pacific holds the largest share at 43.0% in 2026, supported by semiconductor, electronics, and battery manufacturing in China and Japan.
1. Executive Summary
1.1. Global Advanced Materials Market Snapshot
1.2. Future Projections
1.3. Key Report Takeaways
1.4. Regional Snapshot
2. Market Overview
2.1. Market Definition and Report Scope
2.2. Historical Trends 2020–2025
2.3. Market Dynamics
2.3.1. Drivers
2.3.1.1. Semiconductor Expansion Is Driving the Advanced Materials Market
2.3.1.2. Electrification and Lightweighting Are Expanding the Advanced Materials Market
2.3.2. Restraints
2.3.2.1. High Production Costs Slow the Advanced Materials Market
2.3.2.2. Supply Chain and Regulatory Risks Restrict the Advanced Materials Market
2.3.3. Market Opportunities
2.3.3.1. Clean Energy and Battery Materials Open a Fast-Growth Revenue Pool
2.3.3.2. Regional Production and Circular Materials Create a Strategic Revenue Pool
3. Global Advanced Materials Market Outlook, 2020-2033
3.1. Global Advanced Materials Market Outlook, by Product Type, Value (US$ Billion), 2020-2033
3.1.1. Polymers
3.1.2. Metals & Alloys
3.1.3. Glasses
3.1.4. Composites
3.1.5. Ceramics
3.2. Global Advanced Materials Market Outlook, by Application, Value (US$ Billion), 2020-2033
3.2.1. Medical Devices
3.2.2. Automotive
3.2.3. Aerospace
3.2.4. Electricals & Electronics
3.2.5. Industrial
3.2.6. Power
3.2.7. Others
3.3. Global Advanced Materials Market Outlook, by Distribution Channel, Value (US$ Billion), 2020-2033
3.3.1. Direct
3.3.2. Indirect
3.4. Global Advanced Materials Market Outlook, by Region, Value (US$ Billion), 2020-2033
3.4.1. North America
3.4.2. Europe
3.4.3. Asia Pacific
3.4.4. Latin America
3.4.5. Middle East & Africa
4. North America Advanced Materials Market Outlook, 2020-2033
4.1. North America Advanced Materials Market Outlook, by Product Type, Value (US$ Billion), 2020-2033
4.1.1. Polymers
4.1.2. Metals & Alloys
4.1.3. Glasses
4.1.4. Composites
4.1.5. Ceramics
4.2. North America Advanced Materials Market Outlook, by Application, Value (US$ Billion), 2020-2033
4.2.1. Medical Devices
4.2.2. Automotive
4.2.3. Aerospace
4.2.4. Electricals & Electronics
4.2.5. Industrial
4.2.6. Power
4.2.7. Others
4.3. North America Advanced Materials Market Outlook, by Distribution Channel, Value (US$ Billion), 2020-2033
4.3.1. Direct
4.3.2. Indirect
4.4. North America Advanced Materials Market Outlook, by Country, Value (US$ Billion), 2020-2033
4.4.1. United States Advanced Materials Market Outlook, by Product Type, 2020-2033
4.4.2. United States Advanced Materials Market Outlook, by Application, 2020-2033
4.4.3. United States Advanced Materials Market Outlook, by Distribution Channel, 2020-2033
4.4.4. Canada Advanced Materials Market Outlook, by Product Type, 2020-2033
4.4.5. Canada Advanced Materials Market Outlook, by Application, 2020-2033
4.4.6. Canada Advanced Materials Market Outlook, by Distribution Channel, 2020-2033
4.4.7. Mexico Advanced Materials Market Outlook, by Product Type, 2020-2033
4.4.8. Mexico Advanced Materials Market Outlook, by Application, 2020-2033
4.4.9. Mexico Advanced Materials Market Outlook, by Distribution Channel, 2020-2033
5. Europe Advanced Materials Market Outlook, 2020-2033
5.1. Europe Advanced Materials Market Outlook, by Product Type, Value (US$ Billion), 2020-2033
5.1.1. Polymers
5.1.2. Metals & Alloys
5.1.3. Glasses
5.1.4. Composites
5.1.5. Ceramics
5.2. Europe Advanced Materials Market Outlook, by Application, Value (US$ Billion), 2020-2033
5.2.1. Medical Devices
5.2.2. Automotive
5.2.3. Aerospace
5.2.4. Electricals & Electronics
5.2.5. Industrial
5.2.6. Power
5.2.7. Others
5.3. Europe Advanced Materials Market Outlook, by Distribution Channel, Value (US$ Billion), 2020-2033
5.3.1. Direct
5.3.2. Indirect
5.4. Europe Advanced Materials Market Outlook, by Country, Value (US$ Billion), 2020-2033
5.4.1. Germany Advanced Materials Market Outlook, by Product Type, 2020-2033
5.4.2. Germany Advanced Materials Market Outlook, by Application, 2020-2033
5.4.3. Germany Advanced Materials Market Outlook, by Distribution Channel, 2020-2033
5.4.4. France Advanced Materials Market Outlook, by Product Type, 2020-2033
5.4.5. France Advanced Materials Market Outlook, by Application, 2020-2033
5.4.6. France Advanced Materials Market Outlook, by Distribution Channel, 2020-2033
5.4.7. United Kingdom Advanced Materials Market Outlook, by Product Type, 2020-2033
5.4.8. United Kingdom Advanced Materials Market Outlook, by Application, 2020-2033
5.4.9. United Kingdom Advanced Materials Market Outlook, by Distribution Channel, 2020-2033
5.4.10. Belgium Advanced Materials Market Outlook, by Product Type, 2020-2033
5.4.11. Belgium Advanced Materials Market Outlook, by Application, 2020-2033
5.4.12. Belgium Advanced Materials Market Outlook, by Distribution Channel, 2020-2033
5.4.13. Netherlands Advanced Materials Market Outlook, by Product Type, 2020-2033
5.4.14. Netherlands Advanced Materials Market Outlook, by Application, 2020-2033
5.4.15. Netherlands Advanced Materials Market Outlook, by Distribution Channel, 2020-2033
6. Asia Pacific Advanced Materials Market Outlook, 2020-2033
6.1. Asia Pacific Advanced Materials Market Outlook, by Product Type, Value (US$ Billion), 2020-2033
6.1.1. Polymers
6.1.2. Metals & Alloys
6.1.3. Glasses
6.1.4. Composites
6.1.5. Ceramics
6.2. Asia Pacific Advanced Materials Market Outlook, by Application, Value (US$ Billion), 2020-2033
6.2.1. Medical Devices
6.2.2. Automotive
6.2.3. Aerospace
6.2.4. Electricals & Electronics
6.2.5. Industrial
6.2.6. Power
6.2.7. Others
6.3. Asia Pacific Advanced Materials Market Outlook, by Distribution Channel, Value (US$ Billion), 2020-2033
6.3.1. Direct
6.3.2. Indirect
6.4. Asia Pacific Advanced Materials Market Outlook, by Country, Value (US$ Billion), 2020-2033
6.4.1. China Advanced Materials Market Outlook, by Product Type, 2020-2033
6.4.2. China Advanced Materials Market Outlook, by Application, 2020-2033
6.4.3. China Advanced Materials Market Outlook, by Distribution Channel, 2020-2033
6.4.4. Japan Advanced Materials Market Outlook, by Product Type, 2020-2033
6.4.5. Japan Advanced Materials Market Outlook, by Application, 2020-2033
6.4.6. Japan Advanced Materials Market Outlook, by Distribution Channel, 2020-2033
6.4.7. South Korea Advanced Materials Market Outlook, by Product Type, 2020-2033
6.4.8. South Korea Advanced Materials Market Outlook, by Application, 2020-2033
6.4.9. South Korea Advanced Materials Market Outlook, by Distribution Channel, 2020-2033
6.4.10. Taiwan Advanced Materials Market Outlook, by Product Type, 2020-2033
6.4.11. Taiwan Advanced Materials Market Outlook, by Application, 2020-2033
6.4.12. Taiwan Advanced Materials Market Outlook, by Distribution Channel, 2020-2033
6.4.13. India Advanced Materials Market Outlook, by Product Type, 2020-2033
6.4.14. India Advanced Materials Market Outlook, by Application, 2020-2033
6.4.15. India Advanced Materials Market Outlook, by Distribution Channel, 2020-2033
7. Latin America Advanced Materials Market Outlook, 2020-2033
7.1. Latin America Advanced Materials Market Outlook, by Product Type, Value (US$ Billion), 2020-2033
7.1.1. Polymers
7.1.2. Metals & Alloys
7.1.3. Glasses
7.1.4. Composites
7.1.5. Ceramics
7.2. Latin America Advanced Materials Market Outlook, by Application, Value (US$ Billion), 2020-2033
7.2.1. Medical Devices
7.2.2. Automotive
7.2.3. Aerospace
7.2.4. Electricals & Electronics
7.2.5. Industrial
7.2.6. Power
7.2.7. Others
7.3. Latin America Advanced Materials Market Outlook, by Distribution Channel, Value (US$ Billion), 2020-2033
7.3.1. Direct
7.3.2. Indirect
7.4. Latin America Advanced Materials Market Outlook, by Country, Value (US$ Billion), 2020-2033
7.4.1. Mexico Advanced Materials Market Outlook, by Product Type, 2020-2033
7.4.2. Mexico Advanced Materials Market Outlook, by Application, 2020-2033
7.4.3. Mexico Advanced Materials Market Outlook, by Distribution Channel, 2020-2033
7.4.4. Brazil Advanced Materials Market Outlook, by Product Type, 2020-2033
7.4.5. Brazil Advanced Materials Market Outlook, by Application, 2020-2033
7.4.6. Brazil Advanced Materials Market Outlook, by Distribution Channel, 2020-2033
7.4.7. Chile Advanced Materials Market Outlook, by Product Type, 2020-2033
7.4.8. Chile Advanced Materials Market Outlook, by Application, 2020-2033
7.4.9. Chile Advanced Materials Market Outlook, by Distribution Channel, 2020-2033
7.4.10. Argentina Advanced Materials Market Outlook, by Product Type, 2020-2033
7.4.11. Argentina Advanced Materials Market Outlook, by Application, 2020-2033
7.4.12. Argentina Advanced Materials Market Outlook, by Distribution Channel, 2020-2033
7.4.13. Costa Rica Advanced Materials Market Outlook, by Product Type, 2020-2033
7.4.14. Costa Rica Advanced Materials Market Outlook, by Application, 2020-2033
7.4.15. Costa Rica Advanced Materials Market Outlook, by Distribution Channel, 2020-2033
8. Middle East & Africa Advanced Materials Market Outlook, 2020-2033
8.1. Middle East & Africa Advanced Materials Market Outlook, by Product Type, Value (US$ Billion), 2020-2033
8.1.1. Polymers
8.1.2. Metals & Alloys
8.1.3. Glasses
8.1.4. Composites
8.1.5. Ceramics
8.2. Middle East & Africa Advanced Materials Market Outlook, by Application, Value (US$ Billion), 2020-2033
8.2.1. Medical Devices
8.2.2. Automotive
8.2.3. Aerospace
8.2.4. Electricals & Electronics
8.2.5. Industrial
8.2.6. Power
8.2.7. Others
8.3. Middle East & Africa Advanced Materials Market Outlook, by Distribution Channel, Value (US$ Billion), 2020-2033
8.3.1. Direct
8.3.2. Indirect
8.4. Middle East & Africa Advanced Materials Market Outlook, by Country, Value (US$ Billion), 2020-2033
8.4.1. Saudi Arabia Advanced Materials Market Outlook, by Product Type, 2020-2033
8.4.2. Saudi Arabia Advanced Materials Market Outlook, by Application, 2020-2033
8.4.3. Saudi Arabia Advanced Materials Market Outlook, by Distribution Channel, 2020-2033
8.4.4. United Arab Emirates Advanced Materials Market Outlook, by Product Type, 2020-2033
8.4.5. United Arab Emirates Advanced Materials Market Outlook, by Application, 2020-2033
8.4.6. United Arab Emirates Advanced Materials Market Outlook, by Distribution Channel, 2020-2033
8.4.7. Israel Advanced Materials Market Outlook, by Product Type, 2020-2033
8.4.8. Israel Advanced Materials Market Outlook, by Application, 2020-2033
8.4.9. Israel Advanced Materials Market Outlook, by Distribution Channel, 2020-2033
8.4.10. South Africa Advanced Materials Market Outlook, by Product Type, 2020-2033
8.4.11. South Africa Advanced Materials Market Outlook, by Application, 2020-2033
8.4.12. South Africa Advanced Materials Market Outlook, by Distribution Channel, 2020-2033
9. Competitive Landscape
9.1. Market Concentration and Industry Leaders
9.2. Competitive Differentiation
9.3. Strategic Moves and Market Direction
9.4. Recent Industry Developments
9.5. Company Profiles
9.5.1. 3M
9.5.2. BASF
9.5.3. Evonik
9.5.4. Toray
9.5.5. Hexcel
9.5.6. Covestro
9.5.7. Arkema
9.5.8. Kyocera
9.5.9. Sumitomo Chemical
9.5.10. Entegris
9.5.11. Huntsman
9.5.12. Owens Corning
10. Appendix
10.1. Research Methodology
10.2. Report Assumptions
10.3. Acronyms and Abbreviations
| Product Type | Polymers, Metals & Alloys, Glasses, Composites, Ceramics |
| Application | Medical Devices, Automotive, Aerospace, Electricals & Electronics, Industrial, Power, Others |
| Distribution Channel | Direct, Indirect |
| Regions | North America, Europe, Asia Pacific, Latin America, Middle East & Africa |
Our Research Methodology
Considering the volatility of business today, traditional approaches to strategizing a game plan can be unfruitful if not detrimental. True ambiguity is no way to determine a forecast. A myriad of predetermined factors must be accounted for such as the degree of risk involved, the magnitude of circumstances, as well as conditions or consequences that are not known or unpredictable. To circumvent binary views that cast uncertainty, the application of market research intelligence to strategically posture, move, and enable actionable outcomes is necessary.
View Methodology
Quality Assured
Rigorous Validation Process

Confidentiality Assured
End-to-end Data Security

Custom Research Services
Tailored To Your Objectives
FAQs
The advanced materials market is valued at US$ 77.40 billion in 2026, led by polymers and Asia Pacific.
The market is projected to reach US$ 121.08 billion by 2033, growing at a 6.6% CAGR and adding US$ 43.68 billion.
Composites are growing fastest at an 8.1% CAGR through 2033, driven by carbon fiber demand in aircraft, wind, and vehicles.
India is growing fastest at an 8.6% CAGR through 2033, driven by chip fabs, electronics manufacturing, and production-linked incentives.
Asia Pacific holds the largest share at 43.0% in 2026, supported by semiconductor, electronics, and battery manufacturing in China and Japan.
Related Reports
Biopolymer Coatings Market Size, Share, Insights, Competitive Landscape, and Forecast 2026 to 2033
Explore the biopolymer coatings market, projected to reach US$ 2.5 billion by 2033 at a 7.6% CAGR, with product, technology and regional insights.
Dry Construction Market Size, Share, Insights, Competitive Landscape, and Forecast 2026 to 2033
Explore the dry construction market, projected to reach US$ 134.87 billion by 2033 at a 4.7% CAGR, with material, system and regional insights.
Waterproofing Admixtures Market Size, Share, Insights, Competitive Landscape, and Forecast 2026 to 2033
Waterproofing admixtures market to grow from US$ 2.4 billion in 2026 to US$ 3.6 billion by 2033 at a 6.0% CAGR. Explore products, applications and regions.
Vinyl Flooring Market Size, Share, Insights, Competitive Landscape, and Forecast 2026 to 2033
Vinyl flooring market to grow from US$ 46.5 billion in 2026 to US$ 72.6 billion by 2033 at a 6.6% CAGR. Explore product trends, segments and regional insights.
Unsaturated Polyester Resin Market Size, Share, Insights, Competitive Landscape, and Forecast 2026 to 2033
Explore the unsaturated polyester resin market, forecast to reach US$18.1 billion by 2033 at 4.6% CAGR, with resin, end-use and regional insights.
Renewable Chemicals Market Size, Share, Insights, Competitive Landscape, and Forecast 2026 to 2033
Explore the renewable chemicals market, projected to reach US$379.48 billion by 2033 at 11.2% CAGR, with product, feedstock and regional insights.