



Agricultural Lubricant Market
Agricultural Lubricant Market Size, Share, Insights, Competitive Landscape, and Forecast 2026 to 2033
How Fast Is the Agricultural Lubricant Market Growing?
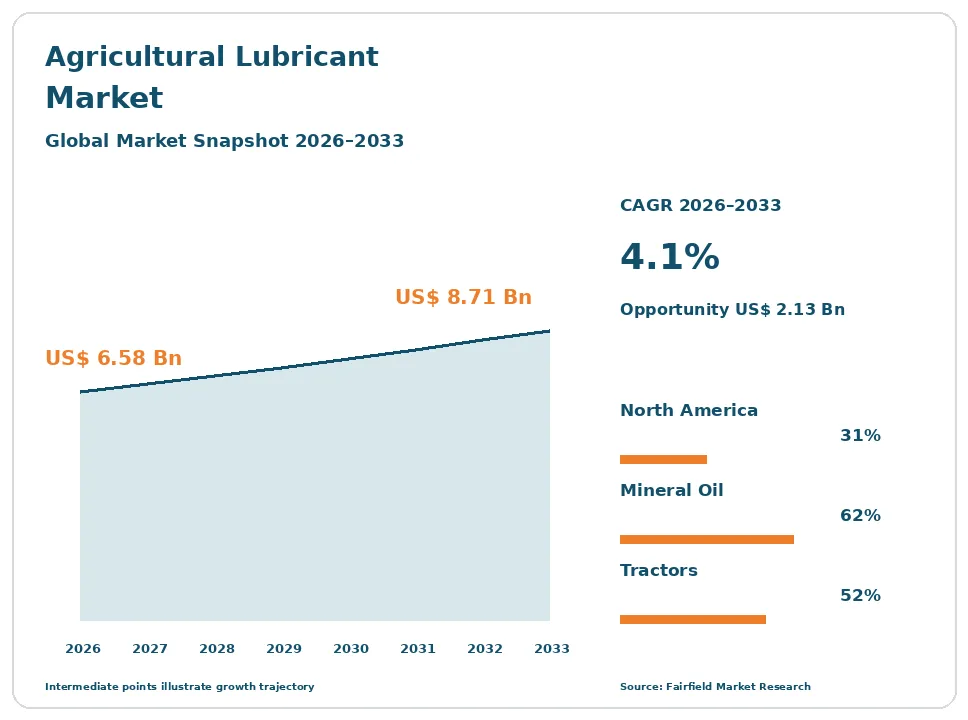
The global agricultural lubricant market size is expected to be valued at US$ 6.58 billion in 2026 and projected to reach US$ 8.71 billion by 2033, growing at a CAGR of 4.1% between 2026 and 2033.
Between 2020 and 2025, the market grew at a CAGR of about 3.6%, as farm mechanization spread in emerging economies, larger and more powerful tractors and combines entered service, and farmers paid more attention to machine uptime during busy seasons. Agricultural lubricants are oils, greases, and fluids that protect farm machinery from wear, heat, rust, and contamination. They include engine oils, universal tractor transmission oils, hydraulic fluids, gear oils, greases, and coolants used in tractors, combines, harvesters, sprayers, balers, and irrigation pumps. Tractor oil must handle dust, heavy loads, long working hours, and wide temperature ranges. Growth comes from mechanization, larger farms, precision agriculture, and modern engines with emission controls that need higher-quality oils. The market is shifting toward synthetic and bio-based lubricants, longer drain intervals, and multi-purpose fluids. In February 2026, Savita Oil Technologies signed a multi-year deal to supply genuine engine oils for Mahindra tractors.
Key Report Takeaways
- By Base Oil: Mineral Oil held 62.0% share in 2026, while Bio-Based is projected to expand at a 6.9% CAGR through 2033, driven by environmental rules, spill concerns near soil and water, and sustainability goals of farmers and food companies.
- By Product Type: Engine Oil held 38.0% share in 2026, while Hydraulic & Transmission Fluids are projected to expand at a 4.7% CAGR through 2033, driven by advanced hydraulics, power shift transmissions, and implements on modern tractors.
- By Equipment: Tractors held 52.0% share in 2026, while Combines & Harvesters are projected to expand at a 4.6% CAGR through 2033, driven by larger harvesting machines, contract harvesting services, and mechanized grain production in emerging markets.
- By Region: North America held 31.0% share in 2026, while Asia Pacific is projected to expand at a 5.3% CAGR through 2033, driven by rapid tractor sales growth, government mechanization subsidies, and expanding farm sizes in India and China.
Global Agricultural Lubricant Market Trends and Insights
Drivers Impact Analysis
| Driver | Impact on CAGR Forecast | Geographic Relevance | Impact Timeline |
| Farm mechanization and growing machinery fleets | High | Asia Pacific, Latin America, Middle East & Africa | Long term (≥4 years) |
| Advanced machinery needing high-performance lubricants | Medium | North America, Europe | Medium term (2-4 years) |
Two drivers carry the strongest influence on agricultural lubricant demand during the forecast period.
Farm Mechanization Is Driving the Agricultural Lubricant Market
Farm mechanization and growing machinery fleets are the strongest driver of the agricultural lubricant market. More machines need more oil.
The mechanism is the steady replacement of manual and animal labor with machines. Farm workers are becoming scarce and more expensive as people move to cities, so farmers in India, China, Brazil, Indonesia, and many countries across Middle East & Africa are buying tractors, harvesters, and sprayers. India is the world’s largest tractor market by units, and government subsidies and rental programs help small farmers access machines. Each machine needs engine oil, transmission fluid, hydraulic oil, and grease, with regular changes throughout its working life. Food demand from a growing global population pushes farmers to raise productivity. Contract farming and custom hiring services keep machines running for more hours each year. These trends create steady, recurring demand for agricultural lubricants.
Advanced Machinery Is Expanding the Agricultural Lubricant Market
Advanced machinery needing high-performance lubricants is expanding the agricultural lubricant market. Modern equipment demands better oils.
The cause is changes in engine and machine design. New tractors and combines in North America and Europe use engines that meet strict emission standards, with exhaust after-treatment systems that need low-ash oils. Larger machines run at higher pressures and temperatures in hydraulics and transmissions. Precision farming equipment, auto-steer systems, and expensive implements make downtime costly, so farmers prefer premium oils that extend drain intervals and protect parts. Machinery makers such as John Deere, CNH Industrial, AGCO, and Mahindra specify approved oils and sell their own branded fluids. Farmers who invest hundreds of thousands of dollars in a machine see premium lubricants as cheap insurance against repairs. These shifts raise average prices and support value growth.
Restraints Impact Analysis
| Restraint | Impact on CAGR Forecast | Geographic Relevance | Impact Timeline |
| Volatile crude oil and base oil prices | High | Global | Medium term (2-4 years) |
| Longer drain intervals and price sensitivity | Medium | Asia Pacific, Latin America, Middle East & Africa | Long term (≥4 years) |
Two restraints limit how quickly the agricultural lubricant market grows.
Price Volatility Slows the Agricultural Lubricant Market
Volatile crude oil and base oil prices slow the agricultural lubricant market. Input costs swing sharply.
The specific causes are oil market cycles and supply disruptions. Most agricultural lubricants are made from mineral base oils refined from crude oil, and additive packages also depend on petrochemicals. When crude prices rise, lubricant makers must raise prices, but farmers facing low crop prices and high fertilizer and fuel costs may delay oil changes or buy cheaper products. Geopolitical events and refinery outages affect base oil supply. Farm incomes vary with weather and commodity markets, making spending unpredictable. Small blenders with limited buying power are hit hardest, and some pass costs on slowly, which hurts their profits. Transport costs to remote rural areas add further pressure. These swings squeeze margins and slow volume growth.
Longer Drain Intervals Restrict the Agricultural Lubricant Market
Longer drain intervals and price sensitivity restrict the agricultural lubricant market. Better oils last longer, reducing volumes.
The underlying causes are product improvements and customer budgets. Synthetic and premium oils allow longer periods between changes, so each machine uses less oil per year. In emerging markets, many small farmers buy low-cost, unbranded, or counterfeit oils that do not meet standards. Some farmers stretch oil change intervals to save money. Electric and hybrid farm machinery, though still rare, may reduce engine oil needs in the long term. Fake products sold in look-alike packaging damage engines and harm trust in brands, and fighting counterfeits requires investment in secure packaging and dealer checks. Farmers in many regions also lack awareness of the correct oil grades for their machines, so they choose on price alone. These factors limit volume growth and value growth in parts of the market.
Market Opportunities
Bio-Based and Synthetic Lubricants Open a Fast-Growth Revenue Pool
Bio-based lubricants and synthetic oils open a fast-growth revenue pool in the agricultural lubricant market. Farmers and regulators want cleaner and longer-lasting products.
Lubricant makers can capture this opportunity. Biodegradable hydraulic fluids and greases made from vegetable oils reduce harm if leaks or spills reach soil, rivers, and groundwater, and they are often required near water or in forestry. Synthetic oils provide better protection in extreme temperatures and allow longer drain intervals. TotalEnergies expanded its bio-based lubricant range for agriculture. Food companies and retailers that set sustainability targets for their suppliers are encouraging farmers to adopt greener practices, including better lubricants. Government programs in Europe support bio-based products. Improved additive chemistry has closed much of the performance gap with mineral oils. Companies that offer certified, high-performance sustainable products can capture premium demand.
OEM Partnerships and Digital Services Create a Loyalty Revenue Pool
OEM partnerships and digital services create a loyalty revenue pool in the agricultural lubricant market. Machine makers and dealers strongly influence which oil farmers buy.
Lubricant suppliers can capture this opportunity. Genuine oil programs with tractor and combine makers secure steady volumes through dealer workshops and service contracts, and Savita Oil Technologies’ multi-year deal with Mahindra in February 2026 is one example. Factory fill agreements, where a supplier’s oil goes into new machines at the plant, often lead to long-term aftermarket sales. Oil analysis services test used oil samples to detect wear, contamination, and the right time for a change, helping farmers avoid breakdowns. Sensors on connected machines can track oil condition in real time and send alerts through farm management apps. Multi-purpose products with many OEM approvals simplify farm stock. Companies that build these partnerships and services can win loyal customers and stable margins.
Segment Analysis
By Base Oil: Mineral Oil Leads While Bio-Based Grows Fastest
Mineral Oil held 62.0% share in 2026. Mineral oil-based lubricants are affordable, widely available through rural dealers, and suitable for most older and mid-range machines, which makes them the standard choice for many farmers in Asia Pacific, Latin America, and Middle East & Africa. Large refiners and national oil companies supply these products in big volumes at competitive prices.
Bio-Based is the fastest-growing base oil, expanding at a 6.9% CAGR through 2033. Lubricants made from rapeseed, soybean, and other vegetable oils break down naturally and reduce environmental damage from leaks, which matters on farms close to water sources and in forestry. Synthetic oils form another segment, valued for long drain intervals and protection in extreme weather. For the market, bio-based growth reflects sustainability pressure from regulators and food companies.
By Product Type: Engine Oil Leads While Hydraulic & Transmission Fluids Grow Fastest
Engine Oil held 38.0% share in 2026. Every diesel engine in tractors, combines, and pumps needs regular oil changes, and modern engines with emission controls require higher-grade low-ash oils. Engine oil is the product farmers buy most often.
Hydraulic & Transmission Fluids are the fastest-growing product type, expanding at a 4.7% CAGR through 2033. Modern tractors use complex hydraulic systems to lift and power implements and advanced transmissions that shift under load, and universal tractor transmission oils serve the transmission, hydraulics, and wet brakes from one tank. Larger machines hold more fluid, and some combines carry over a hundred liters. Gear oils, greases, and coolants form other product types. For the market, this reflects growing machine complexity.
By Equipment: Tractors Lead While Combines & Harvesters Grow Fastest
Tractors held 52.0% share in 2026. Tractors are the most common farm machine and work across many tasks during the year, from ploughing and planting to hauling and spraying. Millions of new tractors are sold each year, mainly in India, China, North America, and Europe.
Combines & Harvesters are the fastest-growing equipment, expanding at a 4.6% CAGR through 2033. Larger combines with powerful engines and hydraulic systems use more lubricants, and contract harvesting services in India, Brazil, and China keep machines running long hours. Sprayers, balers, irrigation pumps, and other implements form other segments, each with specific grease and oil needs. For the market, this reflects deeper and faster harvesting mechanization.
Geography Analysis
Which Region Is Leading the Agricultural Lubricant Market?
North America is leading the agricultural lubricant market with a 31.0% share in 2026. The United States and Canada have large farms that use powerful tractors, combines, and sprayers for long hours, and farmers often choose premium and synthetic oils to protect expensive machines. John Deere, CNH Industrial, and AGCO have large dealer networks that sell branded fluids. ExxonMobil, Chevron, Valvoline, Phillips 66, and CHS supply farm lubricants through cooperatives and dealers. Key barriers include price sensitivity when crop prices fall. One change shaping the region is the use of oil analysis and connected machine data.
Europe Advances the Agricultural Lubricant Market Through Sustainability
Europe is a major agricultural lubricant market. France, Germany, the United Kingdom, Italy, and Poland have highly mechanized farms and strict environmental rules that encourage biodegradable fluids. TotalEnergies, Shell, FUCHS, and BP (Castrol) are strong suppliers, and specialist firms such as Morris Lubricants serve farmers directly. Machinery makers such as CLAAS and Fendt demand high-quality approved oils. Farmers in the region face strict rules on spills and waste oil disposal. Key barriers include high costs and pressure on farm incomes. One opportunity is bio-based hydraulic oils and greases for farms near rivers and protected areas.
Which Region Is Growing Fastest in the Agricultural Lubricant Market?
Asia Pacific is growing fastest in the agricultural lubricant market at a 5.3% CAGR through 2033. India is the world’s largest tractor market by units, with Mahindra, TAFE, Escorts Kubota, and Sonalika selling large numbers of tractors, and government subsidies support farm machinery purchases. China is consolidating small farms and buying larger machines. Indonesia, Thailand, Vietnam, and Australia add demand. Rising farm wages are speeding up mechanization across the region. Key barriers include counterfeit and low-quality oils. One change shaping the region is the growth of genuine oil programs with tractor makers.
Latin America Grows the Agricultural Lubricant Market Through Large-Scale Farming
Latin America is a growing agricultural lubricant market. Brazil and Argentina are major producers of soybeans, corn, sugarcane, and cotton, using large tractors, combines, and sprayers that run for long hours in harvest seasons. Mexico, Colombia, and Paraguay add demand. Sugarcane harvesters and transport equipment need heavy-duty lubricants, and hot, dusty conditions shorten oil life. Machinery dealers in Brazil are expanding service networks into new farming frontiers, bringing branded oils to more farms. Large agribusiness groups buy lubricants in bulk under supply contracts. Key barriers include currency swings and price-sensitive buyers. One opportunity is premium oils for large commercial farms.
Middle East & Africa Develops the Agricultural Lubricant Market Through Mechanization
Middle East & Africa is a developing agricultural lubricant market. South Africa, Egypt, Morocco, Kenya, and Nigeria are expanding farm mechanization, often supported by government programs and machinery hire services. Saudi Arabia uses machinery for irrigated farming in desert areas, where heat and dust stress engines and require frequent oil changes. International lubricant brands distribute through local partners, while national oil companies in the region are expanding their own lubricant businesses. Key barriers include low incomes, limited dealer networks, and widespread counterfeit products. One change shaping the region is the spread of government-backed mechanization programs.
Competitive Landscape
The agricultural lubricant market is moderately consolidated. Shell, ExxonMobil, TotalEnergies, BP (Castrol), and FUCHS are leading players, while Chevron, Valvoline, Phillips 66, Petronas Lubricants, Indian Oil, Savita Oil Technologies, and Morris Lubricants compete strongly. Machinery makers also sell their own branded oils, and many regional blenders serve local markets.
Companies compete on product performance, OEM approvals, brand trust, distribution reach in rural areas, price, and technical support. Rural dealer networks, farm stores, and cooperatives are critical sales channels in every region. Machinery makers’ genuine oil programs influence buying decisions strongly, and factory fill contracts give suppliers an advantage. Additive companies such as Lubrizol and Afton Chemical support product development. Brand trust is especially important in rural markets, where farmers rely on advice from dealers and mechanics. Local blenders compete on price and flexible packaging sizes for small farms.
Strategic moves show how competition is changing. In April 2025, TotalEnergies expanded its bio-based agricultural lubricants. In January 2026, Morris Lubricants promoted its multi-approval Agrimax range at LAMMA. In February 2026, Savita Oil Technologies signed a multi-year genuine oil deal with Mahindra. These moves show competition shifting toward OEM partnerships, multi-approval product ranges, and sustainable products.
Three themes shape vendor strategy. First, companies are building genuine oil partnerships with machinery makers. Second, they are developing bio-based and synthetic products. Third, they are expanding rural distribution in Asia Pacific and Latin America.
Agricultural Lubricant Market Industry Leaders
- Shell
- ExxonMobil
- TotalEnergies
- BP (Castrol)
- FUCHS
Recent Industry Developments
- February 2026: Savita Oil Technologies signed a multi-year partnership to supply Mahindra Tractors genuine engine oils under the MStar brand through franchise workshops and parts distributors - strengthens tractor oil supply in India.
- January 2026: Morris Lubricants showcased its Agrimax range of agricultural oils, lubricants, and greases with wide OEM approvals at LAMMA 2026 in Birmingham - promotes multi-purpose farm machinery lubricants.
- April 2025: TotalEnergies expanded its bio-based lubricant lineup for agriculture - adds bio-based lubricants for sustainable farming.
Companies Covered in the Report
- Shell
- ExxonMobil
- TotalEnergies
- BP (Castrol)
- FUCHS
- Chevron
- Valvoline
- Phillips 66
- Petronas Lubricants
- Indian Oil
- Savita Oil Technologies
- Morris Lubricants
Agricultural Lubricant Market Report Scope
This report covers agricultural lubricants, including mineral oil-based, synthetic, and bio-based products such as engine oils, hydraulic and transmission fluids, gear oils, greases, and coolants, used in tractors, combines and harvesters, sprayers, implements, and other farm equipment, sold through OEM and aftermarket channels. The base year is 2025, and the forecast period runs from 2026 to 2033. All values are expressed in US$ Billion.
Base Oil
- Mineral Oil
- Synthetic
- Bio-Based
Product Type
- Engine Oil
- Hydraulic & Transmission Fluids
- Gear Oil
- Grease
- Coolants
Equipment
- Tractors
- Combines & Harvesters
- Sprayers
- Implements & Others
Regions
- North America
- Europe
- Asia Pacific
- Latin America
- Middle East & Africa
Key Questions Answered in the Report
How big is the agricultural lubricant market in 2026?
The agricultural lubricant market is valued at US$ 6.58 billion in 2026, led by mineral oil-based engine oils and North America.
What is the agricultural lubricant market forecast to 2033?
The market is projected to reach US$ 8.71 billion by 2033, growing at a 4.1% CAGR and adding US$ 2.13 billion.
Which base oil is growing fastest in the agricultural lubricant market?
Bio-based lubricants are growing fastest at a 6.9% CAGR through 2033, driven by environmental rules and sustainability goals.
Which region is growing fastest in the agricultural lubricant market?
Asia Pacific is growing fastest at a 5.3% CAGR through 2033, driven by tractor sales growth and mechanization subsidies in India.
Which region holds the largest agricultural lubricant market share?
North America holds the largest share at 31.0% in 2026, supported by large farms, powerful machines, and premium oil demand.
1. Executive Summary
1.1. Global Agricultural Lubricant Market Snapshot
1.2. Future Projections, 2026-2033
1.3. Key Market Trends
1.4. Regional Snapshot
2. Market Overview
2.1. Market Definition and Report Scope
2.2. Historical Market Trends, 2020-2025
2.3. Market Dynamics
2.3.1. Drivers Impact Analysis
2.3.1.1. Farm Mechanization Is Driving the Agricultural Lubricant Market
2.3.1.2. Advanced Machinery Is Expanding the Agricultural Lubricant Market
2.3.2. Restraints Impact Analysis
2.3.2.1. Price Volatility Slows the Agricultural Lubricant Market
2.3.2.2. Longer Drain Intervals Restrict the Agricultural Lubricant Market
2.3.3. Market Opportunities
2.3.3.1. Bio-Based and Synthetic Lubricants Open a Fast-Growth Revenue Pool
2.3.3.2. OEM Partnerships and Digital Services Create a Loyalty Revenue Pool
3. Global Agricultural Lubricant Market Outlook, 2020-2033
3.1. Global Agricultural Lubricant Market Outlook, by Base Oil, Value (US$ Billion), 2020-2033
3.1.1. Mineral Oil
3.1.2. Synthetic
3.1.3. Bio-Based
3.2. Global Agricultural Lubricant Market Outlook, by Product Type, Value (US$ Billion), 2020-2033
3.2.1. Engine Oil
3.2.2. Hydraulic & Transmission Fluids
3.2.3. Gear Oil
3.2.4. Grease
3.2.5. Coolants
3.3. Global Agricultural Lubricant Market Outlook, by Equipment, Value (US$ Billion), 2020-2033
3.3.1. Tractors
3.3.2. Combines & Harvesters
3.3.3. Sprayers
3.3.4. Implements & Others
3.4. Global Agricultural Lubricant Market Outlook, by Region, Value (US$ Billion), 2020-2033
3.4.1. North America
3.4.2. Europe
3.4.3. Asia Pacific
3.4.4. Latin America
3.4.5. Middle East & Africa
4. North America Agricultural Lubricant Market Outlook, 2020-2033
4.1. North America Agricultural Lubricant Market Outlook, by Base Oil, Value (US$ Billion), 2020-2033
4.1.1. Mineral Oil
4.1.2. Synthetic
4.1.3. Bio-Based
4.2. North America Agricultural Lubricant Market Outlook, by Product Type, Value (US$ Billion), 2020-2033
4.2.1. Engine Oil
4.2.2. Hydraulic & Transmission Fluids
4.2.3. Gear Oil
4.2.4. Grease
4.2.5. Coolants
4.3. North America Agricultural Lubricant Market Outlook, by Equipment, Value (US$ Billion), 2020-2033
4.3.1. Tractors
4.3.2. Combines & Harvesters
4.3.3. Sprayers
4.3.4. Implements & Others
4.4. North America Agricultural Lubricant Market Outlook, by Country, Value (US$ Billion), 2020-2033
4.4.1. United States Agricultural Lubricant Market Outlook, by Base Oil, 2020-2033
4.4.2. United States Agricultural Lubricant Market Outlook, by Product Type, 2020-2033
4.4.3. United States Agricultural Lubricant Market Outlook, by Equipment, 2020-2033
4.4.4. Canada Agricultural Lubricant Market Outlook, by Base Oil, 2020-2033
4.4.5. Canada Agricultural Lubricant Market Outlook, by Product Type, 2020-2033
4.4.6. Canada Agricultural Lubricant Market Outlook, by Equipment, 2020-2033
5. Europe Agricultural Lubricant Market Outlook, 2020-2033
5.1. Europe Agricultural Lubricant Market Outlook, by Base Oil, Value (US$ Billion), 2020-2033
5.1.1. Mineral Oil
5.1.2. Synthetic
5.1.3. Bio-Based
5.2. Europe Agricultural Lubricant Market Outlook, by Product Type, Value (US$ Billion), 2020-2033
5.2.1. Engine Oil
5.2.2. Hydraulic & Transmission Fluids
5.2.3. Gear Oil
5.2.4. Grease
5.2.5. Coolants
5.3. Europe Agricultural Lubricant Market Outlook, by Equipment, Value (US$ Billion), 2020-2033
5.3.1. Tractors
5.3.2. Combines & Harvesters
5.3.3. Sprayers
5.3.4. Implements & Others
5.4. Europe Agricultural Lubricant Market Outlook, by Country, Value (US$ Billion), 2020-2033
5.4.1. France Agricultural Lubricant Market Outlook, by Base Oil, 2020-2033
5.4.2. France Agricultural Lubricant Market Outlook, by Product Type, 2020-2033
5.4.3. France Agricultural Lubricant Market Outlook, by Equipment, 2020-2033
5.4.4. Germany Agricultural Lubricant Market Outlook, by Base Oil, 2020-2033
5.4.5. Germany Agricultural Lubricant Market Outlook, by Product Type, 2020-2033
5.4.6. Germany Agricultural Lubricant Market Outlook, by Equipment, 2020-2033
5.4.7. United Kingdom Agricultural Lubricant Market Outlook, by Base Oil, 2020-2033
5.4.8. United Kingdom Agricultural Lubricant Market Outlook, by Product Type, 2020-2033
5.4.9. United Kingdom Agricultural Lubricant Market Outlook, by Equipment, 2020-2033
5.4.10. Italy Agricultural Lubricant Market Outlook, by Base Oil, 2020-2033
5.4.11. Italy Agricultural Lubricant Market Outlook, by Product Type, 2020-2033
5.4.12. Italy Agricultural Lubricant Market Outlook, by Equipment, 2020-2033
5.4.13. Poland Agricultural Lubricant Market Outlook, by Base Oil, 2020-2033
5.4.14. Poland Agricultural Lubricant Market Outlook, by Product Type, 2020-2033
5.4.15. Poland Agricultural Lubricant Market Outlook, by Equipment, 2020-2033
6. Asia Pacific Agricultural Lubricant Market Outlook, 2020-2033
6.1. Asia Pacific Agricultural Lubricant Market Outlook, by Base Oil, Value (US$ Billion), 2020-2033
6.1.1. Mineral Oil
6.1.2. Synthetic
6.1.3. Bio-Based
6.2. Asia Pacific Agricultural Lubricant Market Outlook, by Product Type, Value (US$ Billion), 2020-2033
6.2.1. Engine Oil
6.2.2. Hydraulic & Transmission Fluids
6.2.3. Gear Oil
6.2.4. Grease
6.2.5. Coolants
6.3. Asia Pacific Agricultural Lubricant Market Outlook, by Equipment, Value (US$ Billion), 2020-2033
6.3.1. Tractors
6.3.2. Combines & Harvesters
6.3.3. Sprayers
6.3.4. Implements & Others
6.4. Asia Pacific Agricultural Lubricant Market Outlook, by Country, Value (US$ Billion), 2020-2033
6.4.1. India Agricultural Lubricant Market Outlook, by Base Oil, 2020-2033
6.4.2. India Agricultural Lubricant Market Outlook, by Product Type, 2020-2033
6.4.3. India Agricultural Lubricant Market Outlook, by Equipment, 2020-2033
6.4.4. China Agricultural Lubricant Market Outlook, by Base Oil, 2020-2033
6.4.5. China Agricultural Lubricant Market Outlook, by Product Type, 2020-2033
6.4.6. China Agricultural Lubricant Market Outlook, by Equipment, 2020-2033
6.4.7. Indonesia Agricultural Lubricant Market Outlook, by Base Oil, 2020-2033
6.4.8. Indonesia Agricultural Lubricant Market Outlook, by Product Type, 2020-2033
6.4.9. Indonesia Agricultural Lubricant Market Outlook, by Equipment, 2020-2033
6.4.10. Thailand Agricultural Lubricant Market Outlook, by Base Oil, 2020-2033
6.4.11. Thailand Agricultural Lubricant Market Outlook, by Product Type, 2020-2033
6.4.12. Thailand Agricultural Lubricant Market Outlook, by Equipment, 2020-2033
6.4.13. Vietnam Agricultural Lubricant Market Outlook, by Base Oil, 2020-2033
6.4.14. Vietnam Agricultural Lubricant Market Outlook, by Product Type, 2020-2033
6.4.15. Vietnam Agricultural Lubricant Market Outlook, by Equipment, 2020-2033
6.4.16. Australia Agricultural Lubricant Market Outlook, by Base Oil, 2020-2033
6.4.17. Australia Agricultural Lubricant Market Outlook, by Product Type, 2020-2033
6.4.18. Australia Agricultural Lubricant Market Outlook, by Equipment, 2020-2033
7. Latin America Agricultural Lubricant Market Outlook, 2020-2033
7.1. Latin America Agricultural Lubricant Market Outlook, by Base Oil, Value (US$ Billion), 2020-2033
7.1.1. Mineral Oil
7.1.2. Synthetic
7.1.3. Bio-Based
7.2. Latin America Agricultural Lubricant Market Outlook, by Product Type, Value (US$ Billion), 2020-2033
7.2.1. Engine Oil
7.2.2. Hydraulic & Transmission Fluids
7.2.3. Gear Oil
7.2.4. Grease
7.2.5. Coolants
7.3. Latin America Agricultural Lubricant Market Outlook, by Equipment, Value (US$ Billion), 2020-2033
7.3.1. Tractors
7.3.2. Combines & Harvesters
7.3.3. Sprayers
7.3.4. Implements & Others
7.4. Latin America Agricultural Lubricant Market Outlook, by Country, Value (US$ Billion), 2020-2033
7.4.1. Brazil Agricultural Lubricant Market Outlook, by Base Oil, 2020-2033
7.4.2. Brazil Agricultural Lubricant Market Outlook, by Product Type, 2020-2033
7.4.3. Brazil Agricultural Lubricant Market Outlook, by Equipment, 2020-2033
7.4.4. Argentina Agricultural Lubricant Market Outlook, by Base Oil, 2020-2033
7.4.5. Argentina Agricultural Lubricant Market Outlook, by Product Type, 2020-2033
7.4.6. Argentina Agricultural Lubricant Market Outlook, by Equipment, 2020-2033
7.4.7. Mexico Agricultural Lubricant Market Outlook, by Base Oil, 2020-2033
7.4.8. Mexico Agricultural Lubricant Market Outlook, by Product Type, 2020-2033
7.4.9. Mexico Agricultural Lubricant Market Outlook, by Equipment, 2020-2033
7.4.10. Colombia Agricultural Lubricant Market Outlook, by Base Oil, 2020-2033
7.4.11. Colombia Agricultural Lubricant Market Outlook, by Product Type, 2020-2033
7.4.12. Colombia Agricultural Lubricant Market Outlook, by Equipment, 2020-2033
7.4.13. Paraguay Agricultural Lubricant Market Outlook, by Base Oil, 2020-2033
7.4.14. Paraguay Agricultural Lubricant Market Outlook, by Product Type, 2020-2033
7.4.15. Paraguay Agricultural Lubricant Market Outlook, by Equipment, 2020-2033
8. Middle East & Africa Agricultural Lubricant Market Outlook, 2020-2033
8.1. Middle East & Africa Agricultural Lubricant Market Outlook, by Base Oil, Value (US$ Billion), 2020-2033
8.1.1. Mineral Oil
8.1.2. Synthetic
8.1.3. Bio-Based
8.2. Middle East & Africa Agricultural Lubricant Market Outlook, by Product Type, Value (US$ Billion), 2020-2033
8.2.1. Engine Oil
8.2.2. Hydraulic & Transmission Fluids
8.2.3. Gear Oil
8.2.4. Grease
8.2.5. Coolants
8.3. Middle East & Africa Agricultural Lubricant Market Outlook, by Equipment, Value (US$ Billion), 2020-2033
8.3.1. Tractors
8.3.2. Combines & Harvesters
8.3.3. Sprayers
8.3.4. Implements & Others
8.4. Middle East & Africa Agricultural Lubricant Market Outlook, by Country, Value (US$ Billion), 2020-2033
8.4.1. South Africa Agricultural Lubricant Market Outlook, by Base Oil, 2020-2033
8.4.2. South Africa Agricultural Lubricant Market Outlook, by Product Type, 2020-2033
8.4.3. South Africa Agricultural Lubricant Market Outlook, by Equipment, 2020-2033
8.4.4. Egypt Agricultural Lubricant Market Outlook, by Base Oil, 2020-2033
8.4.5. Egypt Agricultural Lubricant Market Outlook, by Product Type, 2020-2033
8.4.6. Egypt Agricultural Lubricant Market Outlook, by Equipment, 2020-2033
8.4.7. Morocco Agricultural Lubricant Market Outlook, by Base Oil, 2020-2033
8.4.8. Morocco Agricultural Lubricant Market Outlook, by Product Type, 2020-2033
8.4.9. Morocco Agricultural Lubricant Market Outlook, by Equipment, 2020-2033
8.4.10. Kenya Agricultural Lubricant Market Outlook, by Base Oil, 2020-2033
8.4.11. Kenya Agricultural Lubricant Market Outlook, by Product Type, 2020-2033
8.4.12. Kenya Agricultural Lubricant Market Outlook, by Equipment, 2020-2033
8.4.13. Nigeria Agricultural Lubricant Market Outlook, by Base Oil, 2020-2033
8.4.14. Nigeria Agricultural Lubricant Market Outlook, by Product Type, 2020-2033
8.4.15. Nigeria Agricultural Lubricant Market Outlook, by Equipment, 2020-2033
8.4.16. Saudi Arabia Agricultural Lubricant Market Outlook, by Base Oil, 2020-2033
8.4.17. Saudi Arabia Agricultural Lubricant Market Outlook, by Product Type, 2020-2033
8.4.18. Saudi Arabia Agricultural Lubricant Market Outlook, by Equipment, 2020-2033
9. Competitive Landscape
9.1. Market Concentration and Industry Leaders
9.2. Competitive Differentiation
9.3. Strategic Initiatives
9.4. Recent Industry Developments
9.5. Company Profiles
9.5.1. Shell
9.5.2. ExxonMobil
9.5.3. TotalEnergies
9.5.4. BP (Castrol)
9.5.5. FUCHS
9.5.6. Chevron
9.5.7. Valvoline
9.5.8. Phillips 66
9.5.9. Petronas Lubricants
9.5.10. Indian Oil
9.5.11. Savita Oil Technologies
9.5.12. Morris Lubricants
10. Appendix
10.1. Research Methodology
10.2. Report Assumptions
10.3. Acronyms and Abbreviations
| Base Oil | Mineral Oil, Synthetic, Bio-Based |
| Product Type | Engine Oil, Hydraulic & Transmission Fluids, Gear Oil, Grease, Coolants |
| Equipment | Tractors, Combines & Harvesters, Sprayers, Implements & Others |
| Regions | North America, Europe, Asia Pacific, Latin America, Middle East & Africa |
Our Research Methodology
Considering the volatility of business today, traditional approaches to strategizing a game plan can be unfruitful if not detrimental. True ambiguity is no way to determine a forecast. A myriad of predetermined factors must be accounted for such as the degree of risk involved, the magnitude of circumstances, as well as conditions or consequences that are not known or unpredictable. To circumvent binary views that cast uncertainty, the application of market research intelligence to strategically posture, move, and enable actionable outcomes is necessary.
View Methodology
Quality Assured
Rigorous Validation Process

Confidentiality Assured
End-to-end Data Security

Custom Research Services
Tailored To Your Objectives
FAQs
The agricultural lubricant market is valued at US$ 6.58 billion in 2026, led by mineral oil-based engine oils and North America.
The market is projected to reach US$ 8.71 billion by 2033, growing at a 4.1% CAGR and adding US$ 2.13 billion.
Bio-based lubricants are growing fastest at a 6.9% CAGR through 2033, driven by environmental rules and sustainability goals.
Asia Pacific is growing fastest at a 5.3% CAGR through 2033, driven by tractor sales growth and mechanization subsidies in India.
North America holds the largest share at 31.0% in 2026, supported by large farms, powerful machines, and premium oil demand.
Related Reports
Non-Woven Abrasives Market Size, Share, Insights, Competitive Landscape, and Forecast 2026 to 2033
Non-Woven Abrasives Market is projected to grow from US$ 2.89 billion in 2026 to US$ 4.03 billion by 2033 at a 4.9% CAGR. See key products and trends.
Acaricides Market Size, Share, Insights, Competitive Landscape, and Forecast 2026 to 2033
Explore the acaricides market, valued at US$ 393.98 million in 2026 and projected to reach US$ 521.95 million by 2033 at a CAGR of 4.1%.
Rigid Bulk Packaging Market Size, Share, Insights, Competitive Landscape, and Forecast 2026 to 2033
The global rigid bulk packaging market is valued at US$68.5 billion in 2026, reaching US$96.4 billion by 2033, growing at a 5.0% CAGR
Probiotics Packaging Market Size, Share, Insights, Competitive Landscape, and Forecast 2026 to 2033
Explore the probiotics packaging market, valued at US$ 1.4 billion in 2026 and projected to reach US$ 2.4 billion by 2033, growing at an 8.0% CAGR.
Epoxy Composites Market Size, Share, Insights, Competitive Landscape, and Forecast 2026 to 2033
Explore the epoxy composites market, projected to reach US$ 22.3 billion by 2033 at a 6.7% CAGR, with resin, reinforcement and regional insights.
Advanced Materials Market Size, Share, Insights, Competitive Landscape, and Forecast 2026 to 2033
Explore the advanced materials market, projected to reach US$ 121.08 billion by 2033 at a 6.6% CAGR, with product, application and regional insights.