



Rigid Bulk Packaging Market
Rigid Bulk Packaging Market Size, Share, Insights, Competitive Landscape, and Forecast 2026 to 2033
Rigid Bulk Packaging Market Size and Trend Analysis
How Big Is the Rigid Bulk Packaging Market in 2026?
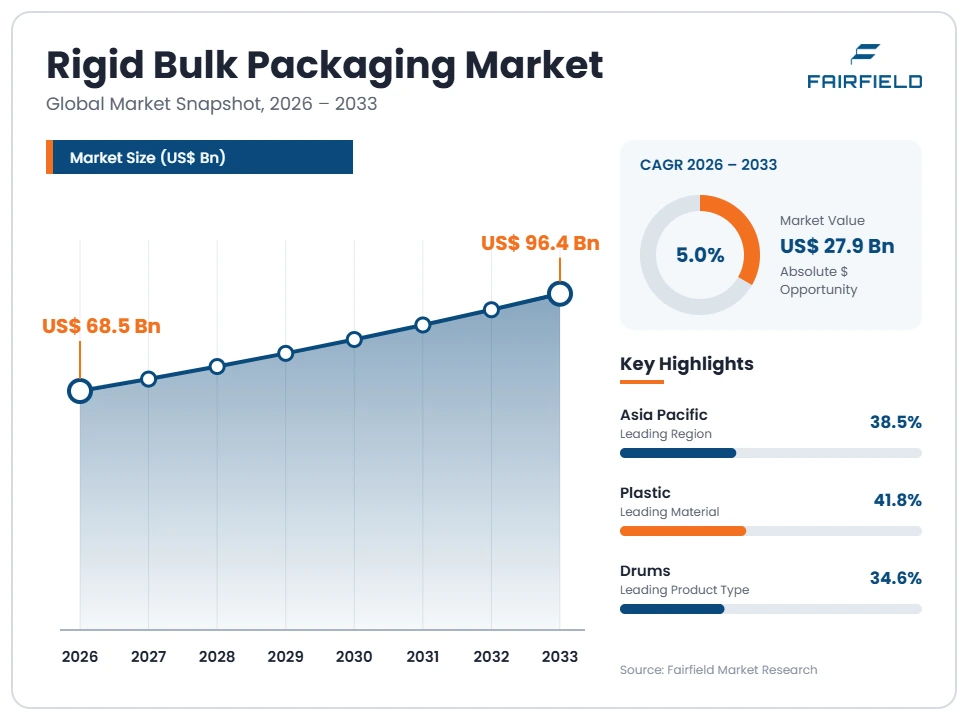
The global rigid bulk packaging market size is expected to be valued at US$ 68.5 billion in 2026 and projected to reach US$ 96.4 billion by 2033, growing at a CAGR of 5.0% between 2026 and 2033.
Bulk container demand grew at a 3.4% CAGR between 2020 and 2025, slowed by soft chemical output and a long destocking cycle. Three forces shape the outlook. Production volumes in chemicals, lubricants, agrochemicals and food ingredients set the baseline need for drums, intermediate bulk containers and pails. Buyers keep moving payloads into larger units because the delivered cost per litre falls as container size rises. Packaging rules in India, the United Kingdom and the European Union now price recyclability and recycled content directly into the format decision. The direction is steady mid-single-digit growth, with volume concentrated in Asia Pacific and the sharpest percentage gains in Middle East & Africa.
Key Report Takeaways
- By Product Type: Drums held 34.6% share in 2026, while intermediate bulk containers are projected to expand at a 6.2% CAGR through 2033, as shippers consolidate payloads into 1,000-litre units to cut handling and freight movements per tonne.
- By Material: Plastic held 41.8% share in 2026, while composite formats are projected to expand at a 6.5% CAGR through 2033, because a plastic inner bottle inside a reusable steel cage carries hazardous liquids at a low delivered cost.
- By Capacity: The 51–200 litre band held 38.2% share in 2026, while the 201–1,000 litre band is projected to grow at a 6.0% CAGR through 2033, helped by the spread of closed-loop refill programmes at large chemical users.
- By End Use: Chemicals and petrochemicals held 29.4% share in 2026, while food and beverage ingredients are projected to grow at a 6.3% CAGR through 2033, supported by bulk shipment of sweeteners, oils, concentrates and starches.
- By Region: Asia Pacific held 38.5% share in 2026, while Middle East & Africa is projected to grow at a 6.4% CAGR through 2033, as Gulf petrochemical capacity adds packaged specialty output alongside bulk commodity trade.
Global Rigid Bulk Packaging Market Trends and Insights
Drivers Impact Analysis
Two demand forces carry most of the forecast growth in industrial bulk containment.
| Driver | Impact on CAGR Forecast | Geographic Relevance | Impact Timeline |
| Chemical, lubricant and agrochemical output growth | High | Asia Pacific, Middle East & Africa | Long term ≥4 years |
| Substitution toward larger formats on delivered cost per litre | Medium | Global | Medium term 2–4 years |
Chemical, Lubricant and Agrochemical Output Growth Sets the Floor Under Rigid Bulk Container Demand
Industrial production volume is the primary demand signal for rigid bulk packaging. Any product leaving a plant below tank-truck scale moves in a drum, an intermediate bulk container, a pail or a jerrican, so container volumes track the output of chemicals, lubricants, paints, adhesives, agrochemicals and food ingredients almost one for one. Specialty and performance chemicals matter most, because they ship in smaller lots than commodities and need packaged units rather than bulk transfer.
New polymer, lubricant and specialty capacity in China, India and the Gulf Cooperation Council states is adding packaged output on a large scale. Agrochemical formulation in Brazil and India runs on jerricans and drums sized to field application rates. Food ingredient trade in oils, starches and concentrates adds a second volume stream that uses food-grade plastic drums and composite containers.
Delivered Cost Per Litre Pushes Buyers From Drums Into Intermediate Bulk Containers
Format choice in bulk containment is an arithmetic problem, and the arithmetic favours bigger units. Buyers compare container price, payload per unit, cube efficiency in a trailer or sea container, return logistics, cleaning and disposal, then divide by the litres delivered. One 1,000-litre intermediate bulk container replaces five 200-litre steel drums, cuts handling moves by four, uses floor space better and empties through a valve instead of a pump.
That calculation decides real purchases. High-value, low-viscosity liquids shipped over long distances move first, because freight and handling dominate their packaging cost. Viscous products, small lot sizes and strict hazard classes stay in drums and pails. Each step up in payload also raises the value at risk in one unit, which is why larger formats spread fastest among buyers with stable, repeating volumes.
Restraints Impact Analysis
Two structural limits hold back conversion rates and margins across the category.
| Restraint | Impact on CAGR Forecast | Geographic Relevance | Impact Timeline |
| Steel and resin input cost volatility in a low-margin product | High | Global | Short term ≤2 years |
| Chemical compatibility and hazard classification limits on format choice | Medium | North America, Europe | Long term ≥4 years |
Steel and Resin Price Swings Squeeze Margins Across Rigid Bulk Packaging
Raw material cost is the dominant line in a bulk container’s cost sheet, and it moves faster than contract prices. Cold-rolled steel, high-density polyethylene and kraft board together account for most of the factory cost of a drum, an intermediate bulk container or a fibre drum. Converters sell into annual supply agreements with large chemical buyers, so a sharp input move is absorbed before it can be recovered.
Two mechanisms make this worse than in other packaging categories. Value added per unit is thin, so a modest percentage move in resin or steel is a large percentage move in margin. Freight on empty containers is costly because the product is mostly air, which keeps plants close to filling sites and removes the option of sourcing from a cheaper region when local input prices spike.
Chemical Compatibility and Hazard Classification Rule Formats In or Out Regardless of Cost
Compatibility and hazard rules override the cost calculation for a large part of the market. Solvents, oxidisers, strong acids and products with low flash points are restricted to formats and materials that have passed the relevant performance tests, and a cheaper container that fails those tests cannot be used at any price. That removes substitution choices from the buyer entirely.
The technical cause is material behaviour over time. Polyolefin walls permit slow permeation and can swell or stress-crack with aggressive solvents, so steel or composite construction stays mandatory for many payloads. Static build-up during filling constrains plastic use in flammable service. Shelf-life and extractables requirements in food and pharmaceutical shipment add a further layer, since resin grades must meet food contact material requirements before any cost comparison begins.
Market Opportunities
Recycled-Content and Reusable Bulk Formats Open a Premium Pool Under Packaging Rules
Packaging regulation is creating a paid-for product tier rather than only a compliance cost. Recycled-content mandates and fee modulation by recyclability change the delivered cost ranking between formats, and converters that can certify recyclate percentages, mono-material construction and documented reuse cycles can hold price where commodity containers cannot. The revenue pool sits in certified recycled-content drums, pails and bulk bins sold to buyers with public packaging targets.
Chemical, coatings and food ingredient majors are the customer group, because their own reporting obligations pass straight through to packaging specifications. India now requires minimum recycled content in rigid plastic packaging categories, and the United Kingdom charges packaging fees weighted by recyclability. Converters with in-house wash and regrind capacity, or secured post-consumer recyclate supply, are best placed to serve this demand at scale.
Rigid Bulk Liners and Lightweighting Create a Higher-Margin Component Business
Liner systems and lightweighted designs open a component revenue stream that sits above the commodity container margin. A disposable liner inside a reusable steel or plastic outer removes the cleaning step, protects product purity and lets one expensive outer serve many fills. The liner is a consumable with repeat revenue, while the outer becomes a long-life asset, which changes the supplier’s business from one-off sales to a recurring programme.
Food ingredient, specialty chemical and pharmaceutical shippers create the demand, since they need documented cleanliness between batches and cannot risk cross-contamination. Lightweighting works alongside it: thinner steel gauges and optimised plastic wall profiles cut both material cost and freight on the empty return leg. Performance testing under ASTM D4169 and ISTA distribution protocols is how these redesigned formats are proven before adoption.
Segment Analysis
- By Product Type: Drums Hold the Largest Share While Intermediate Bulk Containers Grow Fastest
Drums held 34.6% of rigid bulk packaging revenue in 2026, the largest single product position. The 200-litre drum remains the default unit for chemicals, lubricants and coatings because it is certified for a wide hazard range, stackable, handled by standard equipment everywhere and sized to lot quantities that most buyers actually order. Its supply base is global and its handling practice is universal, which keeps switching costs low.
Intermediate bulk containers are the fastest-growing product type at a 6.2% CAGR through 2033. Growth comes from payload consolidation, valve discharge that avoids pumping and tipping, and better cube use in sea containers. Pails, jerricans, bulk boxes, bins, kegs, liners and closures fill the remaining demand at smaller lot sizes. The business implication is that revenue is shifting toward fewer, larger and more engineered units per tonne shipped.
- By Material: Plastic Leads Industrial Bulk Containment as Composite Formats Accelerate
Plastic accounted for 41.8% of the market in 2026, holding first place on cost, corrosion resistance and weight. High-density polyethylene drums, pails and jerricans resist acids and aqueous products that attack bare steel, need no internal lining and cut tare weight, which lowers freight cost on both the loaded and the empty leg. Blow-moulding capacity is widely distributed, so supply sits close to filling plants.
Composite construction is the fastest-growing material at a 6.5% CAGR through 2033. A blow-moulded inner bottle inside a tubular steel cage combines chemical resistance with structural strength at a low cost per litre, and the cage outlives several bottles. Steel, fibreboard, wood and aluminium hold the remaining share in applications where rigidity, dry-product handling or specific compatibility rules decide. Material mix, rather than unit count, is where most of the value shift is happening.
- By Capacity: The 51–200 Litre Band Dominates While 201–1,000 Litre Units Gain Ground
The 51–200 litre capacity band held 38.2% share in 2026. It matches the order size of mid-tier chemical, coatings and lubricant buyers, fits standard pallet patterns four to a pallet, and can be moved by a single forklift or drum handler without specialist equipment. Hazard certification practice is most developed in this band, which keeps it the safe default for regulated payloads.
The 201–1,000 litre band is the fastest-growing capacity class at a 6.0% CAGR through 2033, following the same delivered-cost logic that favours larger units. Containers up to 50 litres serve retail-adjacent and small-lot industrial demand, while units above 1,000 litres stay niche because handling equipment and site constraints limit them. Suppliers are responding by broadening mid-size ranges rather than extending at the extremes.
- By End Use: Chemicals and Petrochemicals Anchor Volume as Food Ingredient Shipping Expands
Chemicals and petrochemicals held 29.4% of demand in 2026, the anchor end use for industrial bulk containers. The sector ships an unusually wide product range below tank scale, operates under hazard classification rules that mandate certified packaging, and buys on long-term contracts that give converters volume visibility. Lubricants and oils, paints, coatings and inks, and agrochemicals follow, each with its own format preference set by viscosity and lot size.
Food and beverage ingredients form the fastest-growing end use at a 6.3% CAGR through 2033. Bulk movement of edible oils, sweeteners, concentrates, starches and dairy powders needs food-grade plastic drums, composite containers and lined bulk bins with documented material compliance. Pharmaceuticals and building products complete the mix. For suppliers, the practical effect is a steady move from commodity containers toward certified, traceable and sometimes dedicated units.
Geography Analysis
- North America Runs on Lubricant, Agrochemical and Specialty Chemical Drum Volume
North America held 24.5% of the rigid bulk packaging market in 2026, supported by the United States and Canada. Gulf Coast petrochemical and lubricant capacity generates a large packaged output stream, and the region’s specialty chemical and coatings base buys consistently in drums, pails and intermediate bulk containers. Agricultural chemical demand in the United States Midwest and in Canada adds a strong seasonal jerrican and drum cycle each spring.
Distribution distances are long, which raises the value of payload consolidation and keeps conversion to larger formats moving. State-level producer responsibility programmes are starting to price packaging recyclability into procurement. The main change shaping the region is the spread of closed-loop refill arrangements at large industrial sites, which shifts spending from single-trip containers toward durable units and the liner systems used inside them.
- Europe Prices Recyclability Into Every Bulk Container Purchase
Europe accounted for 23.0% of global demand in 2026, with Germany, France, Italy, the Netherlands and Belgium leading. The region has the densest specialty chemical and pharmaceutical manufacturing base per square kilometre, which supports high-value packaged shipment rather than bulk transfer. Container traffic through Rotterdam and Antwerp also makes the region a hub for export packing in certified formats.
Regulation is the distinguishing feature. Producer responsibility fees modulated by recyclability, national rules on reusable and returnable industrial packaging, and recycled-content expectations all enter the purchase decision alongside unit price. France has brought industrial and commercial packaging into a dedicated producer responsibility stream. Slow regional chemical output is the main brake on volume, so growth here comes from format upgrading and compliance-driven specification rather than from rising tonnage.
- Which Region Is Leading the Rigid Bulk Packaging Market?
Asia Pacific leads the rigid bulk packaging market with 38.5% share in 2026, the result of sheer manufacturing scale. China and India host the largest concentrations of chemical, agrochemical, lubricant and food ingredient production, and almost all of that output below tank scale moves in packaged units. Local converter capacity is extensive, so containers are made close to filling plants and freight on empties stays low.
India adds a second dimension through packaging rules that now require minimum recycled content in rigid plastic packaging categories, pulling converters toward recyclate-compatible designs. Japan and South Korea contribute high-specification demand in electronic chemicals and pharmaceutical intermediates. The regional opportunity sits in format upgrading: a large installed base still ships in small drums and pails that could be consolidated into composite intermediate bulk containers.
- Latin America Depends on Agrochemical Seasons for Bulk Container Demand
Latin America held 7.5% of the market in 2026, with Brazil, Mexico and Argentina generating most demand. Crop protection formulation in Brazil is the single largest pull, filling jerricans, drums and intermediate bulk containers on a sharp seasonal cycle tied to planting. Mining chemicals in Chile and Peru, and food ingredient processing across the region, provide a steadier secondary base.
Barriers are real. Resin and steel are often imported and priced in dollars, so currency moves pass straight into container cost. Converter capacity is concentrated in a few industrial clusters, leaving long inland hauls for empties. Container return and collection systems for agrochemical packaging are the clearest change underway, since they create a verified reuse and recycling route that supports heavier, longer-life formats.
- Which Region Is Growing Fastest in the Rigid Bulk Packaging Market?
Middle East & Africa is the fastest-growing geography in rigid bulk packaging at a 6.4% CAGR through 2033, driven by petrochemical and specialty capacity additions. Saudi Arabia, the United Arab Emirates and Qatar are moving from commodity polymer exports toward packaged derivatives, lubricants and performance chemicals, and that product mix ships in drums and intermediate bulk containers rather than in bulk vessels.
Egypt, Morocco, Nigeria and South Africa add demand from paints, lubricants, agrochemicals and food processing. Barriers include limited local converter capacity outside the Gulf, dependence on imported steel in several countries, and uneven collection infrastructure for used containers. The change worth watching is the build-out of downstream industrial parks, which places container manufacture next to filling operations and removes the freight penalty on empty units.
Competitive Landscape
The rigid bulk packaging market is moderately concentrated. A small group of global converters holds a meaningful share of drum and intermediate bulk container supply, supported by plant networks placed near large chemical clusters, while a long tail of regional and national producers serves pails, jerricans, fibre drums and bulk bins. Concentration is higher in certified hazardous-goods formats, where test approvals, quality systems and liability exposure raise the entry barrier, and lower in general industrial containers. Consolidation has been steady rather than dramatic, because freight economics on empty containers limit how far any single plant can serve.
Competition runs on delivered cost per litre, certification coverage, plant proximity and supply reliability. Buyers compare a quoted container price against payload, pallet and container cube efficiency, filling line speed, closure security and disposal or return cost. Certification breadth matters because a converter approved across more hazard classes can serve a chemical customer’s whole portfolio from one contract. Technical service is a genuine differentiator: compatibility testing, closure selection and drop-test support reduce a buyer’s own qualification work. New entrants appear mainly in regional plastic container manufacture and in liner systems, where capital requirements are lower than in steel.
Strategic activity concentrates on three things. The first is footprint, since plants must sit close to filling sites for the freight arithmetic to work. The second is material capability, including recyclate handling, mono-material design and lightweighted construction that keeps performance test results intact. The third is moving up the value chain into closures, liners, fittings and tracked returnable assets that carry better margins than the container body.
Vendor strategy is converging on compliance-ready portfolios and service content. Converters are building documented recycled-content supply, extending certification coverage, and offering refill and liner programmes that change a one-time sale into a repeating one.
Recent Industry Developments
- April 2025: India began requiring minimum recycled content in rigid plastic packaging categories under its extended producer responsibility framework for plastic packaging – this makes recyclate sourcing a direct qualification requirement for plastic drum, pail and container suppliers serving that market.
- January 2025: France brought industrial and commercial packaging into a dedicated extended producer responsibility stream, placing end-of-life obligations on producers of industrial containers – it adds a compliance cost that favours reusable and easily recycled formats.
- 2025: The United Kingdom began charging packaging waste disposal fees to producers under its extended producer responsibility regime, with charges weighted by recyclability – fee modulation now feeds directly into the delivered cost comparison between steel, plastic, fibre and composite formats.
Companies Covered in the Report
- Greif, Inc.
- Mauser Packaging Solutions
- Schütz GmbH & Co. KGaA
- Time Technoplast Limited
- Sonoco Products Company
- Berry Global Group, Inc.
- Balmer Lawrie & Co. Ltd.
- Myers Industries, Inc.
- ORBIS Corporation
- Hoover Ferguson Group, Inc.
- Pyramid Technoplast Limited
- Mold-Tek Packaging Limited
Rigid Bulk Packaging Market Report Scope
| Metric | Value |
| Study Period | 2020–2033 |
| Market Size 2026 | US$ 68.5 Billion |
| Market Size 2033 | US$ 96.4 Billion |
| CAGR 2026–2033 | 5.0% |
| Absolute Dollar Opportunity | US$ 27.9 Billion |
| Largest Market | Asia Pacific (38.5% share in 2026) |
| Fastest-Growing Market | Middle East & Africa (6.4% CAGR) |
| Market Concentration | Medium |
| Major Players | Greif, Inc., Mauser Packaging Solutions, Schütz GmbH & Co. KGaA, Time Technoplast Limited, Sonoco Products Company |
Rigid Bulk Packaging Market Segmentation
Product Type
- Drums
- Intermediate Bulk Containers
- Pails and Jerricans
- Bulk Boxes, Bins and Crates
- Kegs
- Rigid Bulk Liners and Closures
Material
- Plastic
- Steel
- Fibreboard and Paperboard
- Composite
- Wood
- Aluminium
Capacity
- Up to 50 Litres
- 51–200 Litres
- 201–1,000 Litres
- Above 1,000 Litres
End Use
- Chemicals and Petrochemicals
- Lubricants and Oils
- Paints, Coatings and Inks
- Agrochemicals
- Food and Beverage Ingredients
- Pharmaceuticals
- Building and Construction Products
Regions
- North America
- Europe
- Asia Pacific
- Latin America
- Middle East & Africa
- Executive Summary
- Global Rigid Bulk Packaging Market Snapshot
- Future Projections, 2026-2033
- Key Market Trends
- Regional Snapshot
- Market Overview
- Market Definition and Report Scope
- Historical Market Trends, 2020-2025
- Market Dynamics
- Drivers Impact Analysis
- Chemical, Lubricant and Agrochemical Output Growth Sets the Floor Under Rigid Bulk Container Demand
- Delivered Cost Per Litre Pushes Buyers From Drums Into Intermediate Bulk Containers
- Restraints Impact Analysis
- Steel and Resin Price Swings Squeeze Margins Across Rigid Bulk Packaging
- Chemical Compatibility and Hazard Classification Rule Formats In or Out Regardless of Cost
- Market Opportunities
- Recycled-Content and Reusable Bulk Formats Open a Premium Pool Under Packaging Rules
- Rigid Bulk Liners and Lightweighting Create a Higher-Margin Component Business
- Drivers Impact Analysis
- Global Rigid Bulk Packaging Market Outlook, 2020-2033
- Global Rigid Bulk Packaging Market Outlook, by Product Type, Value (US$ Billion), 2020-2033
- Drums
- Intermediate Bulk Containers
- Pails and Jerricans
- Bulk Boxes, Bins and Crates
- Kegs
- Rigid Bulk Liners and Closures
- Global Rigid Bulk Packaging Market Outlook, by Material, Value (US$ Billion), 2020-2033
- Plastic
- Steel
- Fibreboard and Paperboard
- Composite
- Wood
- Aluminium
- Global Rigid Bulk Packaging Market Outlook, by Capacity, Value (US$ Billion), 2020-2033
- Up to 50 Litres
- 51–200 Litres
- 201–1,000 Litres
- Above 1,000 Litres
- Global Rigid Bulk Packaging Market Outlook, by End Use, Value (US$ Billion), 2020-2033
- Chemicals and Petrochemicals
- Lubricants and Oils
- Paints, Coatings and Inks
- Agrochemicals
- Food and Beverage Ingredients
- Pharmaceuticals
- Building and Construction Products
- Global Rigid Bulk Packaging Market Outlook, by Region, Value (US$ Billion), 2020-2033
- North America
- Europe
- Asia Pacific
- Latin America
- Middle East & Africa
- Global Rigid Bulk Packaging Market Outlook, by Product Type, Value (US$ Billion), 2020-2033
- North America Rigid Bulk Packaging Market Outlook, 2020-2033
- North America Rigid Bulk Packaging Market Outlook, by Product Type, Value (US$ Billion), 2020-2033
- Drums
- Intermediate Bulk Containers
- Pails and Jerricans
- Bulk Boxes, Bins and Crates
- Kegs
- Rigid Bulk Liners and Closures
- North America Rigid Bulk Packaging Market Outlook, by Material, Value (US$ Billion), 2020-2033
- Plastic
- Steel
- Fibreboard and Paperboard
- Composite
- Wood
- Aluminium
- North America Rigid Bulk Packaging Market Outlook, by Capacity, Value (US$ Billion), 2020-2033
- Up to 50 Litres
- 51–200 Litres
- 201–1,000 Litres
- Above 1,000 Litres
- North America Rigid Bulk Packaging Market Outlook, by End Use, Value (US$ Billion), 2020-2033
- Chemicals and Petrochemicals
- Lubricants and Oils
- Paints, Coatings and Inks
- Agrochemicals
- Food and Beverage Ingredients
- Pharmaceuticals
- Building and Construction Products
- North America Rigid Bulk Packaging Market Outlook, by Country, Value (US$ Billion), 2020-2033
- United States Rigid Bulk Packaging Market Outlook, by Product Type, 2020-2033
- United States Rigid Bulk Packaging Market Outlook, by Material, 2020-2033
- United States Rigid Bulk Packaging Market Outlook, by Capacity, 2020-2033
- United States Rigid Bulk Packaging Market Outlook, by End Use, 2020-2033
- Canada Rigid Bulk Packaging Market Outlook, by Product Type, 2020-2033
- Canada Rigid Bulk Packaging Market Outlook, by Material, 2020-2033
- Canada Rigid Bulk Packaging Market Outlook, by Capacity, 2020-2033
- Canada Rigid Bulk Packaging Market Outlook, by End Use, 2020-2033
- North America Rigid Bulk Packaging Market Outlook, by Product Type, Value (US$ Billion), 2020-2033
- Europe Rigid Bulk Packaging Market Outlook, 2020-2033
- Europe Rigid Bulk Packaging Market Outlook, by Product Type, Value (US$ Billion), 2020-2033
- Drums
- Intermediate Bulk Containers
- Pails and Jerricans
- Bulk Boxes, Bins and Crates
- Kegs
- Rigid Bulk Liners and Closures
- Europe Rigid Bulk Packaging Market Outlook, by Material, Value (US$ Billion), 2020-2033
- Plastic
- Steel
- Fibreboard and Paperboard
- Composite
- Wood
- Aluminium
- Europe Rigid Bulk Packaging Market Outlook, by Capacity, Value (US$ Billion), 2020-2033
- Up to 50 Litres
- 51–200 Litres
- 201–1,000 Litres
- Above 1,000 Litres
- Europe Rigid Bulk Packaging Market Outlook, by End Use, Value (US$ Billion), 2020-2033
- Chemicals and Petrochemicals
- Lubricants and Oils
- Paints, Coatings and Inks
- Agrochemicals
- Food and Beverage Ingredients
- Pharmaceuticals
- Building and Construction Products
- Europe Rigid Bulk Packaging Market Outlook, by Country, Value (US$ Billion), 2020-2033
- Germany Rigid Bulk Packaging Market Outlook, by Product Type, 2020-2033
- Germany Rigid Bulk Packaging Market Outlook, by Material, 2020-2033
- Germany Rigid Bulk Packaging Market Outlook, by Capacity, 2020-2033
- Germany Rigid Bulk Packaging Market Outlook, by End Use, 2020-2033
- France Rigid Bulk Packaging Market Outlook, by Product Type, 2020-2033
- France Rigid Bulk Packaging Market Outlook, by Material, 2020-2033
- France Rigid Bulk Packaging Market Outlook, by Capacity, 2020-2033
- France Rigid Bulk Packaging Market Outlook, by End Use, 2020-2033
- Italy Rigid Bulk Packaging Market Outlook, by Product Type, 2020-2033
- Italy Rigid Bulk Packaging Market Outlook, by Material, 2020-2033
- Italy Rigid Bulk Packaging Market Outlook, by Capacity, 2020-2033
- Italy Rigid Bulk Packaging Market Outlook, by End Use, 2020-2033
- Netherlands Rigid Bulk Packaging Market Outlook, by Product Type, 2020-2033
- Netherlands Rigid Bulk Packaging Market Outlook, by Material, 2020-2033
- Netherlands Rigid Bulk Packaging Market Outlook, by Capacity, 2020-2033
- Netherlands Rigid Bulk Packaging Market Outlook, by End Use, 2020-2033
- Belgium Rigid Bulk Packaging Market Outlook, by Product Type, 2020-2033
- Belgium Rigid Bulk Packaging Market Outlook, by Material, 2020-2033
- Belgium Rigid Bulk Packaging Market Outlook, by Capacity, 2020-2033
- Belgium Rigid Bulk Packaging Market Outlook, by End Use, 2020-2033
- Europe Rigid Bulk Packaging Market Outlook, by Product Type, Value (US$ Billion), 2020-2033
- Asia Pacific Rigid Bulk Packaging Market Outlook, 2020-2033
- Asia Pacific Rigid Bulk Packaging Market Outlook, by Product Type, Value (US$ Billion), 2020-2033
- Drums
- Intermediate Bulk Containers
- Pails and Jerricans
- Bulk Boxes, Bins and Crates
- Kegs
- Rigid Bulk Liners and Closures
- Asia Pacific Rigid Bulk Packaging Market Outlook, by Material, Value (US$ Billion), 2020-2033
- Plastic
- Steel
- Fibreboard and Paperboard
- Composite
- Wood
- Aluminium
- Asia Pacific Rigid Bulk Packaging Market Outlook, by Capacity, Value (US$ Billion), 2020-2033
- Up to 50 Litres
- 51–200 Litres
- 201–1,000 Litres
- Above 1,000 Litres
- Asia Pacific Rigid Bulk Packaging Market Outlook, by End Use, Value (US$ Billion), 2020-2033
- Chemicals and Petrochemicals
- Lubricants and Oils
- Paints, Coatings and Inks
- Agrochemicals
- Food and Beverage Ingredients
- Pharmaceuticals
- Building and Construction Products
- Asia Pacific Rigid Bulk Packaging Market Outlook, by Country, Value (US$ Billion), 2020-2033
- China Rigid Bulk Packaging Market Outlook, by Product Type, 2020-2033
- China Rigid Bulk Packaging Market Outlook, by Material, 2020-2033
- China Rigid Bulk Packaging Market Outlook, by Capacity, 2020-2033
- China Rigid Bulk Packaging Market Outlook, by End Use, 2020-2033
- India Rigid Bulk Packaging Market Outlook, by Product Type, 2020-2033
- India Rigid Bulk Packaging Market Outlook, by Material, 2020-2033
- India Rigid Bulk Packaging Market Outlook, by Capacity, 2020-2033
- India Rigid Bulk Packaging Market Outlook, by End Use, 2020-2033
- Japan Rigid Bulk Packaging Market Outlook, by Product Type, 2020-2033
- Japan Rigid Bulk Packaging Market Outlook, by Material, 2020-2033
- Japan Rigid Bulk Packaging Market Outlook, by Capacity, 2020-2033
- Japan Rigid Bulk Packaging Market Outlook, by End Use, 2020-2033
- South Korea Rigid Bulk Packaging Market Outlook, by Product Type, 2020-2033
- South Korea Rigid Bulk Packaging Market Outlook, by Material, 2020-2033
- South Korea Rigid Bulk Packaging Market Outlook, by Capacity, 2020-2033
- South Korea Rigid Bulk Packaging Market Outlook, by End Use, 2020-2033
- Asia Pacific Rigid Bulk Packaging Market Outlook, by Product Type, Value (US$ Billion), 2020-2033
- Latin America Rigid Bulk Packaging Market Outlook, 2020-2033
- Latin America Rigid Bulk Packaging Market Outlook, by Product Type, Value (US$ Billion), 2020-2033
- Drums
- Intermediate Bulk Containers
- Pails and Jerricans
- Bulk Boxes, Bins and Crates
- Kegs
- Rigid Bulk Liners and Closures
- Latin America Rigid Bulk Packaging Market Outlook, by Material, Value (US$ Billion), 2020-2033
- Plastic
- Steel
- Fibreboard and Paperboard
- Composite
- Wood
- Aluminium
- Latin America Rigid Bulk Packaging Market Outlook, by Capacity, Value (US$ Billion), 2020-2033
- Up to 50 Litres
- 51–200 Litres
- 201–1,000 Litres
- Above 1,000 Litres
- Latin America Rigid Bulk Packaging Market Outlook, by End Use, Value (US$ Billion), 2020-2033
- Chemicals and Petrochemicals
- Lubricants and Oils
- Paints, Coatings and Inks
- Agrochemicals
- Food and Beverage Ingredients
- Pharmaceuticals
- Building and Construction Products
- Latin America Rigid Bulk Packaging Market Outlook, by Country, Value (US$ Billion), 2020-2033
- Brazil Rigid Bulk Packaging Market Outlook, by Product Type, 2020-2033
- Brazil Rigid Bulk Packaging Market Outlook, by Material, 2020-2033
- Brazil Rigid Bulk Packaging Market Outlook, by Capacity, 2020-2033
- Brazil Rigid Bulk Packaging Market Outlook, by End Use, 2020-2033
- Mexico Rigid Bulk Packaging Market Outlook, by Product Type, 2020-2033
- Mexico Rigid Bulk Packaging Market Outlook, by Material, 2020-2033
- Mexico Rigid Bulk Packaging Market Outlook, by Capacity, 2020-2033
- Mexico Rigid Bulk Packaging Market Outlook, by End Use, 2020-2033
- Argentina Rigid Bulk Packaging Market Outlook, by Product Type, 2020-2033
- Argentina Rigid Bulk Packaging Market Outlook, by Material, 2020-2033
- Argentina Rigid Bulk Packaging Market Outlook, by Capacity, 2020-2033
- Argentina Rigid Bulk Packaging Market Outlook, by End Use, 2020-2033
- Chile Rigid Bulk Packaging Market Outlook, by Product Type, 2020-2033
- Chile Rigid Bulk Packaging Market Outlook, by Material, 2020-2033
- Chile Rigid Bulk Packaging Market Outlook, by Capacity, 2020-2033
- Chile Rigid Bulk Packaging Market Outlook, by End Use, 2020-2033
- Peru Rigid Bulk Packaging Market Outlook, by Product Type, 2020-2033
- Peru Rigid Bulk Packaging Market Outlook, by Material, 2020-2033
- Peru Rigid Bulk Packaging Market Outlook, by Capacity, 2020-2033
- Peru Rigid Bulk Packaging Market Outlook, by End Use, 2020-2033
- Latin America Rigid Bulk Packaging Market Outlook, by Product Type, Value (US$ Billion), 2020-2033
- Middle East & Africa Rigid Bulk Packaging Market Outlook, 2020-2033
- Middle East & Africa Rigid Bulk Packaging Market Outlook, by Product Type, Value (US$ Billion), 2020-2033
- Drums
- Intermediate Bulk Containers
- Pails and Jerricans
- Bulk Boxes, Bins and Crates
- Kegs
- Rigid Bulk Liners and Closures
- Middle East & Africa Rigid Bulk Packaging Market Outlook, by Material, Value (US$ Billion), 2020-2033
- Plastic
- Steel
- Fibreboard and Paperboard
- Composite
- Wood
- Aluminium
- Middle East & Africa Rigid Bulk Packaging Market Outlook, by Capacity, Value (US$ Billion), 2020-2033
- Up to 50 Litres
- 51–200 Litres
- 201–1,000 Litres
- Above 1,000 Litres
- Middle East & Africa Rigid Bulk Packaging Market Outlook, by End Use, Value (US$ Billion), 2020-2033
- Chemicals and Petrochemicals
- Lubricants and Oils
- Paints, Coatings and Inks
- Agrochemicals
- Food and Beverage Ingredients
- Pharmaceuticals
- Building and Construction Products
- Middle East & Africa Rigid Bulk Packaging Market Outlook, by Country, Value (US$ Billion), 2020-2033
- Saudi Arabia Rigid Bulk Packaging Market Outlook, by Product Type, 2020-2033
- Saudi Arabia Rigid Bulk Packaging Market Outlook, by Material, 2020-2033
- Saudi Arabia Rigid Bulk Packaging Market Outlook, by Capacity, 2020-2033
- Saudi Arabia Rigid Bulk Packaging Market Outlook, by End Use, 2020-2033
- United Arab Emirates Rigid Bulk Packaging Market Outlook, by Product Type, 2020-2033
- United Arab Emirates Rigid Bulk Packaging Market Outlook, by Material, 2020-2033
- United Arab Emirates Rigid Bulk Packaging Market Outlook, by Capacity, 2020-2033
- United Arab Emirates Rigid Bulk Packaging Market Outlook, by End Use, 2020-2033
- Qatar Rigid Bulk Packaging Market Outlook, by Product Type, 2020-2033
- Qatar Rigid Bulk Packaging Market Outlook, by Material, 2020-2033
- Qatar Rigid Bulk Packaging Market Outlook, by Capacity, 2020-2033
- Qatar Rigid Bulk Packaging Market Outlook, by End Use, 2020-2033
- Egypt Rigid Bulk Packaging Market Outlook, by Product Type, 2020-2033
- Egypt Rigid Bulk Packaging Market Outlook, by Material, 2020-2033
- Egypt Rigid Bulk Packaging Market Outlook, by Capacity, 2020-2033
- Egypt Rigid Bulk Packaging Market Outlook, by End Use, 2020-2033
- Morocco Rigid Bulk Packaging Market Outlook, by Product Type, 2020-2033
- Morocco Rigid Bulk Packaging Market Outlook, by Material, 2020-2033
- Morocco Rigid Bulk Packaging Market Outlook, by Capacity, 2020-2033
- Morocco Rigid Bulk Packaging Market Outlook, by End Use, 2020-2033
- Nigeria Rigid Bulk Packaging Market Outlook, by Product Type, 2020-2033
- Nigeria Rigid Bulk Packaging Market Outlook, by Material, 2020-2033
- Nigeria Rigid Bulk Packaging Market Outlook, by Capacity, 2020-2033
- Nigeria Rigid Bulk Packaging Market Outlook, by End Use, 2020-2033
- South Africa Rigid Bulk Packaging Market Outlook, by Product Type, 2020-2033
- South Africa Rigid Bulk Packaging Market Outlook, by Material, 2020-2033
- South Africa Rigid Bulk Packaging Market Outlook, by Capacity, 2020-2033
- South Africa Rigid Bulk Packaging Market Outlook, by End Use, 2020-2033
- Middle East & Africa Rigid Bulk Packaging Market Outlook, by Product Type, Value (US$ Billion), 2020-2033
- Competitive Landscape
- Market Concentration and Industry Leaders
- Competitive Differentiation
- Strategic Initiatives
- Recent Industry Developments
- Company Profiles
- Greif, Inc.
- Mauser Packaging Solutions
- Schütz GmbH & Co. KGaA
- Time Technoplast Limited
- Sonoco Products Company
- Berry Global Group, Inc.
- Balmer Lawrie & Co. Ltd.
- Myers Industries, Inc.
- ORBIS Corporation
- Hoover Ferguson Group, Inc.
- Pyramid Technoplast Limited
- Mold-Tek Packaging Limited
- Appendix
- Research Methodology
- Report Assumptions
- Acronyms and Abbreviations
Product Type
- Drums
- Intermediate Bulk Containers
- Pails and Jerricans
- Bulk Boxes, Bins and Crates
- Kegs
- Rigid Bulk Liners and Closures
Material
- Plastic
- Steel
- Fibreboard and Paperboard
- Composite
- Wood
- Aluminium
Capacity
- Up to 50 Litres
- 51–200 Litres
- 201–1,000 Litres
- Above 1,000 Litres
End Use
- Chemicals and Petrochemicals
- Lubricants and Oils
- Paints, Coatings and Inks
- Agrochemicals
- Food and Beverage Ingredients
- Pharmaceuticals
- Building and Construction Products
Regions
- North America
- Europe
- Asia Pacific
- Latin America
- Middle East & Africa
Our Research Methodology
Considering the volatility of business today, traditional approaches to strategizing a game plan can be unfruitful if not detrimental. True ambiguity is no way to determine a forecast. A myriad of predetermined factors must be accounted for such as the degree of risk involved, the magnitude of circumstances, as well as conditions or consequences that are not known or unpredictable. To circumvent binary views that cast uncertainty, the application of market research intelligence to strategically posture, move, and enable actionable outcomes is necessary.
View Methodology
Quality Assured
Rigorous Validation Process

Confidentiality Assured
End-to-end Data Security

Custom Research Services
Tailored To Your Objectives
FAQs
The market is valued at US$ 68.5 billion in 2026, covering drums, intermediate bulk containers, pails, jerricans, bulk boxes, kegs, liners and closures worldwide.
The market is projected to reach US$ 96.4 billion by 2033, expanding at a 5.0% CAGR and adding US$ 27.9 billion in absolute dollar opportunity.
Drums lead with 34.6% share in 2026, because the 200-litre unit is certified for a wide hazard range and handled with standard equipment everywhere.
Intermediate bulk containers grow fastest at a 6.2% CAGR, while Middle East & Africa is the fastest-growing geography at a 6.4% CAGR through 2033.
Asia Pacific holds 38.5% share in 2026, reflecting the concentration of chemical, agrochemical, lubricant and food ingredient production across China and India.
Related Reports
Probiotics Packaging Market Size, Share, Insights, Competitive Landscape, and Forecast 2026 to 2033
Explore the probiotics packaging market, valued at US$ 1.4 billion in 2026 and projected to reach US$ 2.4 billion by 2033, growing at an 8.0% CAGR.
Epoxy Composites Market Size, Share, Insights, Competitive Landscape, and Forecast 2026 to 2033
Explore the epoxy composites market, projected to reach US$ 22.3 billion by 2033 at a 6.7% CAGR, with resin, reinforcement and regional insights.
Advanced Materials Market Size, Share, Insights, Competitive Landscape, and Forecast 2026 to 2033
Explore the advanced materials market, projected to reach US$ 121.08 billion by 2033 at a 6.6% CAGR, with product, application and regional insights.
Biopolymer Coatings Market Size, Share, Insights, Competitive Landscape, and Forecast 2026 to 2033
Explore the biopolymer coatings market, projected to reach US$ 2.5 billion by 2033 at a 7.6% CAGR, with product, technology and regional insights.
Dry Construction Market Size, Share, Insights, Competitive Landscape, and Forecast 2026 to 2033
Explore the dry construction market, projected to reach US$ 134.87 billion by 2033 at a 4.7% CAGR, with material, system and regional insights.
Waterproofing Admixtures Market Size, Share, Insights, Competitive Landscape, and Forecast 2026 to 2033
Waterproofing admixtures market to grow from US$ 2.4 billion in 2026 to US$ 3.6 billion by 2033 at a 6.0% CAGR. Explore products, applications and regions.