



Probiotics Packaging Market
Probiotics Packaging Market Size, Share, Insights, Competitive Landscape, and Forecast 2026 to 2033
Probiotics Packaging Market Size, Share, Insights, Competitive Landscape, and Forecast 2026 to 2033
How Fast Is the Probiotics Packaging Market Growing?
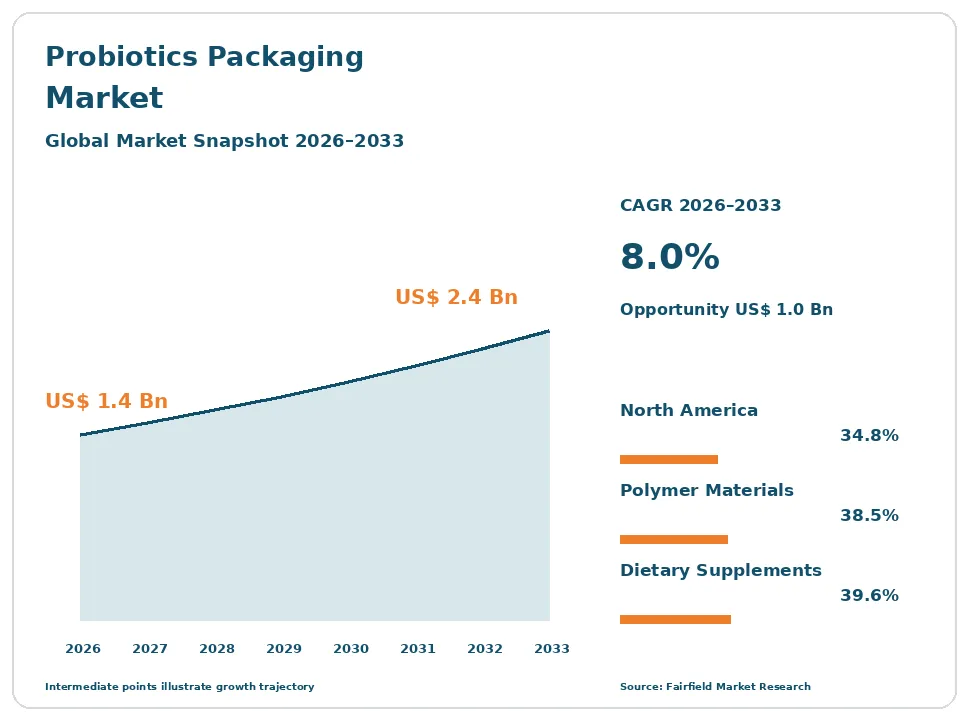
The global probiotics packaging market size is expected to be valued at US$ 1.4 billion in 2026 and projected to reach US$ 2.4 billion by 2033, growing at a CAGR of 8.0% between 2026 and 2033.
Demand grew at a 6.9% CAGR between 2020 and 2025 as brands moved from basic bottles toward specified barrier structures. Three factors drive the outlook. Declared counts at the end of stated shelf life turn moisture and oxygen control into a contractual engineering requirement rather than a preference. Rising culture input cost makes spending on barrier cheaper than adding more material at fill. Shelf-stable formats are replacing refrigerated distribution in several categories, shifting cost from the cold chain into the package. Growth outpaces general packaging because specification intensity per unit is rising faster than unit volume, and because testing and validation work is being priced into supply contracts.
Key Report Takeaways
- By Packaging Format: Bottles, closures and canisters held 31.2% share in 2026, while stick packs and sachets are projected to expand at a 10.2% CAGR through 2033, because single-dose units limit repeated headspace exposure after opening.
- By Material: Polymer films and rigid polymers held 38.5% share in 2026, while mono-material high-barrier structures are projected to grow at an 11.4% CAGR through 2033, as packaging rules press brands toward recyclable single-polymer designs.
- By Barrier Technology: High-barrier laminates and coatings held 36.0% share in 2026, while nitrogen flushing and modified atmosphere are projected to grow at a 9.8% CAGR through 2033, supported by cheaper inline gas-flush equipment.
- By Application: Dietary supplements held 39.6% share in 2026, while animal feed and pet products are projected to grow at a 10.6% CAGR through 2033, driven by premium pet formats needing documented storage stability.
- By Region: North America held 34.8% share in 2026, while Asia Pacific is projected to grow at a 9.6% CAGR through 2033, supported by supplement manufacturing capacity in India, China and South Korea.
Global Probiotics Packaging Market Trends and Insights
Drivers Impact Analysis
| Driver | Impact on CAGR Forecast | Geographic Relevance | Impact Timeline |
| End-of-shelf-life declared counts as a packaging specification | High | Global | Long term ≥4 years |
| Culture input cost shifting spend from formulation to barrier | High | North America, Europe | Medium term 2–4 years |
Two technical and commercial forces account for most of the specification spending behind the forecast.
End-of-Shelf-Life Declared Counts Turn Barrier Performance Into a Contract Specification
A declared count printed on a label commits the brand to a measurable condition at the end of stated shelf life, and the package is what delivers it. Live microbial cultures lose viability with moisture uptake, oxygen ingress, heat and elapsed time, so the structure is specified on water vapour transmission rate, oxygen transmission rate and desiccant capacity. That converts packaging from a cosmetic choice into an engineering deliverable with test evidence attached.
The specification runs on standard methods. Water vapour transmission rate is measured under ASTM F1249, oxygen transmission rate under ASTM D3985 and, at controlled humidity, under ASTM F1927. Suppliers must now present transmission data, sorption capacity and accelerated storage results during qualification. Contract manufacturers increasingly write these values into supply agreements, which raises the technical content and price of every unit sold.
Rising Culture Input Cost Moves Spending From Over-Formulation Into Better Packaging
Brands have two ways to hold a declared count to the end of shelf life, and the balance between them is shifting toward packaging. The first is over-formulation: filling more culture material than the label states so the declared figure survives predictable decline. The second is reducing that decline with a better barrier. As culture input cost per unit rises, the second route becomes the cheaper way to meet the same commitment.
The arithmetic is direct. Over-formulation adds variable cost to every unit filled for the whole life of the product, while a barrier upgrade adds a smaller fixed increment per package. Fermentation and freeze-drying capacity, quality release testing and strain licensing all sit behind ingredient cost. Packaging suppliers that can quantify viability retention against a structure’s transmission values can then argue for a share of the ingredient budget.
Restraints Impact Analysis
| Restraint | Impact on CAGR Forecast | Geographic Relevance | Impact Timeline |
| Barrier cost against price-sensitive supplement products | High | Asia Pacific, Latin America | Short term ≤2 years |
| Recyclability conflict in laminates and desiccant-loaded closures | Medium | Europe, North America | Long term ≥4 years |
Two cost and compliance pressures limit how much barrier the market will actually buy.
Barrier Cost Collides With Price-Sensitive Supplement Products
Packaging cost per unit is a real constraint in a category sold heavily on private label and promotional pricing. A high-barrier aluminium-polymer blister or a desiccant-integrated canister can cost several times a plain polyethylene bottle with a loose sachet, and in value tiers that gap exceeds what the retail price will carry. Brands facing that gap shorten declared shelf life or accept simpler structures instead of upgrading.
The cost sources are specific. Aluminium foil layers, adhesive lamination passes, moisture-scavenging polymer masterbatch and integrated desiccant inserts each add material and conversion steps. Gas flushing needs slower line speeds and inline analysers. Qualification adds accelerated and real-time storage studies that take months and must be repeated when a structure changes. Smaller brands cannot spread that fixed testing cost across enough units to justify it.
Mono-Material Packaging Rules Conflict With Laminate and Desiccant Construction
Recyclability requirements run directly against the construction that delivers the best barrier, and this tension is genuine rather than theoretical. Aluminium-polymer laminates, metallised films and desiccant-loaded closures perform well precisely because they combine materials that cannot be separated in a standard recycling stream. Packaging rules in several markets now price or restrict exactly that construction, which leaves technical buyers choosing between measured performance and compliance.
The mechanism is fee and design pressure rather than outright prohibition. Producer responsibility schemes modulate fees by recyclability, taxes apply to non-recycled plastic content, and design-for-recycling criteria are tightening in the European Union. Spain has taxed the non-recycled plastic content of single-use packaging since January 2023. Mono-material high-barrier alternatives exist but generally deliver weaker transmission values, so brands must either accept shorter stated shelf life or pay more.
Market Opportunities
Mono-Material High-Barrier Structures Open a Compliance-Driven Premium Segment
Mono-material barrier structures are the clearest new revenue pool in probiotics packaging, because they resolve a conflict that buyers currently cannot escape. Oriented polyolefin films with vacuum-deposited or coated barrier layers, all-polypropylene laminates and recyclable high-barrier bottles let a brand keep a defensible transmission specification while meeting design-for-recycling criteria. These structures carry a clear price premium over conventional films because the technical work behind them is harder.
Brands selling into the European Union and into producer responsibility markets create the demand, since their fee exposure and retailer commitments make recyclability non-negotiable. Converters with coating capability, barrier masterbatch know-how and in-house transmission testing are positioned to capture it. The commercial requirement is evidence: a mono-material claim only sells if it is supported by ASTM D3985 and ASTM F1249 data under the humidity conditions the product will actually see.
Animal Feed and Pet Product Packaging Creates a Fast-Expanding Secondary Pool
Animal and pet applications are an underserved revenue pool with packaging requirements close to the human supplement category. Microbial cultures used in feed additives and pet products face the same moisture, oxygen and temperature sensitivity, and premium pet brands increasingly print declared counts with a stated shelf life. That commitment requires the same transmission-rated structures, desiccant systems and gas flushing used on the human side, but the category has historically bought commodity packaging.
Feed premix producers, pet food brands and veterinary nutrition companies create the demand. Bulk feed additive packs need moisture-resistant lined sacks and drum liners rather than blisters, which opens formats that human-grade converters do not usually supply. Single-dose sachets and stick packs for companion animals follow the retail model directly. Suppliers that already hold validated barrier portfolios can extend into this pool with limited new investment.
Segment Analysis
By Packaging Format: Bottles, Closures and Canisters Lead While Stick Packs and Sachets Accelerate
Bottles, closures and canisters held 31.2% of probiotics packaging value in 2026. The format dominates because capsule and tablet counts are the standard retail presentation, and because desiccant can be integrated into the closure liner or the container wall rather than added as a loose sachet. Integrated systems keep working each time the pack is opened, which matters in a container used over many weeks.
Stick packs and sachets are the fastest-growing format at a 10.2% CAGR through 2033. A single-dose unit is opened once, so headspace and moisture exposure after first opening disappear entirely from the calculation. Blister and strip packs, foil laminate pouches and barrier cartons or bottles for drinkable formats hold the remaining share. The shift toward single-dose units raises film content per unit sold and benefits flexible packaging converters.
By Material: Polymer Structures Hold Volume While Mono-Material Barrier Designs Climb Fastest
Polymer films and rigid polymers accounted for 38.5% of the market in 2026. High-density polyethylene bottles, polypropylene canisters and multilayer polymer films cover the bulk of retail formats at acceptable cost, and desiccant masterbatch can be compounded directly into the wall. Polymers also run fast on filling lines and accept the moulded closure designs that carry integrated sorbents.
Mono-material high-barrier structures are the fastest-growing material class at an 11.4% CAGR through 2033, pulled by recyclability requirements rather than by performance alone. Aluminium foil laminates remain the benchmark for transmission values and hold a large share in blisters and sachets. Paperboard with coated barrier layers serves cartons and drinkable formats, while glass appears in refrigerated dairy applications. Material choice is now a joint technical and compliance decision.
By Barrier Technology: High-Barrier Laminates Lead as Gas Flushing Expands Quickly
High-barrier laminates and coatings held 36.0% share in 2026, the default technology for protecting live cultures in flexible formats. Foil and metallised layers deliver the lowest oxygen and water vapour transmission values available at commercial cost, and converting equipment for them is widely installed. For blisters, strip packs and sachets, no alternative currently matches the measured performance per unit of cost.
Nitrogen flushing and modified atmosphere is the fastest-growing barrier technology at a 9.8% CAGR through 2033, as inline gas-flush and residual oxygen analysers become cheaper to install. Desiccant-integrated systems hold a strong position in rigid containers, while refrigerated distribution packaging serves dairy and some clinical formats. Combining a flushed headspace with a moderate barrier film often beats upgrading the film alone, which changes how structures are specified.
By Application: Dietary Supplements Dominate While Animal and Pet Formats Grow Quickest
Dietary supplements held 39.6% of demand in 2026 and remain the core application. Capsule, tablet and powder supplements carry declared counts with stated shelf life, sell through retail and e-commerce channels with long dwell times, and move through warehouses without temperature control. That combination makes barrier specification unavoidable and supports the highest packaging value per unit in the category.
Animal feed and pet products form the fastest-growing application at a 10.6% CAGR through 2033, as premium pet brands adopt declared counts and the storage documentation that goes with them. Functional food and beverage, dairy, infant formula and pharmaceutical use account for the remainder, with infant formula and pharmaceutical formats carrying the strictest validation requirements. Converters increasingly build one barrier platform and qualify it across several applications.
Geography Analysis
Which Region Is Leading the Probiotics Packaging Market?
North America leads the probiotics packaging market with 34.8% share in 2026, reflecting the size and structure of its supplement industry. The United States has the largest dietary supplement manufacturing base and a dense network of contract manufacturers that specify packaging on measured transmission values. Supplement labelling practice in the region allows declared counts with a stated shelf life, which makes the barrier commitment explicit and testable.
Canada adds a regulated natural health product system with its own stability documentation expectations. Long e-commerce fulfilment chains, warehouse storage without temperature control and summer transport conditions all raise the barrier requirement for the same product. The regional change worth watching is producer responsibility: Oregon began charging producer fees modulated by recyclability in July 2025, which is pushing brands to re-examine laminate and desiccant-loaded closure designs.
Europe Specifies Packaging Under Strict Labelling and Recyclability Rules
Europe accounted for 27.5% of the market in 2026, with Germany, Italy, France, Spain and Poland as the main production centres. Italy has the deepest manufacturing base for microbial culture products in the region, and its contract manufacturers export finished packs widely. Food contact materials rules and the regulation on plastic food contact materials set the compositional limits that every structure must satisfy before performance is considered.
Labelling is the distinguishing regional constraint. The term probiotic is not authorised for use in food labelling at bloc level, while several member states permit it nationally, so brands run different artwork and claim sets across borders. Recyclability requirements add a second constraint that works directly against laminate construction. The regional opportunity sits in mono-material barrier structures that satisfy both the compositional rules and design-for-recycling criteria.
Which Region Is Growing Fastest in the Probiotics Packaging Market?
Asia Pacific is the fastest-growing geography in probiotics packaging at a 9.6% CAGR through 2033, driven by manufacturing capacity rather than by regulation. India, China, South Korea and Japan host large and expanding supplement and fermented dairy production, and contract manufacturers in India increasingly export finished packs to regulated markets, which forces them to adopt the same transmission specifications their customers demand.
High ambient temperature and humidity across much of the region raise the technical requirement for the same product, so structures specified locally often need better values than those used in temperate markets. Converting capacity for laminates, blisters and stick packs is extensive and competitively priced. The main regional change is the move from shelf-stable commodity packs toward tested, documented structures as export and e-commerce channels grow.
Latin America Grows From a Small Base With Cost-Led Packaging Choices
Latin America held 6.8% of the market in 2026, with Brazil, Mexico, Argentina and Colombia generating most demand. Fermented dairy drinks are the largest single application, which puts spending into coated cartons, barrier bottles and refrigerated distribution packaging rather than into high-specification dry formats. Supplement manufacturing is growing but still buys mainly in the value tier.
Barriers are mostly economic. Aluminium foil and specialty films are imported and dollar-priced, which makes high-barrier structures expensive relative to local retail prices. Testing laboratories able to run transmission and accelerated storage studies are concentrated in a few cities, so qualification is slow. The change underway is the growth of shelf-stable formats that avoid refrigerated distribution, since cold chain reliability outside major urban centres remains uneven and costly.
Middle East & Africa Depends on Imported Barrier Materials in Hot Storage Conditions
Middle East & Africa accounted for 4.5% of the market in 2026, the smallest regional share. Demand concentrates in the United Arab Emirates, Saudi Arabia, Turkey, Egypt and South Africa, where supplement imports and local dairy production both use barrier packaging. Storage and transport temperatures are the defining technical problem, since sustained heat shortens achievable shelf life for any given structure.
Barriers include near-total dependence on imported foil and barrier film, limited local converting capability for complex laminates, and few accredited laboratories for transmission testing. Import registration requirements add time before a pack design can be used. The opportunity lies in structures engineered for hot-climate distribution, including higher desiccant loadings and gas-flushed formats, which let brands keep a credible stated shelf life without building refrigerated distribution.
Competitive Landscape
The probiotics packaging market is fragmented. No supplier holds a dominant position, because the market is really the intersection of several established packaging businesses: pharmaceutical blister and barrier films, rigid supplement containers with integrated sorbents, flexible stick pack and sachet converting, capsule supply, and carton and bottle systems for drinkable formats. Large diversified converters compete alongside specialists in desiccant technology and in high-barrier film, and brand owners often buy each element from a different supplier. Consolidation has been modest, with capability acquired more often than market share.
Competition is technical and evidence-based. Suppliers win on measured water vapour and oxygen transmission values, desiccant capacity and sorption curves, seal integrity, line speed on the customer’s filling equipment, and the depth of stability data they can supply. Qualification cycles are long, so incumbency is sticky once a structure passes accelerated and real-time storage studies. Testing capability is a genuine differentiator, because a converter that can run ASTM F1249 and ASTM D3985 work in house shortens the customer’s development timeline. Sterile barrier validation practice under ISO 11607 is referenced where pharmaceutical-grade formats are involved, though most of the category sits under food and supplement rules instead. New entrants appear mainly in mono-material barrier film and in recyclable closure design.
Strategic direction is consistent across suppliers. Portfolios are being extended toward recyclable high-barrier structures, testing and validation services are being brought in house and sold as part of the offer, and desiccant and gas-flush capability is being combined with film supply so that a single vendor can quote a complete specification.
Vendors are also widening application coverage, qualifying one barrier platform across supplement, dairy, infant and animal formats to spread fixed development cost.
Probiotics Packaging Industry Leaders
- Amcor plc
- AptarGroup, Inc.
- Constantia Flexibles Group GmbH
- Gerresheimer AG
- Clariant AG
Recent Industry Developments
- January 2023: Spain began taxing the non-recycled plastic content of single-use packaging – the levy raises the cost of multi-layer barrier films and desiccant-loaded polymer closures sold into that market.
- 2024: Several European Union member states, including Spain, Italy, the Netherlands, Poland and Czechia, permitted the word probiotic on food and supplement labels while the term remained unauthorised at bloc level – brands must now run market-specific artwork and claim sets across the same pack format.
- July 2025: Oregon began operating its packaging producer responsibility programme with producer fees modulated by recyclability – aluminium-polymer laminates and desiccant-loaded closures now carry a measurable compliance cost in a major United States market.
Companies Covered in the Report
- Amcor plc
- AptarGroup, Inc.
- Constantia Flexibles Group GmbH
- Gerresheimer AG
- Clariant AG
- Huhtamaki Oyj
- Mondi plc
- Lonza Group AG
- ACG Worldwide
- Winpak Ltd.
- Tekni-Plex, Inc.
- Uflex Limited
- ProAmpac LLC
Probiotics Packaging Market Report Scope
This study covers packaging engineered to protect live microbial cultures through shelf life and distribution, including high-barrier blisters, desiccant-integrated bottles and canisters, stick packs, sachets, foil laminates, gas-flushed formats, capsules and their packaging, barrier cartons and bottles, and refrigerated distribution packaging. The probiotic products themselves are not counted. The base year is 2025, and the forecast period runs from 2026 to 2033 in US$ Billion.
Packaging Format
- Bottles, Closures and Canisters
- Blister and Strip Packs
- Stick Packs and Sachets
- Foil Laminate Pouches
- Barrier Cartons and Bottles for Drinkable Formats
Material
- Polymer Films and Rigid Polymers
- Aluminium Foil Laminates
- Paperboard and Coated Cartons
- Mono-Material High-Barrier Structures
- Glass
Barrier Technology
- High-Barrier Laminates and Coatings
- Desiccant-Integrated Systems
- Nitrogen Flushing and Modified Atmosphere
- Refrigerated Distribution Packaging
Application
- Dietary Supplements
- Functional Food and Beverage
- Dairy
- Infant Formula
- Animal Feed and Pet Products
- Pharmaceutical
Regions
- North America
- Europe
- Asia Pacific
- Latin America
- Middle East & Africa
Key Questions Answered in the Report
How big is the probiotics packaging market in 2026?
The market is valued at US$ 1.4 billion in 2026, covering barrier packaging formats used to protect live microbial cultures through shelf life and distribution.
What is the probiotics packaging market forecast to 2033?
The market is projected to reach US$ 2.4 billion by 2033, growing at an 8.0% CAGR and adding US$ 1.0 billion in absolute dollar opportunity.
Which packaging format leads the probiotics packaging market?
Bottles, closures and canisters lead with 31.2% share in 2026, because desiccant can be integrated into the closure or container wall rather than added separately.
Which segment and region are growing fastest?
Mono-material high-barrier structures grow fastest at an 11.4% CAGR, while Asia Pacific is the fastest-growing geography at a 9.6% CAGR through 2033.
Which region holds the largest probiotics packaging share?
North America holds 34.8% share in 2026, reflecting the scale of supplement manufacturing in the United States and long uncontrolled-temperature distribution chains.
1. Executive Summary
1.1. Global Probiotics Packaging Market Snapshot
1.2. Future Projections, 2026-2033
1.3. Key Market Trends
1.4. Regional Snapshot
2. Market Overview
2.1. Market Definition and Report Scope
2.2. Historical Market Trends, 2020-2025
2.3. Market Dynamics
2.3.1. Drivers Impact Analysis
2.3.1.1. End-of-Shelf-Life Declared Counts Turn Barrier Performance Into a Contract Specification
2.3.1.2. Rising Culture Input Cost Moves Spending From Over-Formulation Into Better Packaging
2.3.2. Restraints Impact Analysis
2.3.2.1. Barrier Cost Collides With Price-Sensitive Supplement Products
2.3.2.2. Mono-Material Packaging Rules Conflict With Laminate and Desiccant Construction
2.3.3. Market Opportunities
2.3.3.1. Mono-Material High-Barrier Structures Open a Compliance-Driven Premium Segment
2.3.3.2. Animal Feed and Pet Product Packaging Creates a Fast-Expanding Secondary Pool
3. Global Probiotics Packaging Market Outlook, 2020-2033
3.1. Global Probiotics Packaging Market Outlook, by Packaging Format, Value (US$ Billion), 2020-2033
3.1.1. Bottles, Closures and Canisters
3.1.2. Blister and Strip Packs
3.1.3. Stick Packs and Sachets
3.1.4. Foil Laminate Pouches
3.1.5. Barrier Cartons and Bottles for Drinkable Formats
3.2. Global Probiotics Packaging Market Outlook, by Material, Value (US$ Billion), 2020-2033
3.2.1. Polymer Films and Rigid Polymers
3.2.2. Aluminium Foil Laminates
3.2.3. Paperboard and Coated Cartons
3.2.4. Mono-Material High-Barrier Structures
3.2.5. Glass
3.3. Global Probiotics Packaging Market Outlook, by Barrier Technology, Value (US$ Billion), 2020-2033
3.3.1. High-Barrier Laminates and Coatings
3.3.2. Desiccant-Integrated Systems
3.3.3. Nitrogen Flushing and Modified Atmosphere
3.3.4. Refrigerated Distribution Packaging
3.4. Global Probiotics Packaging Market Outlook, by Application, Value (US$ Billion), 2020-2033
3.4.1. Dietary Supplements
3.4.2. Functional Food and Beverage
3.4.3. Dairy
3.4.4. Infant Formula
3.4.5. Animal Feed and Pet Products
3.4.6. Pharmaceutical
3.5. Global Probiotics Packaging Market Outlook, by Region, Value (US$ Billion), 2020-2033
3.5.1. North America
3.5.2. Europe
3.5.3. Asia Pacific
3.5.4. Latin America
3.5.5. Middle East & Africa
4. North America Probiotics Packaging Market Outlook, 2020-2033
4.1. North America Probiotics Packaging Market Outlook, by Packaging Format, Value (US$ Billion), 2020-2033
4.1.1. Bottles, Closures and Canisters
4.1.2. Blister and Strip Packs
4.1.3. Stick Packs and Sachets
4.1.4. Foil Laminate Pouches
4.1.5. Barrier Cartons and Bottles for Drinkable Formats
4.2. North America Probiotics Packaging Market Outlook, by Material, Value (US$ Billion), 2020-2033
4.2.1. Polymer Films and Rigid Polymers
4.2.2. Aluminium Foil Laminates
4.2.3. Paperboard and Coated Cartons
4.2.4. Mono-Material High-Barrier Structures
4.2.5. Glass
4.3. North America Probiotics Packaging Market Outlook, by Barrier Technology, Value (US$ Billion), 2020-2033
4.3.1. High-Barrier Laminates and Coatings
4.3.2. Desiccant-Integrated Systems
4.3.3. Nitrogen Flushing and Modified Atmosphere
4.3.4. Refrigerated Distribution Packaging
4.4. North America Probiotics Packaging Market Outlook, by Application, Value (US$ Billion), 2020-2033
4.4.1. Dietary Supplements
4.4.2. Functional Food and Beverage
4.4.3. Dairy
4.4.4. Infant Formula
4.4.5. Animal Feed and Pet Products
4.4.6. Pharmaceutical
4.5. North America Probiotics Packaging Market Outlook, by Country, Value (US$ Billion), 2020-2033
4.5.1. United States Probiotics Packaging Market Outlook, by Packaging Format, 2020-2033
4.5.2. United States Probiotics Packaging Market Outlook, by Material, 2020-2033
4.5.3. United States Probiotics Packaging Market Outlook, by Barrier Technology, 2020-2033
4.5.4. United States Probiotics Packaging Market Outlook, by Application, 2020-2033
4.5.5. Canada Probiotics Packaging Market Outlook, by Packaging Format, 2020-2033
4.5.6. Canada Probiotics Packaging Market Outlook, by Material, 2020-2033
4.5.7. Canada Probiotics Packaging Market Outlook, by Barrier Technology, 2020-2033
4.5.8. Canada Probiotics Packaging Market Outlook, by Application, 2020-2033
5. Europe Probiotics Packaging Market Outlook, 2020-2033
5.1. Europe Probiotics Packaging Market Outlook, by Packaging Format, Value (US$ Billion), 2020-2033
5.1.1. Bottles, Closures and Canisters
5.1.2. Blister and Strip Packs
5.1.3. Stick Packs and Sachets
5.1.4. Foil Laminate Pouches
5.1.5. Barrier Cartons and Bottles for Drinkable Formats
5.2. Europe Probiotics Packaging Market Outlook, by Material, Value (US$ Billion), 2020-2033
5.2.1. Polymer Films and Rigid Polymers
5.2.2. Aluminium Foil Laminates
5.2.3. Paperboard and Coated Cartons
5.2.4. Mono-Material High-Barrier Structures
5.2.5. Glass
5.3. Europe Probiotics Packaging Market Outlook, by Barrier Technology, Value (US$ Billion), 2020-2033
5.3.1. High-Barrier Laminates and Coatings
5.3.2. Desiccant-Integrated Systems
5.3.3. Nitrogen Flushing and Modified Atmosphere
5.3.4. Refrigerated Distribution Packaging
5.4. Europe Probiotics Packaging Market Outlook, by Application, Value (US$ Billion), 2020-2033
5.4.1. Dietary Supplements
5.4.2. Functional Food and Beverage
5.4.3. Dairy
5.4.4. Infant Formula
5.4.5. Animal Feed and Pet Products
5.4.6. Pharmaceutical
5.5. Europe Probiotics Packaging Market Outlook, by Country, Value (US$ Billion), 2020-2033
5.5.1. Germany Probiotics Packaging Market Outlook, by Packaging Format, 2020-2033
5.5.2. Germany Probiotics Packaging Market Outlook, by Material, 2020-2033
5.5.3. Germany Probiotics Packaging Market Outlook, by Barrier Technology, 2020-2033
5.5.4. Germany Probiotics Packaging Market Outlook, by Application, 2020-2033
5.5.5. Italy Probiotics Packaging Market Outlook, by Packaging Format, 2020-2033
5.5.6. Italy Probiotics Packaging Market Outlook, by Material, 2020-2033
5.5.7. Italy Probiotics Packaging Market Outlook, by Barrier Technology, 2020-2033
5.5.8. Italy Probiotics Packaging Market Outlook, by Application, 2020-2033
5.5.9. France Probiotics Packaging Market Outlook, by Packaging Format, 2020-2033
5.5.10. France Probiotics Packaging Market Outlook, by Material, 2020-2033
5.5.11. France Probiotics Packaging Market Outlook, by Barrier Technology, 2020-2033
5.5.12. France Probiotics Packaging Market Outlook, by Application, 2020-2033
5.5.13. Spain Probiotics Packaging Market Outlook, by Packaging Format, 2020-2033
5.5.14. Spain Probiotics Packaging Market Outlook, by Material, 2020-2033
5.5.15. Spain Probiotics Packaging Market Outlook, by Barrier Technology, 2020-2033
5.5.16. Spain Probiotics Packaging Market Outlook, by Application, 2020-2033
5.5.17. Poland Probiotics Packaging Market Outlook, by Packaging Format, 2020-2033
5.5.18. Poland Probiotics Packaging Market Outlook, by Material, 2020-2033
5.5.19. Poland Probiotics Packaging Market Outlook, by Barrier Technology, 2020-2033
5.5.20. Poland Probiotics Packaging Market Outlook, by Application, 2020-2033
6. Asia Pacific Probiotics Packaging Market Outlook, 2020-2033
6.1. Asia Pacific Probiotics Packaging Market Outlook, by Packaging Format, Value (US$ Billion), 2020-2033
6.1.1. Bottles, Closures and Canisters
6.1.2. Blister and Strip Packs
6.1.3. Stick Packs and Sachets
6.1.4. Foil Laminate Pouches
6.1.5. Barrier Cartons and Bottles for Drinkable Formats
6.2. Asia Pacific Probiotics Packaging Market Outlook, by Material, Value (US$ Billion), 2020-2033
6.2.1. Polymer Films and Rigid Polymers
6.2.2. Aluminium Foil Laminates
6.2.3. Paperboard and Coated Cartons
6.2.4. Mono-Material High-Barrier Structures
6.2.5. Glass
6.3. Asia Pacific Probiotics Packaging Market Outlook, by Barrier Technology, Value (US$ Billion), 2020-2033
6.3.1. High-Barrier Laminates and Coatings
6.3.2. Desiccant-Integrated Systems
6.3.3. Nitrogen Flushing and Modified Atmosphere
6.3.4. Refrigerated Distribution Packaging
6.4. Asia Pacific Probiotics Packaging Market Outlook, by Application, Value (US$ Billion), 2020-2033
6.4.1. Dietary Supplements
6.4.2. Functional Food and Beverage
6.4.3. Dairy
6.4.4. Infant Formula
6.4.5. Animal Feed and Pet Products
6.4.6. Pharmaceutical
6.5. Asia Pacific Probiotics Packaging Market Outlook, by Country, Value (US$ Billion), 2020-2033
6.5.1. India Probiotics Packaging Market Outlook, by Packaging Format, 2020-2033
6.5.2. India Probiotics Packaging Market Outlook, by Material, 2020-2033
6.5.3. India Probiotics Packaging Market Outlook, by Barrier Technology, 2020-2033
6.5.4. India Probiotics Packaging Market Outlook, by Application, 2020-2033
6.5.5. China Probiotics Packaging Market Outlook, by Packaging Format, 2020-2033
6.5.6. China Probiotics Packaging Market Outlook, by Material, 2020-2033
6.5.7. China Probiotics Packaging Market Outlook, by Barrier Technology, 2020-2033
6.5.8. China Probiotics Packaging Market Outlook, by Application, 2020-2033
6.5.9. South Korea Probiotics Packaging Market Outlook, by Packaging Format, 2020-2033
6.5.10. South Korea Probiotics Packaging Market Outlook, by Material, 2020-2033
6.5.11. South Korea Probiotics Packaging Market Outlook, by Barrier Technology, 2020-2033
6.5.12. South Korea Probiotics Packaging Market Outlook, by Application, 2020-2033
6.5.13. Japan Probiotics Packaging Market Outlook, by Packaging Format, 2020-2033
6.5.14. Japan Probiotics Packaging Market Outlook, by Material, 2020-2033
6.5.15. Japan Probiotics Packaging Market Outlook, by Barrier Technology, 2020-2033
6.5.16. Japan Probiotics Packaging Market Outlook, by Application, 2020-2033
7. Latin America Probiotics Packaging Market Outlook, 2020-2033
7.1. Latin America Probiotics Packaging Market Outlook, by Packaging Format, Value (US$ Billion), 2020-2033
7.1.1. Bottles, Closures and Canisters
7.1.2. Blister and Strip Packs
7.1.3. Stick Packs and Sachets
7.1.4. Foil Laminate Pouches
7.1.5. Barrier Cartons and Bottles for Drinkable Formats
7.2. Latin America Probiotics Packaging Market Outlook, by Material, Value (US$ Billion), 2020-2033
7.2.1. Polymer Films and Rigid Polymers
7.2.2. Aluminium Foil Laminates
7.2.3. Paperboard and Coated Cartons
7.2.4. Mono-Material High-Barrier Structures
7.2.5. Glass
7.3. Latin America Probiotics Packaging Market Outlook, by Barrier Technology, Value (US$ Billion), 2020-2033
7.3.1. High-Barrier Laminates and Coatings
7.3.2. Desiccant-Integrated Systems
7.3.3. Nitrogen Flushing and Modified Atmosphere
7.3.4. Refrigerated Distribution Packaging
7.4. Latin America Probiotics Packaging Market Outlook, by Application, Value (US$ Billion), 2020-2033
7.4.1. Dietary Supplements
7.4.2. Functional Food and Beverage
7.4.3. Dairy
7.4.4. Infant Formula
7.4.5. Animal Feed and Pet Products
7.4.6. Pharmaceutical
7.5. Latin America Probiotics Packaging Market Outlook, by Country, Value (US$ Billion), 2020-2033
7.5.1. Brazil Probiotics Packaging Market Outlook, by Packaging Format, 2020-2033
7.5.2. Brazil Probiotics Packaging Market Outlook, by Material, 2020-2033
7.5.3. Brazil Probiotics Packaging Market Outlook, by Barrier Technology, 2020-2033
7.5.4. Brazil Probiotics Packaging Market Outlook, by Application, 2020-2033
7.5.5. Mexico Probiotics Packaging Market Outlook, by Packaging Format, 2020-2033
7.5.6. Mexico Probiotics Packaging Market Outlook, by Material, 2020-2033
7.5.7. Mexico Probiotics Packaging Market Outlook, by Barrier Technology, 2020-2033
7.5.8. Mexico Probiotics Packaging Market Outlook, by Application, 2020-2033
7.5.9. Argentina Probiotics Packaging Market Outlook, by Packaging Format, 2020-2033
7.5.10. Argentina Probiotics Packaging Market Outlook, by Material, 2020-2033
7.5.11. Argentina Probiotics Packaging Market Outlook, by Barrier Technology, 2020-2033
7.5.12. Argentina Probiotics Packaging Market Outlook, by Application, 2020-2033
7.5.13. Colombia Probiotics Packaging Market Outlook, by Packaging Format, 2020-2033
7.5.14. Colombia Probiotics Packaging Market Outlook, by Material, 2020-2033
7.5.15. Colombia Probiotics Packaging Market Outlook, by Barrier Technology, 2020-2033
7.5.16. Colombia Probiotics Packaging Market Outlook, by Application, 2020-2033
8. Middle East & Africa Probiotics Packaging Market Outlook, 2020-2033
8.1. Middle East & Africa Probiotics Packaging Market Outlook, by Packaging Format, Value (US$ Billion), 2020-2033
8.1.1. Bottles, Closures and Canisters
8.1.2. Blister and Strip Packs
8.1.3. Stick Packs and Sachets
8.1.4. Foil Laminate Pouches
8.1.5. Barrier Cartons and Bottles for Drinkable Formats
8.2. Middle East & Africa Probiotics Packaging Market Outlook, by Material, Value (US$ Billion), 2020-2033
8.2.1. Polymer Films and Rigid Polymers
8.2.2. Aluminium Foil Laminates
8.2.3. Paperboard and Coated Cartons
8.2.4. Mono-Material High-Barrier Structures
8.2.5. Glass
8.3. Middle East & Africa Probiotics Packaging Market Outlook, by Barrier Technology, Value (US$ Billion), 2020-2033
8.3.1. High-Barrier Laminates and Coatings
8.3.2. Desiccant-Integrated Systems
8.3.3. Nitrogen Flushing and Modified Atmosphere
8.3.4. Refrigerated Distribution Packaging
8.4. Middle East & Africa Probiotics Packaging Market Outlook, by Application, Value (US$ Billion), 2020-2033
8.4.1. Dietary Supplements
8.4.2. Functional Food and Beverage
8.4.3. Dairy
8.4.4. Infant Formula
8.4.5. Animal Feed and Pet Products
8.4.6. Pharmaceutical
8.5. Middle East & Africa Probiotics Packaging Market Outlook, by Country, Value (US$ Billion), 2020-2033
8.5.1. United Arab Emirates Probiotics Packaging Market Outlook, by Packaging Format, 2020-2033
8.5.2. United Arab Emirates Probiotics Packaging Market Outlook, by Material, 2020-2033
8.5.3. United Arab Emirates Probiotics Packaging Market Outlook, by Barrier Technology, 2020-2033
8.5.4. United Arab Emirates Probiotics Packaging Market Outlook, by Application, 2020-2033
8.5.5. Saudi Arabia Probiotics Packaging Market Outlook, by Packaging Format, 2020-2033
8.5.6. Saudi Arabia Probiotics Packaging Market Outlook, by Material, 2020-2033
8.5.7. Saudi Arabia Probiotics Packaging Market Outlook, by Barrier Technology, 2020-2033
8.5.8. Saudi Arabia Probiotics Packaging Market Outlook, by Application, 2020-2033
8.5.9. Turkey Probiotics Packaging Market Outlook, by Packaging Format, 2020-2033
8.5.10. Turkey Probiotics Packaging Market Outlook, by Material, 2020-2033
8.5.11. Turkey Probiotics Packaging Market Outlook, by Barrier Technology, 2020-2033
8.5.12. Turkey Probiotics Packaging Market Outlook, by Application, 2020-2033
8.5.13. Egypt Probiotics Packaging Market Outlook, by Packaging Format, 2020-2033
8.5.14. Egypt Probiotics Packaging Market Outlook, by Material, 2020-2033
8.5.15. Egypt Probiotics Packaging Market Outlook, by Barrier Technology, 2020-2033
8.5.16. Egypt Probiotics Packaging Market Outlook, by Application, 2020-2033
8.5.17. South Africa Probiotics Packaging Market Outlook, by Packaging Format, 2020-2033
8.5.18. South Africa Probiotics Packaging Market Outlook, by Material, 2020-2033
8.5.19. South Africa Probiotics Packaging Market Outlook, by Barrier Technology, 2020-2033
8.5.20. South Africa Probiotics Packaging Market Outlook, by Application, 2020-2033
9. Competitive Landscape
9.1. Market Concentration and Industry Leaders
9.2. Competitive Differentiation
9.3. Strategic Initiatives
9.4. Recent Industry Developments
9.5. Company Profiles
9.5.1. Amcor plc
9.5.2. AptarGroup, Inc.
9.5.3. Constantia Flexibles Group GmbH
9.5.4. Gerresheimer AG
9.5.5. Clariant AG
9.5.6. Huhtamaki Oyj
9.5.7. Mondi plc
9.5.8. Lonza Group AG
9.5.9. ACG Worldwide
9.5.10. Winpak Ltd.
9.5.11. Tekni-Plex, Inc.
9.5.12. Uflex Limited
9.5.13. ProAmpac LLC
10. Appendix
10.1. Research Methodology
10.2. Report Assumptions
10.3. Acronyms and Abbreviations
| Packaging Format | Bottles, Closures and Canisters, Blister and Strip Packs, Stick Packs and Sachets, Foil Laminate Pouches, Barrier Cartons and Bottles for Drinkable Formats |
| Material | Polymer Films and Rigid Polymers, Aluminium Foil Laminates, Paperboard and Coated Cartons, Mono-Material High-Barrier Structures, Glass |
| Barrier Technology | High-Barrier Laminates and Coatings, Desiccant-Integrated Systems, Nitrogen Flushing and Modified Atmosphere, Refrigerated Distribution Packaging |
| Application | Dietary Supplements, Functional Food and Beverage, Dairy, Infant Formula, Animal Feed and Pet Products, Pharmaceutical |
| Regions | North America, Europe, Asia Pacific, Latin America, Middle East & Africa |
Our Research Methodology
Considering the volatility of business today, traditional approaches to strategizing a game plan can be unfruitful if not detrimental. True ambiguity is no way to determine a forecast. A myriad of predetermined factors must be accounted for such as the degree of risk involved, the magnitude of circumstances, as well as conditions or consequences that are not known or unpredictable. To circumvent binary views that cast uncertainty, the application of market research intelligence to strategically posture, move, and enable actionable outcomes is necessary.
View Methodology
Quality Assured
Rigorous Validation Process

Confidentiality Assured
End-to-end Data Security

Custom Research Services
Tailored To Your Objectives
Related Reports
Rigid Bulk Packaging Market Size, Share, Insights, Competitive Landscape, and Forecast 2026 to 2033
The global rigid bulk packaging market is valued at US$68.5 billion in 2026, reaching US$96.4 billion by 2033, growing at a 5.0% CAGR
Epoxy Composites Market Size, Share, Insights, Competitive Landscape, and Forecast 2026 to 2033
Explore the epoxy composites market, projected to reach US$ 22.3 billion by 2033 at a 6.7% CAGR, with resin, reinforcement and regional insights.
Advanced Materials Market Size, Share, Insights, Competitive Landscape, and Forecast 2026 to 2033
Explore the advanced materials market, projected to reach US$ 121.08 billion by 2033 at a 6.6% CAGR, with product, application and regional insights.
Biopolymer Coatings Market Size, Share, Insights, Competitive Landscape, and Forecast 2026 to 2033
Explore the biopolymer coatings market, projected to reach US$ 2.5 billion by 2033 at a 7.6% CAGR, with product, technology and regional insights.
Dry Construction Market Size, Share, Insights, Competitive Landscape, and Forecast 2026 to 2033
Explore the dry construction market, projected to reach US$ 134.87 billion by 2033 at a 4.7% CAGR, with material, system and regional insights.
Waterproofing Admixtures Market Size, Share, Insights, Competitive Landscape, and Forecast 2026 to 2033
Waterproofing admixtures market to grow from US$ 2.4 billion in 2026 to US$ 3.6 billion by 2033 at a 6.0% CAGR. Explore products, applications and regions.