



Bio Vanillin Market
Bio Vanillin Market Size, Share, Insights, Competitive Landscape, and Forecast 2026 to 2033
Bio Vanillin Market Size, Share, Insights, Competitive Landscape, and Forecast 2026 to 2033
How Fast Is the Bio Vanillin Market Growing?
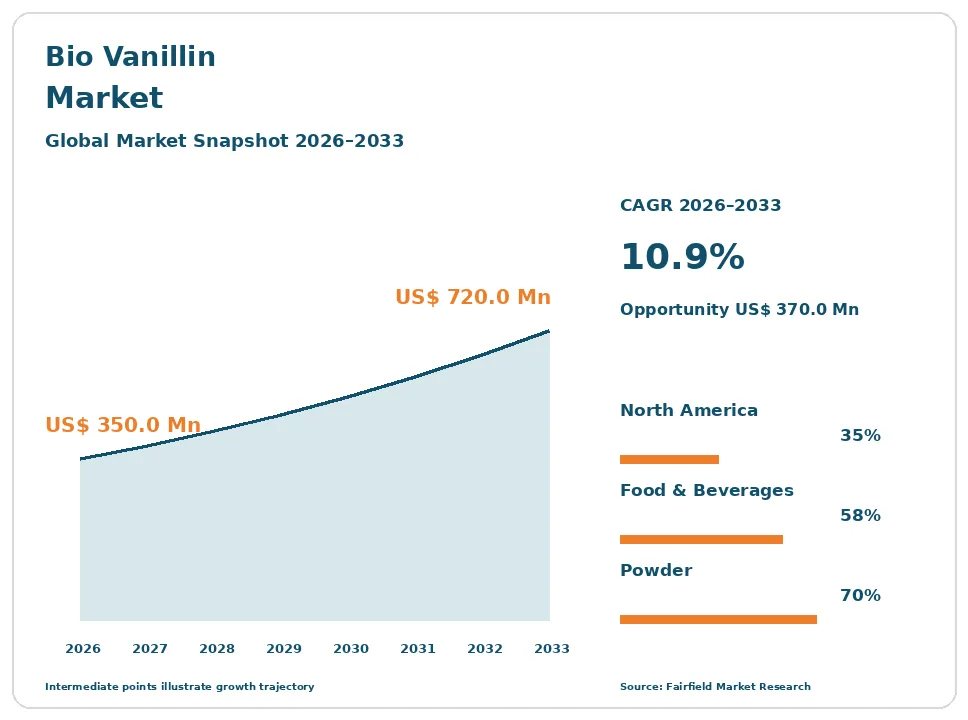
The global bio vanillin market size is expected to be valued at US$ 350.0 million in 2026 and projected to reach US$ 720.0 million by 2033, growing at a CAGR of 10.9% between 2026 and 2033.
Between 2020 and 2025, the market grew at a CAGR of about 9.0%, as food, beverage, and personal care brands replaced petrochemical vanillin with natural and bio-based alternatives to meet clean-label demand. Bio vanillin is vanillin produced from renewable sources rather than petroleum-derived guaiacol, using fermentation of ferulic acid from rice bran, conversion of eugenol from clove oil, lignin from wood, or precision fermentation of sugars with engineered yeast. Many grades qualify as natural vanillin under European Union and U.S. flavor rules. Bio vanillin offers a stable, affordable alternative to vanilla bean extract, whose prices swing sharply with weather and harvests in Madagascar. Growth comes from clean-label trends, premium bakery and dairy products, plant-based foods, and natural fragrances. The market is shifting toward fermentation-based production with higher purity. In March 2026, Lallemand launched Hevani, a yeast-based natural vanillin with 98% purity.
Key Report Takeaways
- By Source: Microbial Fermentation held more than 60.0% share in 2026 and is projected to expand at the fastest 12.4% CAGR through 2033, driven by precision fermentation, ferulic acid conversion, and scalable, harvest-independent production of high-purity natural vanillin.
- By Application: Food & Beverages held 58.0% share in 2026 and is projected to expand at the fastest 11.3% CAGR through 2033, driven by clean-label bakery, dairy, confectionery, beverages, and plant-based products that require natural flavor declarations.
- By Form: Powder held 70.0% share in 2026 and is projected to expand at the fastest 11.1% CAGR through 2033, driven by easy handling, long shelf life, and wide use in dry mixes, bakery, and confectionery.
- By Region: North America held 35.0% share in 2026, while Asia Pacific is projected to expand at a 14.2% CAGR through 2033, driven by rising packaged food consumption, premium bakery growth, and local fermentation capacity in China and India.
Global Bio Vanillin Market Trends and Insights
Drivers Impact Analysis
| Driver | Impact on CAGR Forecast | Geographic Relevance | Impact Timeline |
| Clean-label demand and natural flavor regulations | High | North America, Europe | Long term (≥4 years) |
| Vanilla bean price volatility and supply risk | High | Global | Medium term (2-4 years) |
Two drivers carry the strongest influence on bio vanillin demand during the forecast period.
Clean-Label Demand Is Driving the Bio Vanillin Market
Clean-label demand and natural flavor regulations are the strongest driver of the bio vanillin market. Consumers want ingredients they recognize as natural.
The mechanism is label pressure from shoppers and retailers. Consumers in North America, Europe, and increasingly Asia Pacific check ingredient lists and avoid artificial flavors. Food companies reformulate ice cream, yogurt, chocolate, cookies, cereals, and beverages to replace synthetic vanillin with natural options. Under European Union and U.S. rules, vanillin made by fermentation from natural substrates can be labeled as natural flavoring, giving brands a cost-effective way to claim natural vanilla taste. Plant-based dairy alternatives use vanilla flavors to mask off-notes. Fragrance and cosmetics makers also seek bio-based ingredients to meet sustainability claims. Bio-based flavors fit this demand for natural, traceable, and sustainable ingredients, creating steady growth.
Vanilla Price Volatility Is Expanding the Bio Vanillin Market
Vanilla bean price volatility and supply risk are expanding the bio vanillin market. Natural vanilla supply is small and unstable.
The cause is concentrated, weather-dependent production. Most vanilla beans come from Madagascar, where cyclones, theft, and quality issues create large price swings. Vanilla is labor-intensive, hand-pollinated, and takes years to mature. Bean vanillin covers only a tiny fraction of global vanillin demand. Food makers want stable costs and reliable supply, which fermentation-based bio vanillin delivers year-round. Lallemand says its Hevani vanillin offers consistent quality without harvest risk. Large food companies also face sustainability and ethical sourcing questions about vanilla farming. Natural vanilla extract remains a premium choice, but bio-based flavors fill the gap for everyday products. These supply concerns push buyers toward bio-based alternatives.
Restraints Impact Analysis
| Restraint | Impact on CAGR Forecast | Geographic Relevance | Impact Timeline |
| Higher cost than synthetic vanillin | High | Global | Long term (≥4 years) |
| Regulatory labeling complexity and GMO concerns | Medium | Europe, North America | Medium term (2-4 years) |
Two restraints limit how quickly the bio vanillin market grows.
Higher Costs Slow the Bio Vanillin Market
Higher cost than synthetic vanillin slows the bio vanillin market. Petroleum-based vanillin remains much cheaper.
The specific causes are production scale and process costs. Synthetic vanillin from guaiacol is made in very large volumes at low cost, mainly in China and Europe, and it supplies most of the world’s vanillin demand. Bio vanillin requires fermentation tanks, careful sterilization, purification, and natural feedstocks such as ferulic acid, eugenol, or glucose, which raise costs per kilogram several times above synthetic grades. Feedstock prices can also change with rice, clove, and sugar markets. Price-sensitive food makers in emerging markets often keep using synthetic vanillin, especially for mass-market biscuits, candies, and beverages. Scaling fermentation requires heavy capital investment and long process development. These cost gaps limit adoption outside premium and clean-label products and slow conversion of large-volume applications.
Labeling Complexity Restricts the Bio Vanillin Market
Regulatory labeling complexity and GMO concerns restrict the bio vanillin market. Rules differ by country and by process.
The underlying causes are inconsistent definitions and consumer perception. What counts as a natural flavoring varies between the European Union, the United States, and countries in Asia Pacific, so a grade that qualifies as natural in one market may not in another. Some consumers distrust precision fermentation with engineered microbes, even when no GMO labeling is required. Organic certification may not apply to all bio vanillin types, which limits use in organic products. Approvals for new processes and documentation requirements take time and money. Fraud concerns, where synthetic vanillin is sold as natural, lead buyers to demand isotope testing. These issues slow product launches and add compliance costs for suppliers.
Market Opportunities
Precision Fermentation Opens a Fast-Growth Revenue Pool
Precision fermentation opens a fast-growth revenue pool in the bio vanillin market. Biotech production can lower costs and raise purity.
Biotech companies and flavor houses can capture this opportunity. Engineered yeast and bacteria can convert sugars directly to vanillin with high yields, avoiding scarce feedstocks such as ferulic acid and clove oil. Lallemand acquired Evolva’s fermentation technology and launched Hevani in March 2026, approved for flavor use in the European Union and the United States. Continued strain engineering, larger fermenters, and better downstream purification are lowering costs. Precision fermentation can also produce other vanilla aroma compounds that recreate the full taste of vanilla extract. Contract fermentation capacity is expanding worldwide. Companies that scale efficient fermentation can compete more closely with synthetic prices and win large food contracts.
Cosmetics and Pharmaceuticals Create a Premium Revenue Pool
Cosmetics, fragrances, and pharmaceuticals create a premium revenue pool in the bio vanillin market. These buyers pay more for natural ingredients.
Ingredient suppliers can capture this opportunity. Perfumes, body care, lip products, candles, and home fragrances use vanillin for warm, sweet notes, and brands want natural and bio-based claims to support sustainability messages. Gourmand fragrance trends keep vanilla among the most popular scent families. Pharmaceutical companies use vanillin to mask bitter tastes in syrups, chewable tablets, and nutritional supplements. Vanillin is also an intermediate for some drugs and specialty chemicals. High-purity grades command premium prices and long-term contracts. Natural and vegan beauty brands, which are growing quickly online, prefer ingredients with clear renewable origins and low environmental impact. Companies that offer certified, traceable, and sustainable bio vanillin can win premium contracts.
Segment Analysis
By Source: Microbial Fermentation Leads and Grows Fastest
Microbial Fermentation held more than 60.0% share in 2026 and is the fastest-growing source, expanding at a 12.4% CAGR through 2033. This includes fermentation of ferulic acid from rice bran, microbial conversion of eugenol, and precision fermentation from glucose. Syensqo’s Rhovanil Natural uses fermentation of a rice bran oil by-product, and Lallemand’s Hevani uses yeast-based processes. Fermentation offers natural labeling, consistent quality, and scalable supply.
Lignin-based vanillin from wood, produced by Borregaard in Norway, offers a bio-based, lower-carbon option for food and fragrance, though it is not always labeled natural. Other sources include clove oil and vanilla bean extract, which serve niche premium uses. For the market, fermentation growth expands scalable natural supply.
By Application: Food & Beverages Lead and Grow Fastest
Food & Beverages held 58.0% share in 2026 and are the fastest-growing application, expanding at a 11.3% CAGR through 2033. Bakery, dairy, ice cream, chocolate, confectionery, cereals, beverages, and plant-based products are the main uses. Clean-label reformulation by large food brands in North America and Europe drives demand, while packaged food growth in Asia Pacific adds volume. Plant-based milks and protein products use vanilla to improve taste.
Fragrances and cosmetics form the second-largest application, valued for natural sweet notes. Pharmaceuticals use vanillin for flavor masking, and other uses include animal feed and specialty chemicals. Growing demand for sugar-reduced products also supports vanillin, because vanilla notes enhance perceived sweetness. For the market, food growth drives volume and supplier scale.
By Form: Powder Leads and Grows Fastest
Powder held 70.0% share in 2026 and is the fastest-growing form, expanding at a 11.1% CAGR through 2033. Crystalline and powdered vanillin is easy to store, transport, and blend into dry mixes, bakery premixes, chocolate, sugar, and seasonings, and it has a long shelf life. Most producers sell vanillin as crystals or powder, which also allows accurate dosing in small quantities. Bakery and confectionery manufacturers prefer powder because it mixes evenly with flour, sugar, and cocoa and survives high processing temperatures well.
Liquid forms, including solutions and emulsions, serve beverages, dairy, and fragrances where easy dosing matters. Encapsulated forms protect flavor during baking and extend release in chewing gum and snacks. Liquid demand is rising in ready-to-drink coffee, protein shakes, and flavored milk. For the market, powder growth supports dry food applications and efficient global shipping.
Geography Analysis
Which Region Is Leading the Bio Vanillin Market?
North America is leading the bio vanillin market with a 35.0% share in 2026. The United States has strong clean-label demand from food, beverage, and personal care brands, and natural flavor labeling rules support bio vanillin. Large flavor houses such as IFF, ADM, and Sensient Technologies serve major food makers that are reformulating ice cream, yogurt, baked goods, and beverages. Imports of bio vanillin into the region have risen as demand grows. Canada adds demand, and Lallemand is headquartered in Montreal. Key barriers include higher cost than synthetic vanillin. One change shaping the region is clean-label reformulation.
Europe Advances the Bio Vanillin Market Through Natural Flavor Rules
Europe is a major bio vanillin market. France, Germany, Switzerland, the United Kingdom, and Norway host Syensqo, Symrise, Givaudan, dsm-firmenich, and Borregaard, making the region a center of flavor and fragrance innovation. European Union natural flavor rules support demand for fermentation-based vanillin, and strong chocolate, bakery, and dairy industries use large volumes. Cosmetics and fine fragrance brands in France favor natural ingredients, and retailers push suppliers for sustainable sourcing. Consumers in the region read labels closely and reward natural claims. Key barriers include strict regulation and cost. One opportunity is natural fragrance and cosmetics.
Which Region Is Growing Fastest in the Bio Vanillin Market?
Asia Pacific is growing fastest in the bio vanillin market at a 14.2% CAGR through 2033. China, India, Japan, Indonesia, and Australia have growing packaged food, bakery, and beverage industries, and rising incomes support premium products. China is a large vanillin producer, and Camlin Fine Sciences in India has vanillin operations. Brenntag renewed its distribution partnership with Syensqo for vanillin in the region in March 2025. Food delivery, cafes, and premium bakery chains are spreading across large cities, raising demand for vanilla-flavored products. Key barriers include price sensitivity and strong local synthetic vanillin production. One change shaping the region is local fermentation production.
Latin America Grows the Bio Vanillin Market Through Food Processing
Latin America is a growing bio vanillin market. Brazil and Mexico have large food and beverage industries, including bakery, dairy, confectionery, and soft drinks, and multinational food companies run major plants there. Mexico is the historic home of vanilla, and its consumers value vanilla flavors. Argentina, Chile, and Colombia add demand. Brazilian sugarcane offers potential fermentation feedstock, and the region’s large dairy and ice cream sectors use vanilla flavors widely. Clean-label trends are spreading among middle-class consumers in large cities, and multinational brands apply global reformulation policies to their local products. Key barriers include higher costs and currency swings. One opportunity is confectionery and dairy reformulation.
Middle East & Africa Develops the Bio Vanillin Market Through Packaged Foods
Middle East & Africa is a developing bio vanillin market. Saudi Arabia, the United Arab Emirates, Egypt, and South Africa have growing bakery, dairy, and confectionery industries serving young populations. Madagascar supplies most of the world’s vanilla beans, and its price swings push buyers in the region and beyond toward bio vanillin. Halal certification is important for food ingredients, and suppliers must provide clear documentation. Rising tourism, hotels, and cafe culture in the region support premium desserts and bakery products, while local dairy producers expand flavored milk and yogurt ranges. Key barriers include cost and limited local production. One change shaping the region is packaged food growth.
Competitive Landscape
The bio vanillin market is moderately consolidated. Syensqo, Lallemand, Givaudan, Symrise, and Borregaard are leading players, while IFF, dsm-firmenich, ADM, Sensient Technologies, Döhler, Camlin Fine Sciences, and Takasago compete strongly. Several biotech startups are developing new fermentation routes, while Chinese producers supply large volumes of synthetic and some natural vanillin. Smaller specialty firms focus on organic, vanilla bean, and fragrance-grade products.
Companies compete on purity, natural certification, taste profile, cost, supply reliability, and regulatory support. Large flavor houses combine bio vanillin with other natural flavors to offer complete vanilla systems to food makers. Producers with their own fermentation capacity and feedstock access have cost advantages. Distribution partnerships extend reach to smaller food manufacturers in many countries. Strong regulatory and quality documentation, including proof of natural origin through isotope testing, builds trust with buyers and helps suppliers win long-term contracts with major food brands.
Strategic moves show how competition is changing. In October 2024, Syensqo expanded its natural flavors range, featuring Rhovanil Natural. In March 2025, Brenntag and Syensqo renewed their vanillin distribution partnership in Asia Pacific. In March 2026, Lallemand launched Hevani using precision fermentation. These moves show competition shifting toward fermentation-based natural vanillin and wider distribution.
Three themes shape vendor strategy. First, companies are investing in precision fermentation to lower costs. Second, they are expanding distribution in fast-growing regions. Third, they are targeting cosmetics and fragrance customers with high-purity grades.
Bio Vanillin Market Industry Leaders
- Syensqo
- Lallemand
- Givaudan
- Symrise
- Borregaard
Recent Industry Developments
- March 2026: Lallemand launched Hevani, a natural vanillin made by yeast-based precision fermentation with 98% purity, built on technology acquired from Evolva - adds harvest-independent natural vanillin supply.
- March 2025: Brenntag and Syensqo renewed their partnership to supply Rhovanil vanillin and Rhodiarome ethylvanillin in Australia, New Zealand, Taiwan, and other markets in Asia Pacific - widens distribution of vanilla aroma products.
- October 2024: Syensqo expanded its natural flavors range, highlighting Rhovanil Natural made by fermenting a non-GMO rice bran oil by-product - strengthens bio vanillin for clean-label foods.
Companies Covered in the Report
- Syensqo
- Lallemand
- Givaudan
- Symrise
- Borregaard
- IFF
- dsm-firmenich
- ADM
- Sensient Technologies
- Döhler
- Camlin Fine Sciences
- Takasago
Bio Vanillin Market Report Scope
This report covers bio vanillin produced through microbial fermentation, lignin conversion, clove oil and eugenol conversion, and other natural routes, in powder and liquid forms, for food and beverages, fragrances and cosmetics, pharmaceuticals, and other applications. The base year is 2025, and the forecast period runs from 2026 to 2033. All values are expressed in US$ Million.
Source
- Microbial Fermentation
- Lignin-Based
- Clove Oil and Eugenol
- Others
Application
- Food & Beverages
- Fragrances & Cosmetics
- Pharmaceuticals
- Others
Form
- Powder
- Liquid
Regions
- North America
- Europe
- Asia Pacific
- Latin America
- Middle East & Africa
Key Questions Answered in the Report
How big is the bio vanillin market in 2026?
The bio vanillin market is valued at US$ 350.0 million in 2026, led by microbial fermentation and North America.
What is the bio vanillin market forecast to 2033?
The market is projected to reach US$ 720.0 million by 2033, growing at a 10.9% CAGR and adding US$ 370.0 million.
Which source is growing fastest in the bio vanillin market?
Microbial fermentation is growing fastest at a 12.4% CAGR through 2033, driven by precision fermentation and scalable natural production.
Which region is growing fastest in the bio vanillin market?
Asia Pacific is growing fastest at a 14.2% CAGR through 2033, driven by packaged food growth and bakery demand in China and India.
Which region holds the largest bio vanillin market share?
North America holds the largest share at 35.0% in 2026, supported by strong clean-label demand and natural flavor labeling rules.
1. Executive Summary
1.1. Global Bio Vanillin Market Snapshot
1.2. Future Projections
1.3. Key Report Takeaways
1.4. Regional Snapshot
2. Market Overview
2.1. Market Definition and Report Scope
2.2. Historical Trends 2020–2025
2.3. Market Dynamics
2.3.1. Drivers
2.3.1.1. Clean-Label Demand Is Driving the Bio Vanillin Market
2.3.1.2. Vanilla Price Volatility Is Expanding the Bio Vanillin Market
2.3.2. Restraints
2.3.2.1. Higher Costs Slow the Bio Vanillin Market
2.3.2.2. Labeling Complexity Restricts the Bio Vanillin Market
2.3.3. Market Opportunities
2.3.3.1. Precision Fermentation Opens a Fast-Growth Revenue Pool
2.3.3.2. Cosmetics and Pharmaceuticals Create a Premium Revenue Pool
3. Global Bio Vanillin Market Outlook, 2020-2033
3.1. Global Bio Vanillin Market Outlook, by Source, Value (US$ Million), 2020-2033
3.1.1. Microbial Fermentation
3.1.2. Lignin-Based
3.1.3. Clove Oil and Eugenol
3.1.4. Others
3.2. Global Bio Vanillin Market Outlook, by Application, Value (US$ Million), 2020-2033
3.2.1. Food & Beverages
3.2.2. Fragrances & Cosmetics
3.2.3. Pharmaceuticals
3.2.4. Others
3.3. Global Bio Vanillin Market Outlook, by Form, Value (US$ Million), 2020-2033
3.3.1. Powder
3.3.2. Liquid
3.4. Global Bio Vanillin Market Outlook, by Region, Value (US$ Million), 2020-2033
3.4.1. North America
3.4.2. Europe
3.4.3. Asia Pacific
3.4.4. Latin America
3.4.5. Middle East & Africa
4. North America Bio Vanillin Market Outlook, 2020-2033
4.1. North America Bio Vanillin Market Outlook, by Source, Value (US$ Million), 2020-2033
4.1.1. Microbial Fermentation
4.1.2. Lignin-Based
4.1.3. Clove Oil and Eugenol
4.1.4. Others
4.2. North America Bio Vanillin Market Outlook, by Application, Value (US$ Million), 2020-2033
4.2.1. Food & Beverages
4.2.2. Fragrances & Cosmetics
4.2.3. Pharmaceuticals
4.2.4. Others
4.3. North America Bio Vanillin Market Outlook, by Form, Value (US$ Million), 2020-2033
4.3.1. Powder
4.3.2. Liquid
4.4. North America Bio Vanillin Market Outlook, by Country, Value (US$ Million), 2020-2033
4.4.1. United States Bio Vanillin Market Outlook, by Source, 2020-2033
4.4.2. United States Bio Vanillin Market Outlook, by Application, 2020-2033
4.4.3. United States Bio Vanillin Market Outlook, by Form, 2020-2033
4.4.4. Canada Bio Vanillin Market Outlook, by Source, 2020-2033
4.4.5. Canada Bio Vanillin Market Outlook, by Application, 2020-2033
4.4.6. Canada Bio Vanillin Market Outlook, by Form, 2020-2033
5. Europe Bio Vanillin Market Outlook, 2020-2033
5.1. Europe Bio Vanillin Market Outlook, by Source, Value (US$ Million), 2020-2033
5.1.1. Microbial Fermentation
5.1.2. Lignin-Based
5.1.3. Clove Oil and Eugenol
5.1.4. Others
5.2. Europe Bio Vanillin Market Outlook, by Application, Value (US$ Million), 2020-2033
5.2.1. Food & Beverages
5.2.2. Fragrances & Cosmetics
5.2.3. Pharmaceuticals
5.2.4. Others
5.3. Europe Bio Vanillin Market Outlook, by Form, Value (US$ Million), 2020-2033
5.3.1. Powder
5.3.2. Liquid
5.4. Europe Bio Vanillin Market Outlook, by Country, Value (US$ Million), 2020-2033
5.4.1. France Bio Vanillin Market Outlook, by Source, 2020-2033
5.4.2. France Bio Vanillin Market Outlook, by Application, 2020-2033
5.4.3. France Bio Vanillin Market Outlook, by Form, 2020-2033
5.4.4. Germany Bio Vanillin Market Outlook, by Source, 2020-2033
5.4.5. Germany Bio Vanillin Market Outlook, by Application, 2020-2033
5.4.6. Germany Bio Vanillin Market Outlook, by Form, 2020-2033
5.4.7. Switzerland Bio Vanillin Market Outlook, by Source, 2020-2033
5.4.8. Switzerland Bio Vanillin Market Outlook, by Application, 2020-2033
5.4.9. Switzerland Bio Vanillin Market Outlook, by Form, 2020-2033
5.4.10. United Kingdom Bio Vanillin Market Outlook, by Source, 2020-2033
5.4.11. United Kingdom Bio Vanillin Market Outlook, by Application, 2020-2033
5.4.12. United Kingdom Bio Vanillin Market Outlook, by Form, 2020-2033
5.4.13. Norway Bio Vanillin Market Outlook, by Source, 2020-2033
5.4.14. Norway Bio Vanillin Market Outlook, by Application, 2020-2033
5.4.15. Norway Bio Vanillin Market Outlook, by Form, 2020-2033
6. Asia Pacific Bio Vanillin Market Outlook, 2020-2033
6.1. Asia Pacific Bio Vanillin Market Outlook, by Source, Value (US$ Million), 2020-2033
6.1.1. Microbial Fermentation
6.1.2. Lignin-Based
6.1.3. Clove Oil and Eugenol
6.1.4. Others
6.2. Asia Pacific Bio Vanillin Market Outlook, by Application, Value (US$ Million), 2020-2033
6.2.1. Food & Beverages
6.2.2. Fragrances & Cosmetics
6.2.3. Pharmaceuticals
6.2.4. Others
6.3. Asia Pacific Bio Vanillin Market Outlook, by Form, Value (US$ Million), 2020-2033
6.3.1. Powder
6.3.2. Liquid
6.4. Asia Pacific Bio Vanillin Market Outlook, by Country, Value (US$ Million), 2020-2033
6.4.1. China Bio Vanillin Market Outlook, by Source, 2020-2033
6.4.2. China Bio Vanillin Market Outlook, by Application, 2020-2033
6.4.3. China Bio Vanillin Market Outlook, by Form, 2020-2033
6.4.4. India Bio Vanillin Market Outlook, by Source, 2020-2033
6.4.5. India Bio Vanillin Market Outlook, by Application, 2020-2033
6.4.6. India Bio Vanillin Market Outlook, by Form, 2020-2033
6.4.7. Japan Bio Vanillin Market Outlook, by Source, 2020-2033
6.4.8. Japan Bio Vanillin Market Outlook, by Application, 2020-2033
6.4.9. Japan Bio Vanillin Market Outlook, by Form, 2020-2033
6.4.10. Indonesia Bio Vanillin Market Outlook, by Source, 2020-2033
6.4.11. Indonesia Bio Vanillin Market Outlook, by Application, 2020-2033
6.4.12. Indonesia Bio Vanillin Market Outlook, by Form, 2020-2033
6.4.13. Australia Bio Vanillin Market Outlook, by Source, 2020-2033
6.4.14. Australia Bio Vanillin Market Outlook, by Application, 2020-2033
6.4.15. Australia Bio Vanillin Market Outlook, by Form, 2020-2033
7. Latin America Bio Vanillin Market Outlook, 2020-2033
7.1. Latin America Bio Vanillin Market Outlook, by Source, Value (US$ Million), 2020-2033
7.1.1. Microbial Fermentation
7.1.2. Lignin-Based
7.1.3. Clove Oil and Eugenol
7.1.4. Others
7.2. Latin America Bio Vanillin Market Outlook, by Application, Value (US$ Million), 2020-2033
7.2.1. Food & Beverages
7.2.2. Fragrances & Cosmetics
7.2.3. Pharmaceuticals
7.2.4. Others
7.3. Latin America Bio Vanillin Market Outlook, by Form, Value (US$ Million), 2020-2033
7.3.1. Powder
7.3.2. Liquid
7.4. Latin America Bio Vanillin Market Outlook, by Country, Value (US$ Million), 2020-2033
7.4.1. Brazil Bio Vanillin Market Outlook, by Source, 2020-2033
7.4.2. Brazil Bio Vanillin Market Outlook, by Application, 2020-2033
7.4.3. Brazil Bio Vanillin Market Outlook, by Form, 2020-2033
7.4.4. Mexico Bio Vanillin Market Outlook, by Source, 2020-2033
7.4.5. Mexico Bio Vanillin Market Outlook, by Application, 2020-2033
7.4.6. Mexico Bio Vanillin Market Outlook, by Form, 2020-2033
7.4.7. Argentina Bio Vanillin Market Outlook, by Source, 2020-2033
7.4.8. Argentina Bio Vanillin Market Outlook, by Application, 2020-2033
7.4.9. Argentina Bio Vanillin Market Outlook, by Form, 2020-2033
7.4.10. Chile Bio Vanillin Market Outlook, by Source, 2020-2033
7.4.11. Chile Bio Vanillin Market Outlook, by Application, 2020-2033
7.4.12. Chile Bio Vanillin Market Outlook, by Form, 2020-2033
7.4.13. Colombia Bio Vanillin Market Outlook, by Source, 2020-2033
7.4.14. Colombia Bio Vanillin Market Outlook, by Application, 2020-2033
7.4.15. Colombia Bio Vanillin Market Outlook, by Form, 2020-2033
8. Middle East & Africa Bio Vanillin Market Outlook, 2020-2033
8.1. Middle East & Africa Bio Vanillin Market Outlook, by Source, Value (US$ Million), 2020-2033
8.1.1. Microbial Fermentation
8.1.2. Lignin-Based
8.1.3. Clove Oil and Eugenol
8.1.4. Others
8.2. Middle East & Africa Bio Vanillin Market Outlook, by Application, Value (US$ Million), 2020-2033
8.2.1. Food & Beverages
8.2.2. Fragrances & Cosmetics
8.2.3. Pharmaceuticals
8.2.4. Others
8.3. Middle East & Africa Bio Vanillin Market Outlook, by Form, Value (US$ Million), 2020-2033
8.3.1. Powder
8.3.2. Liquid
8.4. Middle East & Africa Bio Vanillin Market Outlook, by Country, Value (US$ Million), 2020-2033
8.4.1. Saudi Arabia Bio Vanillin Market Outlook, by Source, 2020-2033
8.4.2. Saudi Arabia Bio Vanillin Market Outlook, by Application, 2020-2033
8.4.3. Saudi Arabia Bio Vanillin Market Outlook, by Form, 2020-2033
8.4.4. United Arab Emirates Bio Vanillin Market Outlook, by Source, 2020-2033
8.4.5. United Arab Emirates Bio Vanillin Market Outlook, by Application, 2020-2033
8.4.6. United Arab Emirates Bio Vanillin Market Outlook, by Form, 2020-2033
8.4.7. Egypt Bio Vanillin Market Outlook, by Source, 2020-2033
8.4.8. Egypt Bio Vanillin Market Outlook, by Application, 2020-2033
8.4.9. Egypt Bio Vanillin Market Outlook, by Form, 2020-2033
8.4.10. South Africa Bio Vanillin Market Outlook, by Source, 2020-2033
8.4.11. South Africa Bio Vanillin Market Outlook, by Application, 2020-2033
8.4.12. South Africa Bio Vanillin Market Outlook, by Form, 2020-2033
8.4.13. Madagascar Bio Vanillin Market Outlook, by Source, 2020-2033
8.4.14. Madagascar Bio Vanillin Market Outlook, by Application, 2020-2033
8.4.15. Madagascar Bio Vanillin Market Outlook, by Form, 2020-2033
9. Competitive Landscape
9.1. Market Concentration and Industry Leaders
9.2. Competitive Differentiation
9.3. Strategic Moves and Market Direction
9.4. Recent Industry Developments
9.5. Company Profiles
9.5.1. Syensqo
9.5.2. Lallemand
9.5.3. Givaudan
9.5.4. Symrise
9.5.5. Borregaard
9.5.6. IFF
9.5.7. dsm-firmenich
9.5.8. ADM
9.5.9. Sensient Technologies
9.5.10. Döhler
9.5.11. Camlin Fine Sciences
9.5.12. Takasago
10. Appendix
10.1. Research Methodology
10.2. Report Assumptions
10.3. Acronyms and Abbreviations
| Source | Microbial Fermentation, Lignin-Based, Clove Oil and Eugenol, Others |
| Application | Food & Beverages, Fragrances & Cosmetics, Pharmaceuticals, Others |
| Form | Powder, Liquid |
| Regions | North America, Europe, Asia Pacific, Latin America, Middle East & Africa |
Our Research Methodology
Considering the volatility of business today, traditional approaches to strategizing a game plan can be unfruitful if not detrimental. True ambiguity is no way to determine a forecast. A myriad of predetermined factors must be accounted for such as the degree of risk involved, the magnitude of circumstances, as well as conditions or consequences that are not known or unpredictable. To circumvent binary views that cast uncertainty, the application of market research intelligence to strategically posture, move, and enable actionable outcomes is necessary.
View Methodology
Quality Assured
Rigorous Validation Process

Confidentiality Assured
End-to-end Data Security

Custom Research Services
Tailored To Your Objectives
FAQs
The bio vanillin market is valued at US$ 350.0 million in 2026, led by microbial fermentation and North America.
The market is projected to reach US$ 720.0 million by 2033, growing at a 10.9% CAGR and adding US$ 370.0 million.
Microbial fermentation is growing fastest at a 12.4% CAGR through 2033, driven by precision fermentation and scalable natural production.
Asia Pacific is growing fastest at a 14.2% CAGR through 2033, driven by packaged food growth and bakery demand in China and India.
North America holds the largest share at 35.0% in 2026, supported by strong clean-label demand and natural flavor labeling rules.
Related Reports
Weight Loss Supplement Market Size, Share, Insights, Competitive Landscape, and Forecast 2026 to 2033
Weight loss supplement market to grow from US$ 39.0 billion in 2026 to US$ 55.0 billion by 2033 at a 5.0% CAGR. Explore products, channels and regional trends.
Milk Ingredients Market Size, Share, Insights, Competitive Landscape, and Forecast 2026 to 2033
The milk ingredients market is projected to grow from US$68.4 billion in 2026 to US$101.2 billion by 2033, at a 5.8% CAGR. Explore segments and key trends.
A2 Milk Market Size, Share, Insights, Competitive Landscape, and Forecast 2026 to 2033
The global A2 milk market is valued at US$21.20 billion in 2026, reaching US$52.31 billion by 2033, growing at a 13.8% CAGR
Tilapia Market Size, Share, Insights, Competitive Landscape, and Forecast 2026 to 2033
The tilapia market is projected to grow from US$14.60 billion in 2026 to US$20.10 billion by 2033, at a 4.7% CAGR, driven by protein demand and aquaculture.
Quillaja Extract Market Size, Share, Insights, Competitive Landscape, and Forecast 2026 to 2033
The quillaja extract market is projected to grow from US$397.5 million in 2026 to US$712.7 million by 2033, at an 8.7% CAGR, led by food and vaccine uses.
Organic Tobacco Market Size, Share, Insights, Competitive Landscape, and Forecast 2026 to 2033
The organic tobacco market is projected to grow from US$143.8 million in 2026 to US$193.1 million by 2033, at a 4.3% CAGR, shaped by sourcing and regulation.