



Milk Ingredients Market
Milk Ingredients Market Size, Share, Insights, Competitive Landscape, and Forecast 2026 to 2033
Milk Ingredients Market Size and Trend Analysis
What Is the Growth Outlook for Milk Ingredients to 2033?
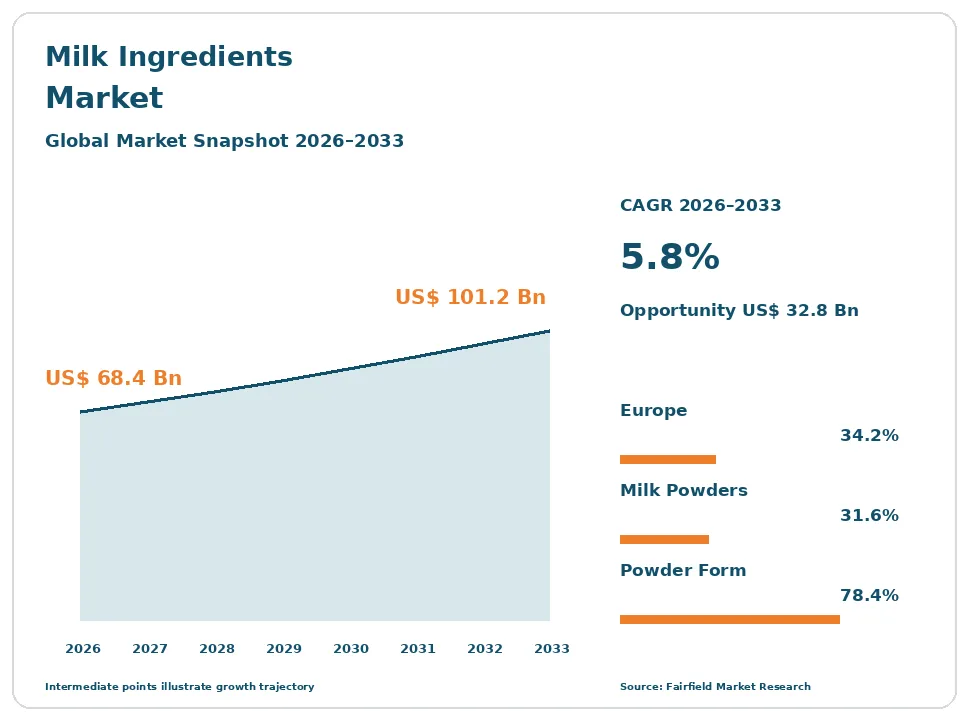
The global milk ingredients market size is expected to be valued at US$ 68.4 billion in 2026 and projected to reach US$ 101.2 billion by 2033, growing at a CAGR of 5.8% between 2026 and 2033.
Between 2020 and 2025 the market grew at about 4.3% a year, a pace set by raw milk availability rather than order books. Processors are moving volume out of commodity powder and into separated streams, because a litre split into fat, casein, whey, lactose and minerals earns more than the same litre dried whole. Infant and clinical nutrition buyers specify defined protein and mineral fractions, which carry higher conversion value per tonne and require qualified plants. Importing economies with limited local herds still buy powder and milk fat for recombining close to the consumer. The direction is value migration inside a slow-growing base: tonnage follows the milk pool, revenue follows how finely each litre is separated.
Key Report Takeaways
- By Product Type: Milk powders held 31.6% share in 2026, while colostrum and milk fat globule membrane fractions are projected to expand at a 9.6% CAGR through 2033, driven by compositional specifications written into premium infant formula recipes.
- By Application: Beverages and dairy applications held 24.6% share in 2026, while sports and active nutrition is projected to expand at an 8.1% CAGR through 2033, driven by protein content declarations on ready-to-drink and bar formats.
- By Form: Powder held 78.4% share in 2026, while liquid and concentrate formats are projected to grow at a 7.0% CAGR through 2033, driven by processors shipping chilled protein concentrate to nearby plants instead of drying it.
- By Nature: Conventional grades held 93.2% share in 2026, while organic milk ingredients are projected to advance at a 7.5% CAGR through 2033, driven by certified supply contracts behind European and North American retail brands.
- By Geography: Europe held 34.2% share in 2026, while Middle East & Africa is projected to post a 7.2% CAGR through 2033, driven by recombining plants in the Gulf and West Africa buying imported powder and milk fat.
Global Milk Ingredients Market Trends and Insights
Drivers Impact Analysis
| Driver | Impact on CAGR Forecast | Geographic Relevance | Impact Timeline |
| Component fractionation economics redirecting milk solids to higher-value streams | High | Europe, Asia Pacific, North America | Long term (≥4 years) |
| Tightly specified infant and clinical nutrition grades | High | Asia Pacific, Europe, Middle East & Africa | Medium term (2–4 years) |
Two forces explain most of the value added to dairy ingredient sales through 2033.
Component Fractionation Economics Redirect Milk Solids Into Higher-Value Ingredient Streams
The economics of separation, not end-market demand, decides what a dairy processor makes in a given week. A plant able to route cream to anhydrous milk fat, casein to micellar concentrate, serum to protein powder and the balance to lactose and permeate captures far more value per litre than one drying whole milk. That routing is a portfolio optimisation against relative component prices, which is why capital keeps moving toward sites with several possible outputs from one intake.
The mechanism shows up in processing investment. Membrane filtration and chromatographic separation now sit upstream of drying in most new builds, letting operators change mix within a season as butterfat and protein values diverge. When milk fat prices run ahead, volume shifts toward butter oil and cream powder; when protein leads, the same plant reverses. Codex compositional standards for milk powders and edible caseins make each output tradable without renegotiating specifications.
Tightly Specified Infant and Clinical Nutrition Grades Lift Milk Ingredient Conversion Value
Infant and clinical nutrition is the most demanding outlet a dairy processor can serve, and it pulls the whole ingredient portfolio upward. Buyers in this channel do not purchase generic powder. They purchase a declared protein profile, a stated lactose content, defined mineral levels and a documented production history, and they pay a premium for fractions that meet those written specifications consistently across every shipment.
The cause is regulatory rather than commercial. European rules on infant formula and follow-on formula fix compositional and labelling requirements in law, and the US Food and Drug Administration imposes its own infant formula requirements together with manufacturer registration and notification duties. Meeting them obliges suppliers to run dedicated lines, validated cleaning regimes and contaminant and veterinary residue testing against Codex and European limits. That burden converts an ordinary dairy stream into a qualified, audited grade.
Restraints Impact Analysis
| Restraint | Impact on CAGR Forecast | Geographic Relevance | Impact Timeline |
| Slow raw milk pool growth and environmental limits on herd expansion | High | Europe, Asia Pacific, North America | Long term (≥4 years) |
| Commodity price volatility and energy-intensive drying cost | Medium | Global | Short term (≤2 years) |
Two structural limits sit on both volume and margin across dairy ingredient production.
Slow Milk Pool Growth and Nitrogen Rules Cap Milk Ingredients Output
Raw milk supply is the hard ceiling on this industry, and it is growing slowly in the regions that supply most traded dairy ingredients. Milk output is biologically and seasonally constrained: yield per cow improves gradually, herds take years to build, and collection peaks and troughs within a year regardless of order patterns. A processor cannot answer a strong protein market by simply buying more milk, because the pool in its catchment is close to fully contracted.
The binding cause is increasingly environmental. Nitrates, ammonia and water quality rules in several major producing countries cap stocking density and manure application, which caps herd size directly. The European Commission has tightened derogations for intensively farmed areas, and comparable nutrient rules apply in other exporting regions. Land availability, labour scarcity on farms and generational succession add further friction, so additional ingredient volume must come from better separation rather than more litres.
Dairy Commodity Volatility and Drying Energy Cost Squeeze Milk Ingredients Margins
Price volatility makes this an unusually difficult market for buyers and sellers to plan around. World trade in milk powders, butterfat and proteins clears through a small number of exporting regions, so a drought, a feed cost spike or a single large import tender can move reference prices sharply within a quarter. Food manufacturers struggle to forward contract at workable prices, and processors see contract margins disappear between pricing and delivery.
Two cost sources sit underneath. Drying is energy-intensive by physics: removing water from milk concentrate to a stable powder consumes substantial thermal energy per tonne, so gas and electricity prices feed straight into conversion cost. Separately, tariff and trade exposure is real, because a few exporting regions supply much of world trade and buyers face import duties, quota administration and export certification. Both effects reward scale and penalise smaller, single-product dryers.
Market Opportunities
Lactose and Permeate Valorisation Turns a Disposal Problem Into a Milk Ingredients Revenue Pool
Lactose, permeate and dairy minerals are the clearest untapped revenue pool in dairy processing, because these streams were long treated as low-value by-products or spread on land. Refining them into pharmaceutical and food grade lactose, standardised permeate powders and galacto-oligosaccharides converts a disposal cost into a saleable line. The same separation train that produces protein concentrate already generates the feedstock, so incremental capital buys incremental revenue.
Buyers are specific. Infant formula manufacturers require lactose of defined purity, inhaled and oral drug formulators buy carrier-grade lactose against pharmacopoeial specifications, and confectionery and bakery customers use permeate powder as a standardising solid. Mineral-rich streams find outlets in dairy standardisation and feed. Codex standards and European hygiene rules for food of animal origin give these refined streams the documentary status they need to move internationally.
High-Protein Formats and Importing-Region Recombining Open Premium Milk Protein Pools
Two distinct pools are opening at once for milk protein suppliers. High-protein beverages, bars and powdered formats need proteins that survive heat treatment and stay drinkable at high solids, which favours milk protein isolate and micellar casein over commodity powder. Separately, importing economies with limited local milk are building recombining and filling capacity, and they buy skimmed milk powder, anhydrous milk fat and protein concentrate as inputs rather than finished dairy products.
Capture favours suppliers with application laboratories and reliable qualified grades. Beverage manufacturers, contract fillers and regional dairy groups in the Gulf, West Africa and growing Asian markets create the demand, and their formulations are set by labelling rules on protein declaration rather than by bulk price alone. Suppliers holding export certification and consistent fraction specifications across shipments are positioned to serve both pools from the same plant.
Segment Analysis
By Product Type: Milk Powders Hold the Base While Colostrum and Membrane Fractions Scale Fastest
Milk powders led the product mix with 31.6% share in 2026, because skimmed and whole milk powder remain the default tradable form of surplus milk solids and the input for most recombining operations. Milk protein concentrate and isolate followed at 16.4%, caseins, caseinates and micellar casein took 14.8%, and milk fat products including butter oil, anhydrous milk fat and cream powder held 13.9%. Whey proteins and whey powders accounted for 11.2%, lactose and lactose derivatives including galacto-oligosaccharides 7.3%, and milk permeate and dairy minerals 3.4%.
Colostrum and milk fat globule membrane fractions grow fastest at a 9.6% CAGR through 2033, from a 1.4% base. These are low-yield fractions recovered from streams once blended away, and their value rests on compositional specification rather than tonnage. The implication is that product mix, not milk intake, now sets a processor’s revenue ceiling.
By Application: Beverages and Dairy Lead as Sports and Active Nutrition Accelerates
Beverages and dairy applications absorbed 24.6% of ingredient volume in 2026, the largest single outlet, because recombined milk, drinking yoghurt, cheese standardisation and coffee formats all draw powder, protein and milk fat from the same suppliers. Infant and clinical nutrition followed at 21.4%, the most tightly regulated end use and the highest value per tonne. Bakery and confectionery held 18.2%, where milk powder and milk fat perform a functional role in dough, chocolate and fillings, with savoury and prepared foods at 11.4%, ice cream at 9.0% and animal feed at 6.9%.
Sports and active nutrition, at 8.5% share, grows fastest at an 8.1% CAGR through 2033. Ready-to-drink and bar formats declare protein content on pack, and micellar casein and milk protein isolate deliver that declaration with workable viscosity. Technical service shifts toward heat stability and sensory work.
By Form: Powder Dominates Trade While Liquid and Concentrate Formats Gain Locally
Powder held 78.4% share in 2026, an unmatched position, because drying is what makes milk solids storable, shippable and tradable across seasons and borders. A powder tolerates months of warehousing and weeks at sea, which a chilled dairy concentrate cannot. Granulated and instantised formats took 7.6%, used where rapid dispersion matters in recombining and beverage plants, and paste and block formats for bulk milk fat accounted for 2.8%.
Liquid and concentrate formats hold 11.2% share and grow fastest at a 7.0% CAGR through 2033. The logic is energy and proximity: when the receiving plant sits within a short haul, shipping chilled ultrafiltration retentate avoids the thermal cost of drying and the quality loss of rehydration. Regional clusters of cheese, yoghurt and beverage manufacturing make this viable, so form choice increasingly reflects plant geography rather than product preference.
By Nature: Conventional Volume Anchors the Market While Organic Grades Advance Quicker
Conventional grades represented 93.2% of dairy ingredient value in 2026, a dominance rooted in supply economics. Conventional milk is collected from the largest herds at the lowest cost per litre, and almost all large-scale drying, fractionation and casein capacity is built around it. Buyers in bakery, confectionery, feed and standardised dairy work to tight cost targets that certified milk cannot usually meet, so conventional supply carries the industrial base of the market.
Organic milk ingredients hold 6.8% share and expand at a 7.5% CAGR through 2033, the faster of the two. Growth is contractual rather than spontaneous: retail brands and nutrition manufacturers commit to certified volumes in advance, because organic milk pools are small and conversion takes years. Certification under European organic rules and the United States Department of Agriculture organic programme governs feed, grazing and veterinary practice, and segregated collection and drying runs add cost that only premium end products absorb.
Geography Analysis
North America Converts a Large Milk Pool Into Protein and Lactose Streams
North America held 21.0% share in 2026 and grows at 5.3% a year to 2033. The United States supplies most of the output, with Canada operating under supply management and Mexico a substantial importer. Processing capacity has expanded around milk protein concentrate, casein and lactose, supported by an abundant and relatively low-cost milk pool in the western and plains states.
Regulation shapes the operating model. The Grade A Pasteurized Milk Ordinance governs sanitary standards for milk entering interstate commerce, and export certification requirements determine which plants can serve overseas customers. Infant formula producers work to US Food and Drug Administration requirements and registration duties. The main barrier is a slow-growing herd and labour scarcity on farms. The clearest opportunity is lactose and permeate refining, where available feedstock currently exceeds installed refining capacity.
Which Region Is Leading the Milk Ingredients Market?
Europe is leading the milk ingredients market, with 34.2% share in 2026 and a 5.0% CAGR to 2033. Germany, France, the Netherlands, Ireland, Denmark and Poland account for most output, organised around farmer co-operatives that collect milk and own the drying and fractionation assets downstream. That ownership structure is why the region fractionates more finely than anywhere else: the co-operative must find a home for every component of the milk it is obliged to collect.
Rules are unusually dense here. Hygiene requirements for food of animal origin, dairy denomination protections reserving terms such as milk and butter, contaminant and veterinary residue limits, and geographical indication and labelling rules all apply together. Nitrogen and water quality limits now cap herd expansion in the most intensive areas. The opportunity lies in qualified infant and clinical nutrition grades, where regulatory capability is itself the barrier to entry.
Asia Pacific Combines the Largest Import Demand With Major Export Capacity
Asia Pacific accounted for 30.5% of global dairy ingredient demand in 2026 and grows at 6.6% through 2033. The region holds both sides of the trade. New Zealand and Australia, the principal dairy exporters of the wider Oceania grouping, are counted here and ship large volumes of powder, milk fat and protein. China, Japan, Korea, Indonesia, Vietnam and India consume them, with India additionally operating the world’s largest domestic milk pool through its co-operative network.
Demand is driven by infant formula manufacturing, recombined milk, bakery and confectionery, and the spread of chilled dairy formats in urban areas. Import regulation is the swing factor: registration of overseas manufacturing facilities, compositional rules for formula and periodic tariff changes materially affect trade flows. The change underway is local fractionation capacity being built in importing countries to reduce dependence on finished imported powder.
Latin America Builds Export Position From a Growing Southern Milk Pool
Latin America represented 8.0% share in 2026 and grows at 5.9% to 2033. Brazil, Argentina, Uruguay, Chile and Colombia carry most activity, with Argentina and Uruguay exporting powder and milk fat while Brazil consumes most of what it produces. Pasture-based systems in the southern cone give a competitive cost per litre when weather and macroeconomic conditions cooperate.
Barriers are mainly financial and institutional. Currency volatility, export taxes and inflation make long-term supply contracts difficult to price, and inconsistent cold chain and collection infrastructure limits the milk that reaches a qualified plant. Laboratory and certification capacity for high-grade fractions is thin outside the largest processors. The opportunity is straightforward: with export certification and investment in membrane capacity, the region can move from selling commodity powder toward selling specified protein and milk fat fractions.
Which Region Is Growing Fastest in the Milk Ingredients Market?
Middle East & Africa is growing fastest in the milk ingredients market, at a 7.2% CAGR through 2033 from 6.3% share in 2026, the smallest base of the five regions. Saudi Arabia, the United Arab Emirates, Egypt, Algeria, Nigeria and South Africa drive most of the increase. Local milk production is limited by climate, water and feed cost, so recombining plants import skimmed milk powder and anhydrous milk fat and reconstitute them into liquid milk, yoghurt, cheese and beverages close to the consumer.
Population growth and urbanisation convert directly into packaged dairy demand, which converts into ingredient imports. Barriers are significant: foreign exchange availability, tariff and subsidy changes, and fragmented cold chains all constrain buyers. The change shaping the region is investment in filling and recombining capacity, which anchors long-term contracted demand for imported dairy ingredients rather than finished product.
Competitive Landscape
The milk ingredients market is moderately concentrated. A limited group of co-operatives and dairy groups in Europe, Oceania and North America controls most of the world’s fractionation and drying capacity, because the assets are capital-intensive and must sit beside a secured milk pool. Yet concentration is uneven by product: commodity milk powder is widely produced and keenly contested, while qualified infant nutrition grades, micellar casein and pharmaceutical lactose come from a much shorter list of plants. Co-operative ownership complicates consolidation, since the supplying farmers are also the shareholders, so the sector has grown more through joint ventures and asset swaps than through outright takeovers.
Competition runs on four things. Secured raw milk access comes first, because no ingredient strategy survives without litres. Fractionation breadth comes second: a producer able to sell every stream from one intake can price any single stream more aggressively than a single-product dryer. Regulatory and quality capability is a genuine differentiator, covering hygiene approvals, export health certification, residue and contaminant testing, plant registration in importing countries and audit readiness for infant formula customers. Application and technical service completes the set, since customers buy a working formulation rather than a specification sheet.
Strategic activity concentrates on moving mix away from commodity powder. Processors are adding membrane and chromatographic capacity, qualifying additional lines for infant and clinical nutrition, and investing in lactose and permeate refining to capture streams previously sold cheaply. Several have built ingredient divisions with their own sales channels, separate from the liquid dairy business, and precision-fermented dairy proteins are being examined as a complementary input rather than a replacement.
The broad direction is clear. Producers are trying to convert a biologically capped milk supply into a portfolio of qualified, specified fractions whose margins depend on documentation and consistency rather than on tonnage.
Milk Ingredients Industry Leaders
- Fonterra Co-operative Group Limited
- Royal FrieslandCampina N.V.
- Arla Foods amba
- Groupe Lactalis
- Kerry Group plc
Recent Industry Developments
- April 2015: The European Union milk quota system expired, ending the production ceilings that had governed member state output for three decades – collection and drying capacity expanded quickly in Ireland, the Netherlands and Denmark, permanently raising European dairy ingredient export volumes.
- February 2020: European delegated rules on infant formula and follow-on formula became applicable, tightening compositional and labelling requirements – they fixed the specifications that protein, lactose and mineral fractions must meet, making formula the most demanding grade a dairy processor can supply.
- January 2021: The trade agreement between the European Union and the United Kingdom took effect, introducing export health certification and customs formalities on dairy consignments crossing the new border – it added documentation cost and lead time to a previously frictionless ingredient trade flow.
- September 2022: The European Commission agreed a final nitrates derogation for the Netherlands, to be phased out over the following years – it confirmed that environmental limits rather than demand will govern milk pool growth in Europe’s most intensive dairy regions.
Companies Covered in the Report
- Fonterra Co-operative Group Limited
- Royal FrieslandCampina N.V.
- Arla Foods amba
- Groupe Lactalis
- Glanbia plc
- Kerry Group plc
- Saputo Inc.
- Dairy Farmers of America, Inc.
- Agropur Cooperative
- Valio Ltd.
- Sodiaal Union
- Meggle GmbH & Co. KG
- Milk Specialties Global
- Idaho Milk Products, Inc.
Milk Ingredients Market Report Scope
This report covers dairy-derived ingredients sold into food, beverage and nutrition manufacturing: milk powders, milk protein concentrates and isolates, caseins, milk fat products, lactose derivatives, permeate, colostrum and membrane fractions. Whey proteins appear as a named segment only and are examined in a separate report. Fluid milk and finished retail dairy products are not counted. The base year is 2025, the forecast period 2026 to 2033, in US$ Billion.
Product Type
- Skimmed and Whole Milk Powder
- Milk Protein Concentrate and Isolate
- Casein, Caseinates and Micellar Casein
- Milk Fat Products (Butter Oil, Anhydrous Milk Fat, Cream Powder)
- Lactose and Lactose Derivatives (including Galacto-oligosaccharides)
- Milk Permeate and Dairy Minerals
- Colostrum and Milk Fat Globule Membrane Fractions
- Whey Proteins and Whey Powders
Application
- Infant and Clinical Nutrition
- Bakery and Confectionery
- Beverages and Dairy Applications
- Sports and Active Nutrition
- Savoury and Prepared Foods
- Ice Cream
- Animal Feed
Form
- Powder
- Liquid and Concentrate
- Granulated and Instantised
- Paste and Block
Nature
- Conventional
- Organic
Regions
- North America
- Europe
- Asia Pacific
- Latin America
- Middle East & Africa
Key Questions Answered in the Report
How big is the milk ingredients market in 2026?
The global milk ingredients market is valued at US$ 68.4 billion in 2026, covering dairy-derived ingredients sold into food, beverage and nutrition manufacturing worldwide.
What is the forecast size and CAGR of the milk ingredients market by 2033?
The market is projected to reach US$ 101.2 billion by 2033, growing at a 5.8% CAGR and adding an absolute opportunity of US$ 32.8 billion.
Which product type leads the milk ingredients market?
Milk powders lead with 31.6% share in 2026, because skimmed and whole milk powder remain the default tradable form of surplus milk solids.
Which segment and region are growing fastest in the milk ingredients market?
Colostrum and milk fat globule membrane fractions grow fastest at 9.6%, and Middle East & Africa is the quickest region at a 7.2% CAGR.
Which region holds the largest milk ingredients market share?
Europe holds the largest share at 34.2% in 2026, supported by its export-oriented processing base, co-operative milk pools and dense fractionation capacity.
1. Executive Summary
1.1. Global Milk Ingredients Market Snapshot
1.2. Future Projections
1.3. Key Report Takeaways
1.4. Regional Snapshot
2. Market Overview
2.1. Market Definition and Report Scope
2.2. Historical Trends 2020–2025
2.3. Market Dynamics
2.3.1. Drivers
2.3.1.1. Component Fractionation Economics Redirect Milk Solids Into Higher-Value Ingredient Streams
2.3.1.2. Tightly Specified Infant and Clinical Nutrition Grades Lift Milk Ingredient Conversion Value
2.3.2. Restraints
2.3.2.1. Slow Milk Pool Growth and Nitrogen Rules Cap Milk Ingredients Output
2.3.2.2. Dairy Commodity Volatility and Drying Energy Cost Squeeze Milk Ingredients Margins
2.3.3. Market Opportunities
2.3.3.1. Lactose and Permeate Valorisation Turns a Disposal Problem Into a Milk Ingredients Revenue Pool
2.3.3.2. High-Protein Formats and Importing-Region Recombining Open Premium Milk Protein Pools
3. Global Milk Ingredients Market Outlook, 2020–2033
3.1. Global Milk Ingredients Market Outlook, by Product Type, Value (US$ Billion), 2020–2033
3.1.1. Skimmed and Whole Milk Powder
3.1.2. Milk Protein Concentrate and Isolate
3.1.3. Casein, Caseinates and Micellar Casein
3.1.4. Milk Fat Products (Butter Oil, Anhydrous Milk Fat, Cream Powder)
3.1.5. Lactose and Lactose Derivatives (including Galacto-oligosaccharides)
3.1.6. Milk Permeate and Dairy Minerals
3.1.7. Colostrum and Milk Fat Globule Membrane Fractions
3.1.8. Whey Proteins and Whey Powders
3.2. Global Milk Ingredients Market Outlook, by Application, Value (US$ Billion), 2020–2033
3.2.1. Infant and Clinical Nutrition
3.2.2. Bakery and Confectionery
3.2.3. Beverages and Dairy Applications
3.2.4. Sports and Active Nutrition
3.2.5. Savoury and Prepared Foods
3.2.6. Ice Cream
3.2.7. Animal Feed
3.3. Global Milk Ingredients Market Outlook, by Form, Value (US$ Billion), 2020–2033
3.3.1. Powder
3.3.2. Liquid and Concentrate
3.3.3. Granulated and Instantised
3.3.4. Paste and Block
3.4. Global Milk Ingredients Market Outlook, by Nature, Value (US$ Billion), 2020–2033
3.4.1. Conventional
3.4.2. Organic
3.5. Global Milk Ingredients Market Outlook, by Region, Value (US$ Billion), 2020–2033
3.5.1. North America
3.5.2. Europe
3.5.3. Asia Pacific
3.5.4. Latin America
3.5.5. Middle East & Africa
4. North America Milk Ingredients Market Outlook, 2020–2033
4.1. North America Milk Ingredients Market Outlook, by Product Type, Value (US$ Billion), 2020–2033
4.1.1. Skimmed and Whole Milk Powder
4.1.2. Milk Protein Concentrate and Isolate
4.1.3. Casein, Caseinates and Micellar Casein
4.1.4. Milk Fat Products (Butter Oil, Anhydrous Milk Fat, Cream Powder)
4.1.5. Lactose and Lactose Derivatives (including Galacto-oligosaccharides)
4.1.6. Milk Permeate and Dairy Minerals
4.1.7. Colostrum and Milk Fat Globule Membrane Fractions
4.1.8. Whey Proteins and Whey Powders
4.2. North America Milk Ingredients Market Outlook, by Application, Value (US$ Billion), 2020–2033
4.2.1. Infant and Clinical Nutrition
4.2.2. Bakery and Confectionery
4.2.3. Beverages and Dairy Applications
4.2.4. Sports and Active Nutrition
4.2.5. Savoury and Prepared Foods
4.2.6. Ice Cream
4.2.7. Animal Feed
4.3. North America Milk Ingredients Market Outlook, by Form, Value (US$ Billion), 2020–2033
4.3.1. Powder
4.3.2. Liquid and Concentrate
4.3.3. Granulated and Instantised
4.3.4. Paste and Block
4.4. North America Milk Ingredients Market Outlook, by Nature, Value (US$ Billion), 2020–2033
4.4.1. Conventional
4.4.2. Organic
4.5. North America Milk Ingredients Market Outlook, by Country, Value (US$ Billion), 2020–2033
4.5.1. United States Milk Ingredients Market Outlook, by Product Type, 2020–2033
4.5.2. United States Milk Ingredients Market Outlook, by Application, 2020–2033
4.5.3. United States Milk Ingredients Market Outlook, by Form, 2020–2033
4.5.4. United States Milk Ingredients Market Outlook, by Nature, 2020–2033
4.5.5. Canada Milk Ingredients Market Outlook, by Product Type, 2020–2033
4.5.6. Canada Milk Ingredients Market Outlook, by Application, 2020–2033
4.5.7. Canada Milk Ingredients Market Outlook, by Form, 2020–2033
4.5.8. Canada Milk Ingredients Market Outlook, by Nature, 2020–2033
4.5.9. Mexico Milk Ingredients Market Outlook, by Product Type, 2020–2033
4.5.10. Mexico Milk Ingredients Market Outlook, by Application, 2020–2033
4.5.11. Mexico Milk Ingredients Market Outlook, by Form, 2020–2033
4.5.12. Mexico Milk Ingredients Market Outlook, by Nature, 2020–2033
5. Europe Milk Ingredients Market Outlook, 2020–2033
5.1. Europe Milk Ingredients Market Outlook, by Product Type, Value (US$ Billion), 2020–2033
5.1.1. Skimmed and Whole Milk Powder
5.1.2. Milk Protein Concentrate and Isolate
5.1.3. Casein, Caseinates and Micellar Casein
5.1.4. Milk Fat Products (Butter Oil, Anhydrous Milk Fat, Cream Powder)
5.1.5. Lactose and Lactose Derivatives (including Galacto-oligosaccharides)
5.1.6. Milk Permeate and Dairy Minerals
5.1.7. Colostrum and Milk Fat Globule Membrane Fractions
5.1.8. Whey Proteins and Whey Powders
5.2. Europe Milk Ingredients Market Outlook, by Application, Value (US$ Billion), 2020–2033
5.2.1. Infant and Clinical Nutrition
5.2.2. Bakery and Confectionery
5.2.3. Beverages and Dairy Applications
5.2.4. Sports and Active Nutrition
5.2.5. Savoury and Prepared Foods
5.2.6. Ice Cream
5.2.7. Animal Feed
5.3. Europe Milk Ingredients Market Outlook, by Form, Value (US$ Billion), 2020–2033
5.3.1. Powder
5.3.2. Liquid and Concentrate
5.3.3. Granulated and Instantised
5.3.4. Paste and Block
5.4. Europe Milk Ingredients Market Outlook, by Nature, Value (US$ Billion), 2020–2033
5.4.1. Conventional
5.4.2. Organic
5.5. Europe Milk Ingredients Market Outlook, by Country, Value (US$ Billion), 2020–2033
5.5.1. Germany Milk Ingredients Market Outlook, by Product Type, 2020–2033
5.5.2. Germany Milk Ingredients Market Outlook, by Application, 2020–2033
5.5.3. Germany Milk Ingredients Market Outlook, by Form, 2020–2033
5.5.4. Germany Milk Ingredients Market Outlook, by Nature, 2020–2033
5.5.5. France Milk Ingredients Market Outlook, by Product Type, 2020–2033
5.5.6. France Milk Ingredients Market Outlook, by Application, 2020–2033
5.5.7. France Milk Ingredients Market Outlook, by Form, 2020–2033
5.5.8. France Milk Ingredients Market Outlook, by Nature, 2020–2033
5.5.9. Netherlands Milk Ingredients Market Outlook, by Product Type, 2020–2033
5.5.10. Netherlands Milk Ingredients Market Outlook, by Application, 2020–2033
5.5.11. Netherlands Milk Ingredients Market Outlook, by Form, 2020–2033
5.5.12. Netherlands Milk Ingredients Market Outlook, by Nature, 2020–2033
5.5.13. Ireland Milk Ingredients Market Outlook, by Product Type, 2020–2033
5.5.14. Ireland Milk Ingredients Market Outlook, by Application, 2020–2033
5.5.15. Ireland Milk Ingredients Market Outlook, by Form, 2020–2033
5.5.16. Ireland Milk Ingredients Market Outlook, by Nature, 2020–2033
5.5.17. Denmark Milk Ingredients Market Outlook, by Product Type, 2020–2033
5.5.18. Denmark Milk Ingredients Market Outlook, by Application, 2020–2033
5.5.19. Denmark Milk Ingredients Market Outlook, by Form, 2020–2033
5.5.20. Denmark Milk Ingredients Market Outlook, by Nature, 2020–2033
5.5.21. Poland Milk Ingredients Market Outlook, by Product Type, 2020–2033
5.5.22. Poland Milk Ingredients Market Outlook, by Application, 2020–2033
5.5.23. Poland Milk Ingredients Market Outlook, by Form, 2020–2033
5.5.24. Poland Milk Ingredients Market Outlook, by Nature, 2020–2033
6. Asia Pacific Milk Ingredients Market Outlook, 2020–2033
6.1. Asia Pacific Milk Ingredients Market Outlook, by Product Type, Value (US$ Billion), 2020–2033
6.1.1. Skimmed and Whole Milk Powder
6.1.2. Milk Protein Concentrate and Isolate
6.1.3. Casein, Caseinates and Micellar Casein
6.1.4. Milk Fat Products (Butter Oil, Anhydrous Milk Fat, Cream Powder)
6.1.5. Lactose and Lactose Derivatives (including Galacto-oligosaccharides)
6.1.6. Milk Permeate and Dairy Minerals
6.1.7. Colostrum and Milk Fat Globule Membrane Fractions
6.1.8. Whey Proteins and Whey Powders
6.2. Asia Pacific Milk Ingredients Market Outlook, by Application, Value (US$ Billion), 2020–2033
6.2.1. Infant and Clinical Nutrition
6.2.2. Bakery and Confectionery
6.2.3. Beverages and Dairy Applications
6.2.4. Sports and Active Nutrition
6.2.5. Savoury and Prepared Foods
6.2.6. Ice Cream
6.2.7. Animal Feed
6.3. Asia Pacific Milk Ingredients Market Outlook, by Form, Value (US$ Billion), 2020–2033
6.3.1. Powder
6.3.2. Liquid and Concentrate
6.3.3. Granulated and Instantised
6.3.4. Paste and Block
6.4. Asia Pacific Milk Ingredients Market Outlook, by Nature, Value (US$ Billion), 2020–2033
6.4.1. Conventional
6.4.2. Organic
6.5. Asia Pacific Milk Ingredients Market Outlook, by Country, Value (US$ Billion), 2020–2033
6.5.1. New Zealand Milk Ingredients Market Outlook, by Product Type, 2020–2033
6.5.2. New Zealand Milk Ingredients Market Outlook, by Application, 2020–2033
6.5.3. New Zealand Milk Ingredients Market Outlook, by Form, 2020–2033
6.5.4. New Zealand Milk Ingredients Market Outlook, by Nature, 2020–2033
6.5.5. Australia Milk Ingredients Market Outlook, by Product Type, 2020–2033
6.5.6. Australia Milk Ingredients Market Outlook, by Application, 2020–2033
6.5.7. Australia Milk Ingredients Market Outlook, by Form, 2020–2033
6.5.8. Australia Milk Ingredients Market Outlook, by Nature, 2020–2033
6.5.9. China Milk Ingredients Market Outlook, by Product Type, 2020–2033
6.5.10. China Milk Ingredients Market Outlook, by Application, 2020–2033
6.5.11. China Milk Ingredients Market Outlook, by Form, 2020–2033
6.5.12. China Milk Ingredients Market Outlook, by Nature, 2020–2033
6.5.13. Japan Milk Ingredients Market Outlook, by Product Type, 2020–2033
6.5.14. Japan Milk Ingredients Market Outlook, by Application, 2020–2033
6.5.15. Japan Milk Ingredients Market Outlook, by Form, 2020–2033
6.5.16. Japan Milk Ingredients Market Outlook, by Nature, 2020–2033
6.5.17. Korea Milk Ingredients Market Outlook, by Product Type, 2020–2033
6.5.18. Korea Milk Ingredients Market Outlook, by Application, 2020–2033
6.5.19. Korea Milk Ingredients Market Outlook, by Form, 2020–2033
6.5.20. Korea Milk Ingredients Market Outlook, by Nature, 2020–2033
6.5.21. Indonesia Milk Ingredients Market Outlook, by Product Type, 2020–2033
6.5.22. Indonesia Milk Ingredients Market Outlook, by Application, 2020–2033
6.5.23. Indonesia Milk Ingredients Market Outlook, by Form, 2020–2033
6.5.24. Indonesia Milk Ingredients Market Outlook, by Nature, 2020–2033
6.5.25. Vietnam Milk Ingredients Market Outlook, by Product Type, 2020–2033
6.5.26. Vietnam Milk Ingredients Market Outlook, by Application, 2020–2033
6.5.27. Vietnam Milk Ingredients Market Outlook, by Form, 2020–2033
6.5.28. Vietnam Milk Ingredients Market Outlook, by Nature, 2020–2033
6.5.29. India Milk Ingredients Market Outlook, by Product Type, 2020–2033
6.5.30. India Milk Ingredients Market Outlook, by Application, 2020–2033
6.5.31. India Milk Ingredients Market Outlook, by Form, 2020–2033
6.5.32. India Milk Ingredients Market Outlook, by Nature, 2020–2033
7. Latin America Milk Ingredients Market Outlook, 2020–2033
7.1. Latin America Milk Ingredients Market Outlook, by Product Type, Value (US$ Billion), 2020–2033
7.1.1. Skimmed and Whole Milk Powder
7.1.2. Milk Protein Concentrate and Isolate
7.1.3. Casein, Caseinates and Micellar Casein
7.1.4. Milk Fat Products (Butter Oil, Anhydrous Milk Fat, Cream Powder)
7.1.5. Lactose and Lactose Derivatives (including Galacto-oligosaccharides)
7.1.6. Milk Permeate and Dairy Minerals
7.1.7. Colostrum and Milk Fat Globule Membrane Fractions
7.1.8. Whey Proteins and Whey Powders
7.2. Latin America Milk Ingredients Market Outlook, by Application, Value (US$ Billion), 2020–2033
7.2.1. Infant and Clinical Nutrition
7.2.2. Bakery and Confectionery
7.2.3. Beverages and Dairy Applications
7.2.4. Sports and Active Nutrition
7.2.5. Savoury and Prepared Foods
7.2.6. Ice Cream
7.2.7. Animal Feed
7.3. Latin America Milk Ingredients Market Outlook, by Form, Value (US$ Billion), 2020–2033
7.3.1. Powder
7.3.2. Liquid and Concentrate
7.3.3. Granulated and Instantised
7.3.4. Paste and Block
7.4. Latin America Milk Ingredients Market Outlook, by Nature, Value (US$ Billion), 2020–2033
7.4.1. Conventional
7.4.2. Organic
7.5. Latin America Milk Ingredients Market Outlook, by Country, Value (US$ Billion), 2020–2033
7.5.1. Brazil Milk Ingredients Market Outlook, by Product Type, 2020–2033
7.5.2. Brazil Milk Ingredients Market Outlook, by Application, 2020–2033
7.5.3. Brazil Milk Ingredients Market Outlook, by Form, 2020–2033
7.5.4. Brazil Milk Ingredients Market Outlook, by Nature, 2020–2033
7.5.5. Argentina Milk Ingredients Market Outlook, by Product Type, 2020–2033
7.5.6. Argentina Milk Ingredients Market Outlook, by Application, 2020–2033
7.5.7. Argentina Milk Ingredients Market Outlook, by Form, 2020–2033
7.5.8. Argentina Milk Ingredients Market Outlook, by Nature, 2020–2033
7.5.9. Uruguay Milk Ingredients Market Outlook, by Product Type, 2020–2033
7.5.10. Uruguay Milk Ingredients Market Outlook, by Application, 2020–2033
7.5.11. Uruguay Milk Ingredients Market Outlook, by Form, 2020–2033
7.5.12. Uruguay Milk Ingredients Market Outlook, by Nature, 2020–2033
7.5.13. Chile Milk Ingredients Market Outlook, by Product Type, 2020–2033
7.5.14. Chile Milk Ingredients Market Outlook, by Application, 2020–2033
7.5.15. Chile Milk Ingredients Market Outlook, by Form, 2020–2033
7.5.16. Chile Milk Ingredients Market Outlook, by Nature, 2020–2033
7.5.17. Colombia Milk Ingredients Market Outlook, by Product Type, 2020–2033
7.5.18. Colombia Milk Ingredients Market Outlook, by Application, 2020–2033
7.5.19. Colombia Milk Ingredients Market Outlook, by Form, 2020–2033
7.5.20. Colombia Milk Ingredients Market Outlook, by Nature, 2020–2033
8. Middle East & Africa Milk Ingredients Market Outlook, 2020–2033
8.1. Middle East & Africa Milk Ingredients Market Outlook, by Product Type, Value (US$ Billion), 2020–2033
8.1.1. Skimmed and Whole Milk Powder
8.1.2. Milk Protein Concentrate and Isolate
8.1.3. Casein, Caseinates and Micellar Casein
8.1.4. Milk Fat Products (Butter Oil, Anhydrous Milk Fat, Cream Powder)
8.1.5. Lactose and Lactose Derivatives (including Galacto-oligosaccharides)
8.1.6. Milk Permeate and Dairy Minerals
8.1.7. Colostrum and Milk Fat Globule Membrane Fractions
8.1.8. Whey Proteins and Whey Powders
8.2. Middle East & Africa Milk Ingredients Market Outlook, by Application, Value (US$ Billion), 2020–2033
8.2.1. Infant and Clinical Nutrition
8.2.2. Bakery and Confectionery
8.2.3. Beverages and Dairy Applications
8.2.4. Sports and Active Nutrition
8.2.5. Savoury and Prepared Foods
8.2.6. Ice Cream
8.2.7. Animal Feed
8.3. Middle East & Africa Milk Ingredients Market Outlook, by Form, Value (US$ Billion), 2020–2033
8.3.1. Powder
8.3.2. Liquid and Concentrate
8.3.3. Granulated and Instantised
8.3.4. Paste and Block
8.4. Middle East & Africa Milk Ingredients Market Outlook, by Nature, Value (US$ Billion), 2020–2033
8.4.1. Conventional
8.4.2. Organic
8.5. Middle East & Africa Milk Ingredients Market Outlook, by Country, Value (US$ Billion), 2020–2033
8.5.1. Saudi Arabia Milk Ingredients Market Outlook, by Product Type, 2020–2033
8.5.2. Saudi Arabia Milk Ingredients Market Outlook, by Application, 2020–2033
8.5.3. Saudi Arabia Milk Ingredients Market Outlook, by Form, 2020–2033
8.5.4. Saudi Arabia Milk Ingredients Market Outlook, by Nature, 2020–2033
8.5.5. United Arab Emirates Milk Ingredients Market Outlook, by Product Type, 2020–2033
8.5.6. United Arab Emirates Milk Ingredients Market Outlook, by Application, 2020–2033
8.5.7. United Arab Emirates Milk Ingredients Market Outlook, by Form, 2020–2033
8.5.8. United Arab Emirates Milk Ingredients Market Outlook, by Nature, 2020–2033
8.5.9. Egypt Milk Ingredients Market Outlook, by Product Type, 2020–2033
8.5.10. Egypt Milk Ingredients Market Outlook, by Application, 2020–2033
8.5.11. Egypt Milk Ingredients Market Outlook, by Form, 2020–2033
8.5.12. Egypt Milk Ingredients Market Outlook, by Nature, 2020–2033
8.5.13. Algeria Milk Ingredients Market Outlook, by Product Type, 2020–2033
8.5.14. Algeria Milk Ingredients Market Outlook, by Application, 2020–2033
8.5.15. Algeria Milk Ingredients Market Outlook, by Form, 2020–2033
8.5.16. Algeria Milk Ingredients Market Outlook, by Nature, 2020–2033
8.5.17. Nigeria Milk Ingredients Market Outlook, by Product Type, 2020–2033
8.5.18. Nigeria Milk Ingredients Market Outlook, by Application, 2020–2033
8.5.19. Nigeria Milk Ingredients Market Outlook, by Form, 2020–2033
8.5.20. Nigeria Milk Ingredients Market Outlook, by Nature, 2020–2033
8.5.21. South Africa Milk Ingredients Market Outlook, by Product Type, 2020–2033
8.5.22. South Africa Milk Ingredients Market Outlook, by Application, 2020–2033
8.5.23. South Africa Milk Ingredients Market Outlook, by Form, 2020–2033
8.5.24. South Africa Milk Ingredients Market Outlook, by Nature, 2020–2033
9. Competitive Landscape
9.1. Market Concentration and Industry Leaders
9.2. Competitive Differentiation
9.3. Strategic Moves and Market Direction
9.4. Recent Industry Developments
9.5. Company Profiles
9.5.1. Fonterra Co-operative Group Limited
9.5.2. Royal FrieslandCampina N.V.
9.5.3. Arla Foods amba
9.5.4. Groupe Lactalis
9.5.5. Glanbia plc
9.5.6. Kerry Group plc
9.5.7. Saputo Inc.
9.5.8. Dairy Farmers of America, Inc.
9.5.9. Agropur Cooperative
9.5.10. Valio Ltd.
9.5.11. Sodiaal Union
9.5.12. Meggle GmbH & Co. KG
9.5.13. Milk Specialties Global
9.5.14. Idaho Milk Products, Inc.
10. Appendix
10.1. Research Methodology
10.2. Report Assumptions
10.3. Acronyms and Abbreviations
| Product Type | Skimmed and Whole Milk Powder, Milk Protein Concentrate and Isolate, Casein, Caseinates and Micellar Casein, Milk Fat Products (Butter Oil, Anhydrous Milk Fat, Cream Powder), Lactose and Lactose Derivatives (including Galacto-oligosaccharides), Milk Permeate and Dairy Minerals, Colostrum and Milk Fat Globule Membrane Fractions, Whey Proteins and Whey Powders |
| Application | Infant and Clinical Nutrition, Bakery and Confectionery, Beverages and Dairy Applications, Sports and Active Nutrition, Savoury and Prepared Foods, Ice Cream, Animal Feed |
| Form | Powder, Liquid and Concentrate, Granulated and Instantised, Paste and Block |
| Nature | Conventional, Organic |
| Regions | North America, Europe, Asia Pacific, Latin America, Middle East & Africa |
Our Research Methodology
Considering the volatility of business today, traditional approaches to strategizing a game plan can be unfruitful if not detrimental. True ambiguity is no way to determine a forecast. A myriad of predetermined factors must be accounted for such as the degree of risk involved, the magnitude of circumstances, as well as conditions or consequences that are not known or unpredictable. To circumvent binary views that cast uncertainty, the application of market research intelligence to strategically posture, move, and enable actionable outcomes is necessary.
View Methodology
Quality Assured
Rigorous Validation Process

Confidentiality Assured
End-to-end Data Security

Custom Research Services
Tailored To Your Objectives
FAQs
The global milk ingredients market is valued at US$ 68.4 billion in 2026, covering dairy-derived ingredients sold into food, beverage and nutrition manufacturing worldwide.
The market is projected to reach US$ 101.2 billion by 2033, growing at a 5.8% CAGR and adding an absolute opportunity of US$ 32.8 billion.
Milk powders lead with 31.6% share in 2026, because skimmed and whole milk powder remain the default tradable form of surplus milk solids.
Colostrum and milk fat globule membrane fractions grow fastest at 9.6%, and Middle East & Africa is the quickest region at a 7.2% CAGR.
Europe holds the largest share at 34.2% in 2026, supported by its export-oriented processing base, co-operative milk pools and dense fractionation capacity.
Related Reports
A2 Milk Market Size, Share, Insights, Competitive Landscape, and Forecast 2026 to 2033
The global A2 milk market is valued at US$21.20 billion in 2026, reaching US$52.31 billion by 2033, growing at a 13.8% CAGR
Tilapia Market Size, Share, Insights, Competitive Landscape, and Forecast 2026 to 2033
The tilapia market is projected to grow from US$14.60 billion in 2026 to US$20.10 billion by 2033, at a 4.7% CAGR, driven by protein demand and aquaculture.
Quillaja Extract Market Size, Share, Insights, Competitive Landscape, and Forecast 2026 to 2033
The quillaja extract market is projected to grow from US$397.5 million in 2026 to US$712.7 million by 2033, at an 8.7% CAGR, led by food and vaccine uses.
Organic Tobacco Market Size, Share, Insights, Competitive Landscape, and Forecast 2026 to 2033
The organic tobacco market is projected to grow from US$143.8 million in 2026 to US$193.1 million by 2033, at a 4.3% CAGR, shaped by sourcing and regulation.
Green Cardamom Market Size, Share, Insights, Competitive Landscape, and Forecast 2026 to 2033
Green cardamom market to grow from US$1.6 Bn in 2026 to US$2.3 Bn by 2033 at 5.3% CAGR. Explore forms, grades, applications and regional growth trends.
GMO Testing Market Size, Share, Insights, Competitive Landscape, and Forecast 2026 to 2033
GMO testing market to grow from US$2.2 Bn in 2026 to US$3.6 Bn by 2033 at 7.3% CAGR. Explore testing services, technologies, samples and regional trends.