



Blood Transfusion Diagnostics Market
Blood Transfusion Diagnostics Market Size, Share, Insights, Competitive Landscape, and Forecast 2026 to 2033
Report Overview
Blood Transfusion Diagnostics Market Size and Trend Analysis
What Is Driving Blood Transfusion Diagnostics Market Growth?
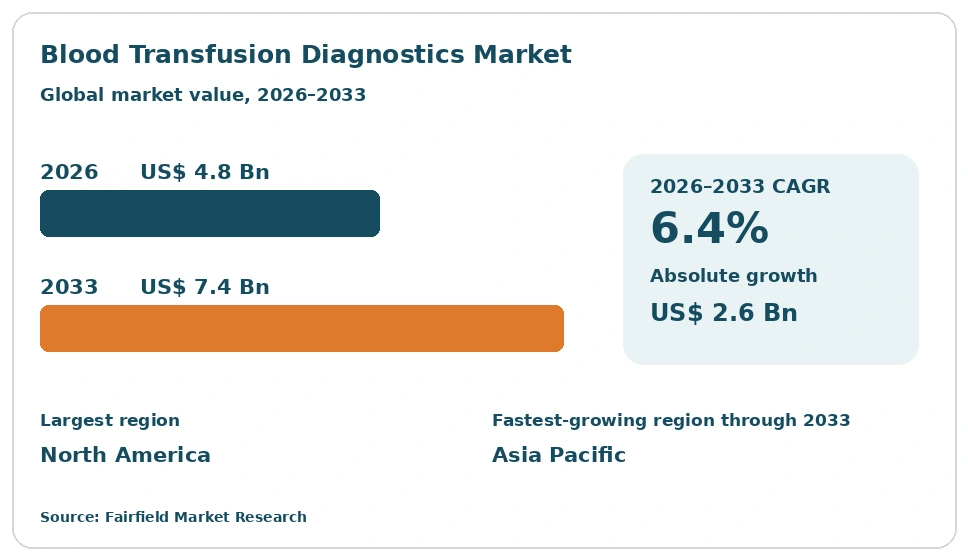
The global Blood Transfusion Diagnostics market size is expected to be valued at US$ 4.8 billion in 2026 and projected to reach US$ 7.4 billion by 2033, growing at a CAGR of 6.4% between 2026 and 2033. Growth rests on a simple rule of practice: every donated unit must be grouped, typed and screened before release, so testing volume follows collection volume. Rising surgical activity, chronic transfusion therapy and plasma collection keep that volume climbing. Automated platforms and molecular screening are replacing manual methods in large centres, lifting revenue per unit tested. The market added an absolute dollar opportunity of US$ 2.6 billion across the forecast period, against a historical CAGR of 5.1% between 2020 and 2025.
Key Report Takeaways
- By Product: Reagents and kits led with 62.5% share in 2026, while software and services is projected to expand at an 8.2% CAGR through 2033, driven by blood bank data management and donor traceability requirements.
- By Technology: Serological testing led with 33.5% share in 2026, while nucleic acid testing is projected to expand at a 7.8% CAGR through 2033, driven by shorter detection windows for transfusion-transmitted infections.
- By Application: Infectious disease screening led with 46.0% share in 2026, while antibody screening and crossmatching is projected to expand at a 7.2% CAGR through 2033, driven by complex cases needing extended phenotyping.
- By End User: Blood banks and donation centres led with 48.5% share in 2026, while plasma fractionators are projected to expand at a 7.6% CAGR through 2033, driven by rising global plasma collection capacity.
- By Region: North America led with 38.0% share in 2026, while Asia Pacific is projected to expand at an 8.3% CAGR through 2033. Europe, Latin America and Middle East & Africa complete the regional mix, driven by national blood service modernisation.
Market Trends and Insights
Market Growth Drivers
Rising Surgical Volumes and Chronic Transfusion Care Lift Testing Demand
Testing demand tracks the number of units collected, processed and released for clinical use. Each unit requires grouping, typing and infection screening before issue, so laboratory workload rises in step with transfusion activity. Ageing populations, higher cancer and renal disease burdens, and expanding surgical capacity all raise annual unit requirements. Trauma services and obstetric care add further pressure where hospitals must hold ready stock at all times.
Behind this sits steady hospital construction across middle-income countries and a shift toward day-case surgery in mature health systems. That shift changes the mix of demand without removing the need for compatible blood. Transplant programmes, haematology units and lifelong transfusion regimens for inherited anaemias generate repeat testing, because patients exposed to many donors need extended phenotyping and regular antibody review throughout their care.
Mandatory Donor Screening Policy Expands the Tested Base
Screening policy sets the floor under this market. Where national rules require universal testing of every donation, demand becomes non-discretionary and largely immune to hospital budget cycles. Agencies including the U.S. Food and Drug Administration, the European Medicines Agency and the World Health Organization all treat donation screening as central to blood safety. As more countries move from partial to universal screening, the tested base widens and reagent consumption grows with it.
Policy also shapes which methods laboratories buy. Programmes that add molecular screening alongside serology raise the number of assays run per donation rather than replacing existing ones. Quality systems, proficiency testing and record retention requirements push centres toward validated commercial kits and audited instruments. Smaller facilities that once relied on manual techniques increasingly purchase closed, traceable systems to satisfy inspection and accreditation demands.
Restraints Impact Analysis of Market
Capital Cost of Molecular Platforms Slows Adoption
Molecular screening carries a cost structure that many blood services cannot absorb. Instruments, service contracts, controlled laboratory space and validated cold chains all demand capital before the first donation is tested. Reagent prices per donation sit well above serological methods, which matters most where budgets are fixed by public health allocation rather than hospital billing. Centres with low daily throughput struggle to justify the investment at all.
Pooled testing strategies reduce per-donation cost but add complexity to sample handling and resolution workflows. Small regional centres face a harder choice: invest, consolidate testing into a central laboratory, or stay with existing methods. Consolidation can free capital, yet it lengthens turnaround and raises transport costs for rural collection sites. These trade-offs slow replacement cycles and keep older installed platforms running longer than vendors plan for.
Donor Base Constraints and Laboratory Staffing Gaps
Collection volume ultimately limits testing volume. Many health systems depend on a narrow pool of repeat voluntary donors, and that pool is ageing in several mature markets. Seasonal shortages, deferral criteria and uneven urban-rural collection coverage all cap the number of donations reaching the laboratory. Where supply is short, hospitals ration elective transfusion, and diagnostic consumption flattens even as clinical need remains unmet.
Staffing compounds the problem. Transfusion science requires trained technologists who can resolve antibody panels, investigate incompatible crossmatches and maintain platform validation. Recruitment is difficult in smaller centres and in lower-income regions, where qualified staff often move to larger institutions or abroad. Vendors respond with more automation and simpler operator interfaces, yet instrument purchases still stall when a facility lacks the trained people needed to operate, troubleshoot and maintain them reliably.
Market Opportunities
Automation and Connected Blood Bank Information Systems
Automation opens a revenue stream beyond reagents. Walk-away analysers, barcode-linked sample tracking and middleware that releases results into hospital systems reduce manual steps and transcription errors. Blood services under pressure to document every unit from vein to vein value this traceability. Vendors able to sell the instrument, the assay menu and the software layer together capture far more of each customer’s annual spend than reagent suppliers alone.
The software opportunity is widening as centres consolidate. Regional networks running several sites need shared inventory visibility, donor deferral registries and audit-ready reporting across locations. Cloud-hosted and subscription models suit organisations that cannot fund large capital projects. Integration with electronic health records also supports patient blood management programmes, which aim to use fewer units more precisely and depend on reliable antibody and compatibility data.
Expanding Safe Transfusion Access in Lower-Income Health Systems
Access to screened blood remains uneven, and closing that gap is a genuine market expansion rather than a marginal one. Many low- and middle-income countries still run fragmented collection networks with limited laboratory capacity outside major cities. Building national blood services in these settings creates sustained demand for grouping reagents, screening assays, cold chain equipment and training, usually funded through health ministries and development programmes.
Product design decides who can serve this demand. Assays that tolerate variable power supply, ambient-stable reagents, compact analysers and simplified maintenance fit district hospital conditions better than high-throughput systems built for central laboratories. Vendors offering tiered portfolios, local technical support and operator training are positioned for this work. The World Health Organization continues to treat universal access to safe blood as a core health system objective.
Category-wise Insights
Which Product Segment Holds the Largest Revenue Share?
Reagents and kits hold the largest share at 62.5% in 2026, because they are consumed with every donation tested. Antisera, red cell panels, gel and microplate consumables and screening assay kits generate recurring revenue tied directly to collection volume, which makes this segment the most stable part of the market. Instruments and analysers account for 29.0%, reflecting longer replacement cycles and lumpier capital purchasing.
Software and services is the fastest-growing segment at an 8.2% CAGR, rising from 8.5% of revenue as blood services buy donor management systems, inventory tools and validation support. Consolidation of regional testing into larger reference centres increases demand for networked data platforms. For vendors, this split matters commercially: instrument placements lock in reagent streams for years, while software deepens the customer relationship and raises switching costs across the whole installed base.
Serological Methods Anchor Volume While Molecular Testing Grows
Serological testing leads technology with 33.5% share in 2026. Column agglutination and microplate methods remain the working basis of ABO and RhD grouping, antibody screening and crossmatching in most laboratories, supported by decades of established practice and comparatively low cost per test. Immunoassay platforms hold 30.0%, carrying much of the routine infectious disease screening workload in automated form.
Nucleic acid testing is the fastest-growing technology at a 7.8% CAGR from 28.5% of revenue, as more national programmes add molecular screening to narrow the detection window for transfusion-transmitted infections. Molecular genotyping occupies the remaining 8.0% and is gaining use for extended red cell typing in multiply transfused patients. The practical effect is layering: molecular methods are added to serology rather than replacing it, which raises total assays run per donation.
Infectious Disease Screening Remains the Largest Application
Infectious disease screening is the largest application at 46.0% share in 2026. Testing every donation for transfusion-transmitted infections is mandated across most regulated blood systems, and many programmes run both serological and molecular assays on the same unit. That dual-method approach multiplies reagent consumption per donation and explains why this application outweighs the others in value terms despite covering a defined panel of targets.
Antibody screening and crossmatching is the fastest-growing application at a 7.2% CAGR, from 22.5% of revenue, as chronic transfusion therapy and transplant activity increase the number of alloimmunised patients needing detailed investigation. Blood grouping and typing holds 31.5%, growing with collection volume. For suppliers, the growth is concentrated in complex casework, where higher-value panels and extended phenotyping reagents carry better margins than routine grouping.
Blood Banks Lead Spending as Plasma Collection Scales Up
Blood banks and donation centres are the largest end user at 48.5% share in 2026, because donation screening is centralised at the point of collection in most systems. These organisations buy in volume, run the highest daily throughput and set the technology standard that smaller users follow. Hospitals and transfusion services hold 34.0%, concentrating on pre-transfusion compatibility testing and urgent casework.
Plasma fractionators are the fastest-growing end user at a 7.6% CAGR from 11.5% of revenue, as source plasma collection expands to supply immunoglobulin and clotting factor manufacturing. Independent and reference laboratories make up the remaining 6.0%, handling referred antibody investigations. The commercial signal is clear: large collection organisations and plasma networks concentrate purchasing power, so vendors increasingly compete through multi-year supply agreements rather than single-site sales.
Geography Analysis
Which Region Is Leading the Blood Transfusion Diagnostics Market?
North America leads with 38.0% share in 2026, growing at a 5.7% CAGR through 2033. The United States generates most regional revenue, supported by large centralised collection organisations, hospital transfusion services and a substantial commercial plasma network.
Leadership rests on early adoption of automated serology and molecular screening, which raises revenue per donation above the global average. Oversight by the U.S. Food and Drug Administration sustains demanding validation and documentation standards, pushing centres toward closed commercial systems rather than manual methods. Consolidation of testing into high-throughput regional laboratories supports continued instrument and software investment. Growth stays moderate because screening coverage is already near complete, so gains come from menu expansion, automation upgrades and plasma sector volume.
Harmonised Blood Safety Rules Sustain European Demand
Europe holds 27.5% share in 2026, expanding at a 5.4% CAGR. Germany, France, Italy, Spain and the United Kingdom generate most regional revenue through national blood services that purchase at scale.
Demand rests on harmonised quality and traceability requirements across member states, reinforced by the oversight role of the European Medicines Agency. Mandatory haemovigilance reporting has pushed centres toward systems that log every unit and result automatically. Several countries have consolidated testing into fewer, larger laboratories, which favours high-throughput automation and integrated data platforms. Public funding keeps price pressure high, so tenders often turn on total cost per donation rather than instrument features alone.
Which Region Is Growing Fastest in the Blood Transfusion Diagnostics Market?
Asia Pacific is growing fastest at an 8.3% CAGR through 2033, from 24.0% share in 2026. China, India, Japan, South Korea and Australia drive most of the expansion through very different routes.
In China and India, growth comes from widening the tested base: more licensed blood banks, stronger national coordination and a shift from manual grouping to automated and molecular platforms. Both countries continue building hospital capacity outside major cities, creating demand for compact analysers and locally supported reagent supply. Japan, South Korea and Australia contribute through replacement cycles and extended testing menus in mature services. Rising surgical volumes, inherited anaemia caseloads and expanding plasma collection reinforce the trend.
National Blood Programmes Lift Latin American Screening Capacity
Latin America accounts for 6.0% share in 2026, growing at a 6.5% CAGR. Brazil, Mexico, Argentina and Colombia represent most regional demand through public blood networks run by national health ministries.
Growth follows sustained policy work to centralise collection and standardise screening across states and provinces. Several countries have moved testing from small hospital laboratories into regional reference centres, which supports automation and consistent quality control. Regional disease patterns, including endemic infections requiring specific donation screening, shape the assay menus centres purchase. Public procurement dominates, so volume tenders and local distribution partnerships determine supplier access. Uneven voluntary donation rates and currency pressure on imported reagents both slow platform upgrades.
Donor Base Expansion Shapes Middle East and Africa Demand
Middle East & Africa holds 4.5% share in 2026, expanding at a 6.8% CAGR. The region splits into two distinct markets with different purchasing behaviour and different constraints.
Gulf states including Saudi Arabia and the United Arab Emirates fund well-equipped national blood services and buy automated serological and molecular systems. Across much of sub-Saharan Africa, the priority is building reliable collection and testing capacity, often with health ministry and development programme support. South Africa, Egypt, Nigeria and Kenya anchor regional volume. Growth depends on recruiting voluntary repeat donors, extending cold chain reach beyond capital cities and training laboratory staff. Equipment suited to variable power supply carries clear practical advantage.
Competitive Landscape
The market is moderately concentrated. A small group of diagnostics companies supplies most of the immunohaematology reagents and screening assays used by large blood services, while regional manufacturers serve domestic programmes in Asia, Latin America and parts of Europe. Concentration comes from the economics of validation: once a blood service qualifies a platform, switching means revalidating workflows, retraining staff and amending licences, so installed positions tend to hold for years.
Competition turns on breadth of assay menu, degree of automation and quality of the data layer. Vendors differentiate through walk-away instrument throughput, barcode-driven sample traceability, middleware that connects to blood bank information systems, and reliability of reagent supply. Regulatory experience is itself a competitive asset, because customers value suppliers who can support audits and documentation across multiple jurisdictions. Newer entrants tend to come from molecular diagnostics and laboratory automation rather than from traditional serology, bringing platform engineering and software capability into a field long defined by reagent chemistry.
Strategic activity centres on widening the menu on existing installed instruments, extending geographic distribution into emerging blood programmes, and building software and service revenue alongside consumables. These moves matter because they raise the value of each placement and make customer relationships harder to displace. Partnerships between reagent specialists and instrument manufacturers remain a practical route into markets where neither party has full capability alone.
Direction of travel favours integrated offerings over standalone products. Suppliers are organising around the full donation workflow, from donor registration through screening to release and inventory management, and around tiered portfolios that fit both central reference laboratories and smaller district facilities.
Industry Leaders
- Grifols
- QuidelOrtho
- Bio-Rad Laboratories
- Immucor (Werfen)
- F. Hoffmann-La Roche
- Abbott Laboratories
Companies Covered in the Report
- Grifols
- QuidelOrtho
- Bio-Rad Laboratories
- Immucor (Werfen)
- F. Hoffmann-La Roche
- Abbott Laboratories
- Siemens Healthineers
- bioMérieux
- Thermo Fisher Scientific
- DiaSorin
- Beckman Coulter Diagnostics
- Hologic
- Sysmex Corporation
- Fujirebio
- BAG Health Care
- Tulip Diagnostics
Blood Transfusion Diagnostics Market Report Scope
The Blood Transfusion Diagnostics market is segmented by product, technology, application, end user and region.
| By Product | Reagents and Kits, Instruments and Analysers, Software and Services |
| By Technology | Serological Testing, Immunoassay, Nucleic Acid Testing, Molecular Genotyping |
| By Application | Infectious Disease Screening, Blood Grouping and Typing, Antibody Screening and Crossmatching |
| By End User | Blood Banks and Donation Centres, Hospitals and Transfusion Services, Plasma Fractionators, Independent and Reference Laboratories |
| By Region | North America, Europe, Asia Pacific, Latin America, Middle East & Africa |
1. Executive Summary
1.1 Blood Transfusion Diagnostics Market Snapshot
1.2 Future Projections
1.3 Key Market Trends
1.4 Regional Snapshot
2. Market Overview
2.1 Market Definition and Report Scope
2.2 Historical Market Trends
2.3 Market Dynamics
2.3.1 Drivers
2.3.2 Restraints
2.3.3 Market Opportunities
3. Global Blood Transfusion Diagnostics Market Outlook, 2026–2033
3.1 Global Blood Transfusion Diagnostics Market Outlook, by Product, Value (US$ Billion), 2026–2033
3.1.1 Reagents and Kits
3.1.2 Instruments and Analysers
3.1.3 Software and Services
3.2 Global Blood Transfusion Diagnostics Market Outlook, by Technology, Value (US$ Billion), 2026–2033
3.2.1 Serological Testing
3.2.2 Immunoassay
3.2.3 Nucleic Acid Testing
3.2.4 Molecular Genotyping
3.3 Global Blood Transfusion Diagnostics Market Outlook, by Application, Value (US$ Billion), 2026–2033
3.3.1 Infectious Disease Screening
3.3.2 Blood Grouping and Typing
3.3.3 Antibody Screening and Crossmatching
3.4 Global Blood Transfusion Diagnostics Market Outlook, by End User, Value (US$ Billion), 2026–2033
3.4.1 Blood Banks and Donation Centres
3.4.2 Hospitals and Transfusion Services
3.4.3 Plasma Fractionators
3.4.4 Independent and Reference Laboratories
3.5 Global Blood Transfusion Diagnostics Market Outlook, by Region, Value (US$ Billion), 2026–2033
3.5.1 North America
3.5.2 Europe
3.5.3 Asia Pacific
3.5.4 Latin America
3.5.5 Middle East & Africa
4. North America Blood Transfusion Diagnostics Market Outlook, 2026–2033
4.1 North America Blood Transfusion Diagnostics Market Outlook, by Product, Value (US$ Billion), 2026–2033
4.1.1 Reagents and Kits
4.1.2 Instruments and Analysers
4.1.3 Software and Services
4.2 North America Blood Transfusion Diagnostics Market Outlook, by Technology, Value (US$ Billion), 2026–2033
4.2.1 Serological Testing
4.2.2 Immunoassay
4.2.3 Nucleic Acid Testing
4.2.4 Molecular Genotyping
4.3 North America Blood Transfusion Diagnostics Market Outlook, by Application, Value (US$ Billion), 2026–2033
4.3.1 Infectious Disease Screening
4.3.2 Blood Grouping and Typing
4.3.3 Antibody Screening and Crossmatching
4.4 North America Blood Transfusion Diagnostics Market Outlook, by End User, Value (US$ Billion), 2026–2033
4.4.1 Blood Banks and Donation Centres
4.4.2 Hospitals and Transfusion Services
4.4.3 Plasma Fractionators
4.4.4 Independent and Reference Laboratories
4.5 North America Blood Transfusion Diagnostics Market Outlook, by Country, Value (US$ Billion), 2026–2033
4.5.1 United States Blood Transfusion Diagnostics Market Outlook, by Product, 2026–2033
4.5.2 United States Blood Transfusion Diagnostics Market Outlook, by Technology, 2026–2033
4.5.3 United States Blood Transfusion Diagnostics Market Outlook, by Application, 2026–2033
4.5.4 United States Blood Transfusion Diagnostics Market Outlook, by End User, 2026–2033
5. Europe Blood Transfusion Diagnostics Market Outlook, 2026–2033
5.1 Europe Blood Transfusion Diagnostics Market Outlook, by Product, Value (US$ Billion), 2026–2033
5.1.1 Reagents and Kits
5.1.2 Instruments and Analysers
5.1.3 Software and Services
5.2 Europe Blood Transfusion Diagnostics Market Outlook, by Technology, Value (US$ Billion), 2026–2033
5.2.1 Serological Testing
5.2.2 Immunoassay
5.2.3 Nucleic Acid Testing
5.2.4 Molecular Genotyping
5.3 Europe Blood Transfusion Diagnostics Market Outlook, by Application, Value (US$ Billion), 2026–2033
5.3.1 Infectious Disease Screening
5.3.2 Blood Grouping and Typing
5.3.3 Antibody Screening and Crossmatching
5.4 Europe Blood Transfusion Diagnostics Market Outlook, by End User, Value (US$ Billion), 2026–2033
5.4.1 Blood Banks and Donation Centres
5.4.2 Hospitals and Transfusion Services
5.4.3 Plasma Fractionators
5.4.4 Independent and Reference Laboratories
5.5 Europe Blood Transfusion Diagnostics Market Outlook, by Country, Value (US$ Billion), 2026–2033
5.5.1 Germany Blood Transfusion Diagnostics Market Outlook, by Product, 2026–2033
5.5.2 Germany Blood Transfusion Diagnostics Market Outlook, by Technology, 2026–2033
5.5.3 Germany Blood Transfusion Diagnostics Market Outlook, by Application, 2026–2033
5.5.4 Germany Blood Transfusion Diagnostics Market Outlook, by End User, 2026–2033
5.5.5 France Blood Transfusion Diagnostics Market Outlook, by Product, 2026–2033
5.5.6 France Blood Transfusion Diagnostics Market Outlook, by Technology, 2026–2033
5.5.7 France Blood Transfusion Diagnostics Market Outlook, by Application, 2026–2033
5.5.8 France Blood Transfusion Diagnostics Market Outlook, by End User, 2026–2033
5.5.9 Italy Blood Transfusion Diagnostics Market Outlook, by Product, 2026–2033
5.5.10 Italy Blood Transfusion Diagnostics Market Outlook, by Technology, 2026–2033
5.5.11 Italy Blood Transfusion Diagnostics Market Outlook, by Application, 2026–2033
5.5.12 Italy Blood Transfusion Diagnostics Market Outlook, by End User, 2026–2033
5.5.13 Spain Blood Transfusion Diagnostics Market Outlook, by Product, 2026–2033
5.5.14 Spain Blood Transfusion Diagnostics Market Outlook, by Technology, 2026–2033
5.5.15 Spain Blood Transfusion Diagnostics Market Outlook, by Application, 2026–2033
5.5.16 Spain Blood Transfusion Diagnostics Market Outlook, by End User, 2026–2033
5.5.17 United Kingdom Blood Transfusion Diagnostics Market Outlook, by Product, 2026–2033
5.5.18 United Kingdom Blood Transfusion Diagnostics Market Outlook, by Technology, 2026–2033
5.5.19 United Kingdom Blood Transfusion Diagnostics Market Outlook, by Application, 2026–2033
5.5.20 United Kingdom Blood Transfusion Diagnostics Market Outlook, by End User, 2026–2033
6. Asia Pacific Blood Transfusion Diagnostics Market Outlook, 2026–2033
6.1 Asia Pacific Blood Transfusion Diagnostics Market Outlook, by Product, Value (US$ Billion), 2026–2033
6.1.1 Reagents and Kits
6.1.2 Instruments and Analysers
6.1.3 Software and Services
6.2 Asia Pacific Blood Transfusion Diagnostics Market Outlook, by Technology, Value (US$ Billion), 2026–2033
6.2.1 Serological Testing
6.2.2 Immunoassay
6.2.3 Nucleic Acid Testing
6.2.4 Molecular Genotyping
6.3 Asia Pacific Blood Transfusion Diagnostics Market Outlook, by Application, Value (US$ Billion), 2026–2033
6.3.1 Infectious Disease Screening
6.3.2 Blood Grouping and Typing
6.3.3 Antibody Screening and Crossmatching
6.4 Asia Pacific Blood Transfusion Diagnostics Market Outlook, by End User, Value (US$ Billion), 2026–2033
6.4.1 Blood Banks and Donation Centres
6.4.2 Hospitals and Transfusion Services
6.4.3 Plasma Fractionators
6.4.4 Independent and Reference Laboratories
6.5 Asia Pacific Blood Transfusion Diagnostics Market Outlook, by Country, Value (US$ Billion), 2026–2033
6.5.1 China Blood Transfusion Diagnostics Market Outlook, by Product, 2026–2033
6.5.2 China Blood Transfusion Diagnostics Market Outlook, by Technology, 2026–2033
6.5.3 China Blood Transfusion Diagnostics Market Outlook, by Application, 2026–2033
6.5.4 China Blood Transfusion Diagnostics Market Outlook, by End User, 2026–2033
6.5.5 India Blood Transfusion Diagnostics Market Outlook, by Product, 2026–2033
6.5.6 India Blood Transfusion Diagnostics Market Outlook, by Technology, 2026–2033
6.5.7 India Blood Transfusion Diagnostics Market Outlook, by Application, 2026–2033
6.5.8 India Blood Transfusion Diagnostics Market Outlook, by End User, 2026–2033
6.5.9 Japan Blood Transfusion Diagnostics Market Outlook, by Product, 2026–2033
6.5.10 Japan Blood Transfusion Diagnostics Market Outlook, by Technology, 2026–2033
6.5.11 Japan Blood Transfusion Diagnostics Market Outlook, by Application, 2026–2033
6.5.12 Japan Blood Transfusion Diagnostics Market Outlook, by End User, 2026–2033
6.5.13 South Korea Blood Transfusion Diagnostics Market Outlook, by Product, 2026–2033
6.5.14 South Korea Blood Transfusion Diagnostics Market Outlook, by Technology, 2026–2033
6.5.15 South Korea Blood Transfusion Diagnostics Market Outlook, by Application, 2026–2033
6.5.16 South Korea Blood Transfusion Diagnostics Market Outlook, by End User, 2026–2033
6.5.17 Australia Blood Transfusion Diagnostics Market Outlook, by Product, 2026–2033
6.5.18 Australia Blood Transfusion Diagnostics Market Outlook, by Technology, 2026–2033
6.5.19 Australia Blood Transfusion Diagnostics Market Outlook, by Application, 2026–2033
6.5.20 Australia Blood Transfusion Diagnostics Market Outlook, by End User, 2026–2033
7. Latin America Blood Transfusion Diagnostics Market Outlook, 2026–2033
7.1 Latin America Blood Transfusion Diagnostics Market Outlook, by Product, Value (US$ Billion), 2026–2033
7.1.1 Reagents and Kits
7.1.2 Instruments and Analysers
7.1.3 Software and Services
7.2 Latin America Blood Transfusion Diagnostics Market Outlook, by Technology, Value (US$ Billion), 2026–2033
7.2.1 Serological Testing
7.2.2 Immunoassay
7.2.3 Nucleic Acid Testing
7.2.4 Molecular Genotyping
7.3 Latin America Blood Transfusion Diagnostics Market Outlook, by Application, Value (US$ Billion), 2026–2033
7.3.1 Infectious Disease Screening
7.3.2 Blood Grouping and Typing
7.3.3 Antibody Screening and Crossmatching
7.4 Latin America Blood Transfusion Diagnostics Market Outlook, by End User, Value (US$ Billion), 2026–2033
7.4.1 Blood Banks and Donation Centres
7.4.2 Hospitals and Transfusion Services
7.4.3 Plasma Fractionators
7.4.4 Independent and Reference Laboratories
7.5 Latin America Blood Transfusion Diagnostics Market Outlook, by Country, Value (US$ Billion), 2026–2033
7.5.1 Brazil Blood Transfusion Diagnostics Market Outlook, by Product, 2026–2033
7.5.2 Brazil Blood Transfusion Diagnostics Market Outlook, by Technology, 2026–2033
7.5.3 Brazil Blood Transfusion Diagnostics Market Outlook, by Application, 2026–2033
7.5.4 Brazil Blood Transfusion Diagnostics Market Outlook, by End User, 2026–2033
7.5.5 Mexico Blood Transfusion Diagnostics Market Outlook, by Product, 2026–2033
7.5.6 Mexico Blood Transfusion Diagnostics Market Outlook, by Technology, 2026–2033
7.5.7 Mexico Blood Transfusion Diagnostics Market Outlook, by Application, 2026–2033
7.5.8 Mexico Blood Transfusion Diagnostics Market Outlook, by End User, 2026–2033
7.5.9 Argentina Blood Transfusion Diagnostics Market Outlook, by Product, 2026–2033
7.5.10 Argentina Blood Transfusion Diagnostics Market Outlook, by Technology, 2026–2033
7.5.11 Argentina Blood Transfusion Diagnostics Market Outlook, by Application, 2026–2033
7.5.12 Argentina Blood Transfusion Diagnostics Market Outlook, by End User, 2026–2033
7.5.13 Colombia Blood Transfusion Diagnostics Market Outlook, by Product, 2026–2033
7.5.14 Colombia Blood Transfusion Diagnostics Market Outlook, by Technology, 2026–2033
7.5.15 Colombia Blood Transfusion Diagnostics Market Outlook, by Application, 2026–2033
7.5.16 Colombia Blood Transfusion Diagnostics Market Outlook, by End User, 2026–2033
8. Middle East & Africa Blood Transfusion Diagnostics Market Outlook, 2026–2033
8.1 Middle East & Africa Blood Transfusion Diagnostics Market Outlook, by Product, Value (US$ Billion), 2026–2033
8.1.1 Reagents and Kits
8.1.2 Instruments and Analysers
8.1.3 Software and Services
8.2 Middle East & Africa Blood Transfusion Diagnostics Market Outlook, by Technology, Value (US$ Billion), 2026–2033
8.2.1 Serological Testing
8.2.2 Immunoassay
8.2.3 Nucleic Acid Testing
8.2.4 Molecular Genotyping
8.3 Middle East & Africa Blood Transfusion Diagnostics Market Outlook, by Application, Value (US$ Billion), 2026–2033
8.3.1 Infectious Disease Screening
8.3.2 Blood Grouping and Typing
8.3.3 Antibody Screening and Crossmatching
8.4 Middle East & Africa Blood Transfusion Diagnostics Market Outlook, by End User, Value (US$ Billion), 2026–2033
8.4.1 Blood Banks and Donation Centres
8.4.2 Hospitals and Transfusion Services
8.4.3 Plasma Fractionators
8.4.4 Independent and Reference Laboratories
8.5 Middle East & Africa Blood Transfusion Diagnostics Market Outlook, by Country and Subregion, Value (US$ Billion), 2026–2033
8.5.1 Gulf states Blood Transfusion Diagnostics Market Outlook, by Product, 2026–2033
8.5.2 Gulf states Blood Transfusion Diagnostics Market Outlook, by Technology, 2026–2033
8.5.3 Gulf states Blood Transfusion Diagnostics Market Outlook, by Application, 2026–2033
8.5.4 Gulf states Blood Transfusion Diagnostics Market Outlook, by End User, 2026–2033
8.5.5 Saudi Arabia Blood Transfusion Diagnostics Market Outlook, by Product, 2026–2033
8.5.6 Saudi Arabia Blood Transfusion Diagnostics Market Outlook, by Technology, 2026–2033
8.5.7 Saudi Arabia Blood Transfusion Diagnostics Market Outlook, by Application, 2026–2033
8.5.8 Saudi Arabia Blood Transfusion Diagnostics Market Outlook, by End User, 2026–2033
8.5.9 United Arab Emirates Blood Transfusion Diagnostics Market Outlook, by Product, 2026–2033
8.5.10 United Arab Emirates Blood Transfusion Diagnostics Market Outlook, by Technology, 2026–2033
8.5.11 United Arab Emirates Blood Transfusion Diagnostics Market Outlook, by Application, 2026–2033
8.5.12 United Arab Emirates Blood Transfusion Diagnostics Market Outlook, by End User, 2026–2033
8.5.13 South Africa Blood Transfusion Diagnostics Market Outlook, by Product, 2026–2033
8.5.14 South Africa Blood Transfusion Diagnostics Market Outlook, by Technology, 2026–2033
8.5.15 South Africa Blood Transfusion Diagnostics Market Outlook, by Application, 2026–2033
8.5.16 South Africa Blood Transfusion Diagnostics Market Outlook, by End User, 2026–2033
8.5.17 Egypt Blood Transfusion Diagnostics Market Outlook, by Product, 2026–2033
8.5.18 Egypt Blood Transfusion Diagnostics Market Outlook, by Technology, 2026–2033
8.5.19 Egypt Blood Transfusion Diagnostics Market Outlook, by Application, 2026–2033
8.5.20 Egypt Blood Transfusion Diagnostics Market Outlook, by End User, 2026–2033
8.5.21 Nigeria Blood Transfusion Diagnostics Market Outlook, by Product, 2026–2033
8.5.22 Nigeria Blood Transfusion Diagnostics Market Outlook, by Technology, 2026–2033
8.5.23 Nigeria Blood Transfusion Diagnostics Market Outlook, by Application, 2026–2033
8.5.24 Nigeria Blood Transfusion Diagnostics Market Outlook, by End User, 2026–2033
8.5.25 Kenya Blood Transfusion Diagnostics Market Outlook, by Product, 2026–2033
8.5.26 Kenya Blood Transfusion Diagnostics Market Outlook, by Technology, 2026–2033
8.5.27 Kenya Blood Transfusion Diagnostics Market Outlook, by Application, 2026–2033
8.5.28 Kenya Blood Transfusion Diagnostics Market Outlook, by End User, 2026–2033
9. Competitive Landscape
9.1 Industry Leaders
9.2 Company Profiles
9.2.1 Grifols
9.2.2 QuidelOrtho
9.2.3 Bio-Rad Laboratories
9.2.4 Immucor (Werfen)
9.2.5 F. Hoffmann-La Roche
9.2.6 Abbott Laboratories
9.2.7 Siemens Healthineers
9.2.8 bioMérieux
9.2.9 Thermo Fisher Scientific
9.2.10 DiaSorin
9.2.11 Beckman Coulter Diagnostics
9.2.12 Hologic
9.2.13 Sysmex Corporation
9.2.14 Fujirebio
9.2.15 BAG Health Care
9.2.16 Tulip Diagnostics
10. Appendix
10.1 Research Methodology
10.2 Report Assumptions
10.3 Acronyms and Abbreviations
| By Product | Reagents and Kits, Instruments and Analysers, Software and Services |
| By Technology | Serological Testing, Immunoassay, Nucleic Acid Testing, Molecular Genotyping |
| By Application | Infectious Disease Screening, Blood Grouping and Typing, Antibody Screening and Crossmatching |
| By End User | Blood Banks and Donation Centres, Hospitals and Transfusion Services, Plasma Fractionators, Independent and Reference Laboratories |
| By Region | North America, Europe, Asia Pacific, Latin America, Middle East & Africa |
Our Research Methodology
Considering the volatility of business today, traditional approaches to strategizing a game plan can be unfruitful if not detrimental. True ambiguity is no way to determine a forecast. A myriad of predetermined factors must be accounted for such as the degree of risk involved, the magnitude of circumstances, as well as conditions or consequences that are not known or unpredictable. To circumvent binary views that cast uncertainty, the application of market research intelligence to strategically posture, move, and enable actionable outcomes is necessary.
View Methodology
Quality Assured
Rigorous Validation Process

Confidentiality Assured
End-to-end Data Security

Custom Research Services
Tailored To Your Objectives
FAQs
The market is valued at US$ 4.8 billion in 2026, reflecting mandatory screening of donated units across most regulated national blood collection systems worldwide.
The market is projected to grow at a 6.4% CAGR between 2026 and 2033, reaching US$ 7.4 billion as automation and molecular screening adoption widen.
Reagents and kits lead with 62.5% share in 2026, while software and services grows fastest at an 8.2% CAGR through 2033.
North America leads with 38.0% share in 2026, while Asia Pacific grows fastest at an 8.3% CAGR through 2033 on service modernisation.
The market is moderately concentrated, with a few diagnostics suppliers serving large blood services and regional manufacturers supplying domestic programmes across several markets.
Related Reports
Smart Fertility Trackers Market Size, Share, Insights, Competitive Landscape, and Forecast 2026 to 2033
Explore the smart fertility trackers market, forecast to reach US$3.10 billion by 2033 at 11.8% CAGR, with product, technology, channel, and regional insights.
Endodontic Instruments Market Size, Share, Insights, Competitive Landscape, and Forecast 2026 to 2033
Explore the endodontic instruments market, forecast to reach US$2.19 billion by 2033 at 6.4% CAGR, with product, application, and regional insights.
Ankle Splints Market Size, Share, Insights, Competitive Landscape, and Forecast 2026 to 2033
Explore the ankle splints market, forecast to reach US$2.30 billion by 2033 at 6.6% CAGR, with insights on products, applications, channels, and regions.
ACL Reconstruction Market Size, Share, Insights, Competitive Landscape, and Forecast 2026 to 2033
Explore the ACL reconstruction market, forecast to reach US$14.04 billion by 2033 at 6.9% CAGR, with insights on grafts, fixation, end users, and regions.
Stroke Diagnostics and Therapeutics Market Size, Share, Insights, Competitive Landscape, and Forecast 2026 to 2033
Explore the stroke diagnostics and therapeutics market, forecast to reach US$81.70 billion by 2033 at 7.9% CAGR, with insights on types and regions.
IoT Medical Devices Market Size, Share, Insights, Competitive Landscape, and Forecast 2026 to 2033
Explore the IoT medical devices market, forecast to reach US$259.93 billion by 2033 at 18.9% CAGR, with insights on products, connectivity, and regions.