



Smart Fertility Trackers Market
Smart Fertility Trackers Market Size, Share, Insights, Competitive Landscape, and Forecast 2026 to 2033
Report Overview
Smart Fertility Trackers Market Size and Trend Analysis
What Is Pushing Smart Fertility Tracker Sales Higher?
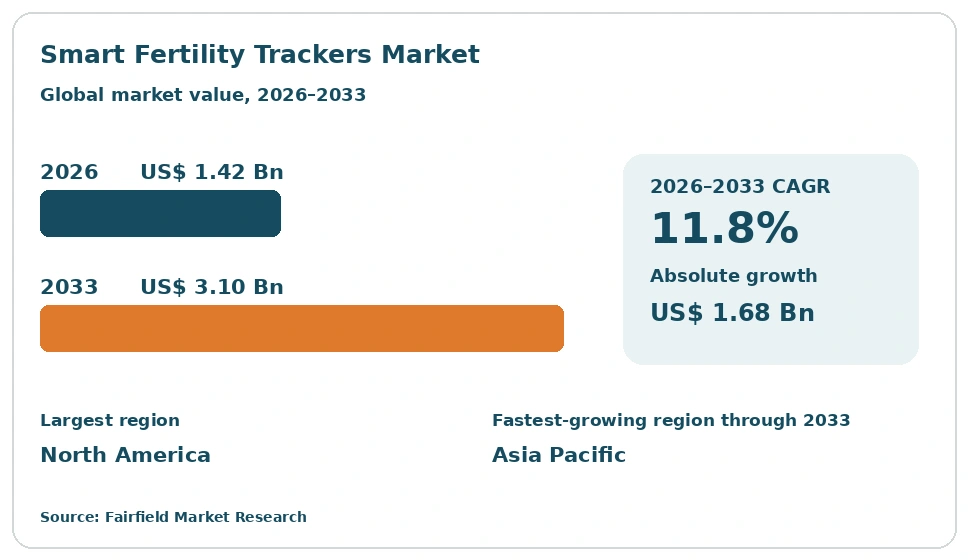
The global Smart Fertility Trackers market size is expected to be valued at US$ 1.42 billion in 2026 and projected to reach US$ 3.10 billion by 2033, growing at a CAGR of 11.8% between 2026 and 2033. Three shifts drive it. Sensor hardware has become cheap enough to place temperature and pulse monitoring inside rings, patches and wrist devices. At-home hormone assays have moved from qualitative strips to quantitative readouts paired with mobile software. Subscription platforms now carry much of category revenue, lifting recurring income per device. The market expanded at a 13.2% CAGR between 2020 and 2025, and the absolute dollar opportunity between 2026 and 2033 stands at US$ 1.68 billion.
Key Report Takeaways
- By Product Type: Wearable trackers led with a 38% share in 2026, while at-home hormone testing devices are projected to expand at a 13.6% CAGR through 2033, driven by falling assay costs that bring quantitative hormone readouts into routine home use.
- By Technology: Temperature-based sensing held a 35% share in 2026, while AI-enabled cycle analytics is projected to grow at a 15.2% CAGR through 2033, driven by larger longitudinal datasets that sharpen on-device signal interpretation across varied cycle patterns.
- By Distribution Channel: Direct-to-consumer online sales captured a 41% share in 2026, while clinic and hospital channels are projected to advance at a 13.8% CAGR through 2033, driven by reproductive health centers adopting remote monitoring into standard workflows.
- By End User: Individual consumers accounted for a 68% share in 2026, while employer and payer-sponsored programs are projected to rise at a 15.6% CAGR through 2033, driven by benefit designs that now fund reproductive health services directly.
- By Region: North America led with a 41% share in 2026, while Asia Pacific is projected to expand at a 14.4% CAGR through 2033, driven by smartphone penetration and the scale of regional consumer electronics manufacturing.
Market Trends and Insights
Market Growth Drivers
Later First Births Are Widening Demand for Cycle Data
Demand for smart fertility trackers is rising because people are starting families later in life. Across high-income economies, the average age at first birth has moved upward over two decades. A later start compresses the period in which people want detailed information about their own cycles, so interest in structured, longitudinal data has spread well beyond a small enthusiast base. That shift turns a niche accessory into a recurring purchase supported by software subscriptions and replaceable consumables.
The trend is demographic rather than promotional. National statistical agencies across Europe, North America and parts of Asia Pacific record falling birth rates alongside rising maternal age. Public health systems have widened reproductive health services in response. Device makers have aligned roadmaps with that demand, investing in multi-signal sensing and clearer presentation of trends inside their mobile applications.
Consumer Wearables Have Made Cycle Sensing a Standard Feature
General-purpose wearables have pulled cycle sensing into the mainstream and expanded the addressable base sharply. Rings, watches and bands already carry skin temperature, pulse and movement sensors for sleep and training features. Adding cycle analytics costs the manufacturer little incremental hardware, so the feature now ships on devices bought for other reasons. That changes the competitive setup for specialist vendors, who must compete on depth of interpretation rather than on possession of a sensor.
Component economics explain the shift. Thermistor accuracy, low-power photoplethysmography and on-device processing have all improved while unit prices fell. Platform owners in North America, Europe and Asia Pacific have published developer interfaces that let third-party reproductive health applications read sensor streams. Specialist firms increasingly ship software that runs on hardware they did not build, which lowers their own manufacturing exposure.
Restraints Impact Analysis of Market
Reproductive Health Data Carries Serious Privacy and Legal Exposure
Privacy risk is the most material brake on this market, not a routine compliance line item. Menstrual and fertility records reveal pregnancy status, pregnancy loss and care decisions. Disclosure can expose a person to employment harm, insurance consequences, family conflict or legal proceedings depending on where they live. Where people doubt how records are stored, shared or subpoenaed, they abandon apps, falsify entries or stay offline entirely. Each of those responses removes paying users and degrades the data that products depend on.
Scrutiny has intensified. Data protection authorities in Europe and consumer protection agencies in North America treat reproductive health data as a sensitive category warranting closer examination of sharing practices. Advertising software development kits, analytics partners and cloud processors each widen the exposure surface. Vendors are moving toward on-device processing, encryption and data minimisation, which raises engineering cost.
Regulatory Classification and Evidence Requirements Raise Entry Costs
Regulatory classification slows commercialisation and favours better-capitalised vendors. A product that only displays logged observations sits outside most device regimes. A product that interprets physiological signals and returns a clinical-style output can fall within medical device oversight. Firms must decide early which claims they intend to make, because that choice determines the evidence, quality systems and post-market obligations they carry. Many smaller entrants limit their claims instead, which narrows how they can describe the product.
Both the U.S. Food and Drug Administration and the European Union medical device framework assess software-based products according to the claims attached to them. Building supporting evidence takes time, specialist clinical staff and sustained funding that early-stage firms rarely hold. Hormone-based devices face a further burden, since assay reproducibility and manufacturing controls must be demonstrated for each production batch.
Market Opportunities
Clinic and Health System Integration Opens a Second Revenue Channel
Selling into reproductive health clinics gives vendors a revenue stream that does not depend on consumer churn. Clinics already manage cycle monitoring through appointments, serum testing and ultrasound scheduling. Home-collected temperature and hormone trends can reduce the number of in-person visits needed before a consultation becomes productive. Institutional buyers sign multi-year agreements, pay per seat or per patient, and churn far less than individual subscribers. That revenue profile is more predictable than app store income.
Execution requires different engineering. Clinics need exportable records, audit trails, role-based access and interfaces to electronic health record systems. Vendors with quality management systems already in place for device compliance can meet those requirements with modest additional work. Several specialist firms in North America and Europe now sell clinician dashboards alongside their consumer applications, priced under separate institutional tiers.
Employer and Payer Benefit Programs Expand Addressable Spending
Employer and payer funding converts a discretionary consumer purchase into a covered benefit, which widens the paying population considerably. Large employers have added reproductive and family health services to benefit packages to support recruitment and retention. When a programme administrator funds the device and subscription, price sensitivity at the individual level falls away. Vendors gain bulk distribution, predictable renewal cycles and far lower customer acquisition cost per enrolled user.
Benefit platforms and third-party administrators act as the gateway. They assess vendors on data protection practices, interoperability and service quality before adding them to a catalogue. That screening favours firms that already treat reproductive health data carefully. Activity is concentrated in North America and western Europe, with early uptake among multinational employers operating in Asia Pacific markets. Programme catalogues renew annually, which rewards consistent service quality.
Category-wise Insights
Which Product Type Holds the Largest Revenue Share?
Wearable trackers led the market with a 38% share in 2026, because continuous overnight sensing requires no daily user action. Rings, armbands and adhesive patches capture skin temperature and pulse during sleep, then sync automatically. That passive design suits people who found manual charting difficult to sustain. At-home hormone testing devices held 27%, standalone software platforms 24%, and accessories and consumables the remaining 11%.
At-home hormone testing devices are the growth leader, projected to expand at a 13.6% CAGR through 2033. Lateral flow assays paired with optical readers now return quantitative values rather than a line that users interpret themselves. Cartridge and strip costs have fallen as manufacturing volumes rose. The consumable attached to each reader also creates repeat revenue, which explains why several hardware vendors have moved into this format from temperature-only designs.
How Sensing Technology Choices Are Shaping Competition
Temperature-based sensing held the largest technology share at 35% in 2026, reflecting decades of familiarity with basal body temperature methods and the low component cost of accurate thermistors. Hormone detection accounted for 26%, cardiorespiratory sensing based on heart rate and heart rate variability for 21%, and AI-enabled cycle analytics for 18%. Most shipping products combine two or more of these inputs.
AI-enabled cycle analytics is the fastest-growing technology, projected at a 15.2% CAGR through 2033. Vendors have accumulated multi-year records across large user bases, which supports models that handle irregular cycles, shift work and illness better than fixed-rule calculations. Processing has also moved onto the device itself, which reduces what travels to cloud servers. That architecture addresses privacy concerns while improving responsiveness, making analytics capability a central competitive asset rather than a supporting feature.
Direct Channels Still Dominate While Clinical Routes Accelerate
Direct-to-consumer online sales captured a 41% share in 2026, since brand websites and app stores let vendors control pricing, bundle subscriptions and manage the full customer relationship. E-commerce marketplaces contributed 26%, retail pharmacies and drugstores 21%, and clinic and hospital channels 12%. Marketplaces matter most for consumable replenishment, where convenience outweighs brand loyalty.
Clinic and hospital channels are growing fastest at a 13.8% CAGR through 2033. Reproductive health centers have adopted remote monitoring workflows that use home-collected data between appointments, and procurement teams buy devices and software together under service agreements. Pharmacy shelf space has also expanded as chains build out broader women’s health sections. For vendors, the clinical route carries longer sales cycles but delivers contract revenue that is far less exposed to consumer subscription churn.
Why Individual Consumers Still Account for Most Spending
Individual consumers accounted for a 68% share of end-user revenue in 2026, because the category grew from retail purchases made without clinical referral. Fertility clinics and reproductive health centers represented 16%, hospital gynecology departments 10%, and employer and payer-sponsored programs 6%. Self-funded purchases remain the default route to market across most countries.
Employer and payer-sponsored programs are the fastest-expanding end user, projected at a 15.6% CAGR through 2033. Benefit administrators have added reproductive health services to packages offered by large employers, and vendors reach enrolled populations without consumer marketing spend. Institutional buyers apply closer scrutiny to data protection and interoperability than individual shoppers do. That raises the compliance bar but rewards vendors that invested early in secure architecture and clinician-facing tools.
Geography Analysis
Which Region Is Leading the Smart Fertility Trackers Market?
North America led the market with a 41% share in 2026, supported by high disposable income, dense wearable ownership and an established direct-to-consumer purchasing culture. The United States contributes the bulk of regional revenue, with Canada adding steady volume. Private reproductive health clinics operate at scale and increasingly accept home-collected data between consultations. Employer benefit programmes covering reproductive health have expanded among large corporations, which brings institutional money into a previously retail-only category. The region also hosts much of the venture funding and engineering talent behind specialist firms. Regulatory attention from the U.S. Food and Drug Administration and from consumer protection agencies has pushed vendors toward clearer claims and stronger data handling, raising buyer confidence while increasing compliance cost for smaller entrants.
Europe Pairs Strong Privacy Rules With Steady Clinical Uptake
Europe held a 27% share in 2026, with Germany, the United Kingdom, France and the Nordic countries generating most demand. Regional growth rests on public health systems that already fund reproductive health services, which normalises clinical use of home-collected measurements. Several established specialist vendors are headquartered in the region, particularly in Switzerland and Sweden. The General Data Protection Regulation sets a demanding standard for sensitive health data, and national data protection authorities examine sharing practices closely. That raises engineering cost but has become a selling point for European vendors competing internationally. The European Union medical device framework also shapes how products are classified and what claims accompany them, encouraging vendors to invest in documentation and quality systems earlier than peers elsewhere.
Which Region Is Growing Fastest in the Smart Fertility Trackers Market?
Asia Pacific is the fastest-growing region, projected to expand at a 14.4% CAGR through 2033 from a 21% share in 2026. China, Japan, South Korea, India and Australia drive most of that gain. Smartphone penetration is high, mobile payment is routine, and regional contract manufacturers supply much of the world’s wearable sensor hardware, which compresses local retail prices. Urban populations in China, Japan and South Korea are delaying parenthood against a backdrop of declining birth rates, and several governments have widened support for reproductive health services. India adds volume through a large urban middle class buying affordable connected devices online. Domestic brands compete aggressively on price, which expands the market faster than premium imports alone would.
Latin America Builds Volume Through Mobile-First Distribution
Latin America accounted for a 7% share in 2026, concentrated in Brazil, Mexico, Argentina and Chile. Growth runs through mobile-first distribution, since regional e-commerce marketplaces and app stores reach buyers that physical retail does not serve well. Subscription software and low-cost consumables suit local price points better than premium hardware bundles. Private clinics in major metropolitan areas have begun using home-collected data to reduce appointment load. Currency volatility and import duties keep imported device prices high, which pushes demand toward software-only products and regionally assembled hardware. Data protection statutes modelled on European rules have been enacted across several countries, prompting vendors to localise storage and consent processes before scaling distribution across the region.
Middle East & Africa Advances From a Small but Widening Base
Middle East & Africa held a 4% share in 2026, the smallest regional position, with demand concentrated in the United Arab Emirates, Saudi Arabia, Israel and South Africa. Gulf states are investing heavily in private healthcare infrastructure, and reproductive health clinics in Dubai, Abu Dhabi and Riyadh serve both domestic and medical tourism demand. National health transformation programmes have widened access to specialist services. South Africa anchors sub-Saharan activity through private hospital groups and urban retail pharmacy chains. Across much of the wider region, limited specialist capacity and low insurance coverage restrict uptake. Mobile network reach exceeds clinical infrastructure in many markets, so software-led products reach users ahead of connected hardware.
Competitive Landscape
The market is fragmented, with no single vendor holding a dominant share across hardware, software and consumables. Three distinct groups compete. Specialist femtech firms built the category around dedicated sensors and cycle software. Diagnostics manufacturers brought assay expertise and retail pharmacy distribution. General-purpose wearable makers arrived later, carrying installed bases far larger than any specialist could build. That third group has reset price expectations, since cycle insights now ship alongside sleep and activity metrics.
Competition centres on interpretation rather than measurement. Temperature and pulse sensing are widely available, so differentiation comes from how well software handles irregular cycles, interrupted sleep, shift work and illness. Hormone-based products compete on assay stability, reader design and consumable cost per test. Data governance has become a competitive variable in its own right, with vendors promoting on-device processing, encryption and limited third-party sharing as product attributes rather than compliance statements. Regulatory posture also separates vendors, since the claims a company chooses to make determine which oversight regime applies and how it may describe its product.
Strategic activity follows three themes. Specialist firms are adding clinician dashboards and record export so they can sell into reproductive health centers, which diversifies revenue away from consumer subscriptions. Diagnostics manufacturers are pairing existing assay lines with connected readers to capture recurring consumable sales. Wearable platform owners are opening sensor interfaces to third-party reproductive health applications, trading feature depth for ecosystem reach.
Direction of travel favours vendors that combine credible sensing, disciplined data handling and a route into clinical or employer channels. Pure consumer subscription models face rising acquisition costs as platform features commoditise basic tracking. Partnership between software specialists and hardware platforms is becoming more common than direct confrontation.
Industry Leaders
- Natural Cycles Nordic AB
- Ava AG
- Oura Health Oy
- SPD Swiss Precision Diagnostics GmbH (Clearblue)
- Quanovate Tech, Inc. (Mira)
- Valley Electronics AG (Daysy)
- Flo Health, Inc.
- BioWink GmbH (Clue)
Companies Covered in the Report
- Natural Cycles Nordic AB
- Ava AG
- Oura Health Oy
- SPD Swiss Precision Diagnostics GmbH (Clearblue)
- Quanovate Tech, Inc. (Mira)
- Valley Electronics AG (Daysy)
- Flo Health, Inc.
- BioWink GmbH (Clue)
- MFB Fertility, Inc. (Proov)
- Inito, Inc.
- Tempdrop LLC
- Fertility Focus Limited (OvuSense)
- Whoop, Inc.
- Garmin Ltd.
- Shenzhen Femometer Technology Co., Ltd.
Smart Fertility Trackers Market Report Scope
The Smart Fertility Trackers market is segmented by product type, technology, distribution channel, end user and region.
| By Product Type | Wearable Trackers, At-Home Hormone Testing Devices, Standalone Software Platforms, Accessories and Consumables |
| By Technology | Temperature-Based Sensing, Hormone Detection, Cardiorespiratory Sensing, AI-Enabled Cycle Analytics |
| By Distribution Channel | Direct-to-Consumer Online, E-Commerce Marketplaces, Retail Pharmacies and Drugstores, Clinic and Hospital Channels |
| By End User | Individual Consumers, Fertility Clinics and Reproductive Health Centers, Hospital Gynecology Departments, Employer and Payer-Sponsored Programs |
| By Region | North America, Europe, Asia Pacific, Latin America, Middle East & Africa |
1. Executive Summary
1.1 Smart Fertility Trackers Market Snapshot
1.2 Future Projections
1.3 Key Market Trends
1.4 Regional Snapshot
2. Market Overview
2.1 Market Definition and Report Scope
2.2 Historical Market Trends
2.3 Market Dynamics
2.3.1 Drivers
2.3.1.1 Later First Births Are Widening Demand for Cycle Data
2.3.1.2 Consumer Wearables Have Made Cycle Sensing a Standard Feature
2.3.2 Restraints
2.3.2.1 Reproductive Health Data Carries Serious Privacy and Legal Exposure
2.3.2.2 Regulatory Classification and Evidence Requirements Raise Entry Costs
2.3.3 Market Opportunities
2.3.3.1 Clinic and Health System Integration Opens a Second Revenue Channel
2.3.3.2 Employer and Payer Benefit Programs Expand Addressable Spending
3. Global Smart Fertility Trackers Market Outlook, 2026–2033
3.1 Global Smart Fertility Trackers Market Outlook, by Product Type, Value (US$ Billion), 2026–2033
3.1.1 Wearable Trackers
3.1.2 At-Home Hormone Testing Devices
3.1.3 Standalone Software Platforms
3.1.4 Accessories and Consumables
3.2 Global Smart Fertility Trackers Market Outlook, by Technology, Value (US$ Billion), 2026–2033
3.2.1 Temperature-Based Sensing
3.2.2 Hormone Detection
3.2.3 Cardiorespiratory Sensing
3.2.4 AI-Enabled Cycle Analytics
3.3 Global Smart Fertility Trackers Market Outlook, by Distribution Channel, Value (US$ Billion), 2026–2033
3.3.1 Direct-to-Consumer Online
3.3.2 E-Commerce Marketplaces
3.3.3 Retail Pharmacies and Drugstores
3.3.4 Clinic and Hospital Channels
3.4 Global Smart Fertility Trackers Market Outlook, by End User, Value (US$ Billion), 2026–2033
3.4.1 Individual Consumers
3.4.2 Fertility Clinics and Reproductive Health Centers
3.4.3 Hospital Gynecology Departments
3.4.4 Employer and Payer-Sponsored Programs
3.5 Global Smart Fertility Trackers Market Outlook, by Region, Value (US$ Billion), 2026–2033
3.5.1 North America
3.5.2 Europe
3.5.3 Asia Pacific
3.5.4 Latin America
3.5.5 Middle East & Africa
4. North America Smart Fertility Trackers Market Outlook, 2026–2033
4.1 North America Smart Fertility Trackers Market Outlook, by Product Type, Value (US$ Billion), 2026–2033
4.1.1 Wearable Trackers
4.1.2 At-Home Hormone Testing Devices
4.1.3 Standalone Software Platforms
4.1.4 Accessories and Consumables
4.2 North America Smart Fertility Trackers Market Outlook, by Technology, Value (US$ Billion), 2026–2033
4.2.1 Temperature-Based Sensing
4.2.2 Hormone Detection
4.2.3 Cardiorespiratory Sensing
4.2.4 AI-Enabled Cycle Analytics
4.3 North America Smart Fertility Trackers Market Outlook, by Distribution Channel, Value (US$ Billion), 2026–2033
4.3.1 Direct-to-Consumer Online
4.3.2 E-Commerce Marketplaces
4.3.3 Retail Pharmacies and Drugstores
4.3.4 Clinic and Hospital Channels
4.4 North America Smart Fertility Trackers Market Outlook, by End User, Value (US$ Billion), 2026–2033
4.4.1 Individual Consumers
4.4.2 Fertility Clinics and Reproductive Health Centers
4.4.3 Hospital Gynecology Departments
4.4.4 Employer and Payer-Sponsored Programs
4.5 North America Smart Fertility Trackers Market Outlook, by Country, Value (US$ Billion), 2026–2033
4.5.1 United States Smart Fertility Trackers Market Outlook, by Product Type, 2026–2033
4.5.2 United States Smart Fertility Trackers Market Outlook, by Technology, 2026–2033
4.5.3 United States Smart Fertility Trackers Market Outlook, by Distribution Channel, 2026–2033
4.5.4 United States Smart Fertility Trackers Market Outlook, by End User, 2026–2033
4.5.5 Canada Smart Fertility Trackers Market Outlook, by Product Type, 2026–2033
4.5.6 Canada Smart Fertility Trackers Market Outlook, by Technology, 2026–2033
4.5.7 Canada Smart Fertility Trackers Market Outlook, by Distribution Channel, 2026–2033
4.5.8 Canada Smart Fertility Trackers Market Outlook, by End User, 2026–2033
5. Europe Smart Fertility Trackers Market Outlook, 2026–2033
5.1 Europe Smart Fertility Trackers Market Outlook, by Product Type, Value (US$ Billion), 2026–2033
5.1.1 Wearable Trackers
5.1.2 At-Home Hormone Testing Devices
5.1.3 Standalone Software Platforms
5.1.4 Accessories and Consumables
5.2 Europe Smart Fertility Trackers Market Outlook, by Technology, Value (US$ Billion), 2026–2033
5.2.1 Temperature-Based Sensing
5.2.2 Hormone Detection
5.2.3 Cardiorespiratory Sensing
5.2.4 AI-Enabled Cycle Analytics
5.3 Europe Smart Fertility Trackers Market Outlook, by Distribution Channel, Value (US$ Billion), 2026–2033
5.3.1 Direct-to-Consumer Online
5.3.2 E-Commerce Marketplaces
5.3.3 Retail Pharmacies and Drugstores
5.3.4 Clinic and Hospital Channels
5.4 Europe Smart Fertility Trackers Market Outlook, by End User, Value (US$ Billion), 2026–2033
5.4.1 Individual Consumers
5.4.2 Fertility Clinics and Reproductive Health Centers
5.4.3 Hospital Gynecology Departments
5.4.4 Employer and Payer-Sponsored Programs
5.5 Europe Smart Fertility Trackers Market Outlook, by Country and Subregion, Value (US$ Billion), 2026–2033
5.5.1 Germany Smart Fertility Trackers Market Outlook, by Product Type, 2026–2033
5.5.2 Germany Smart Fertility Trackers Market Outlook, by Technology, 2026–2033
5.5.3 Germany Smart Fertility Trackers Market Outlook, by Distribution Channel, 2026–2033
5.5.4 Germany Smart Fertility Trackers Market Outlook, by End User, 2026–2033
5.5.5 United Kingdom Smart Fertility Trackers Market Outlook, by Product Type, 2026–2033
5.5.6 United Kingdom Smart Fertility Trackers Market Outlook, by Technology, 2026–2033
5.5.7 United Kingdom Smart Fertility Trackers Market Outlook, by Distribution Channel, 2026–2033
5.5.8 United Kingdom Smart Fertility Trackers Market Outlook, by End User, 2026–2033
5.5.9 France Smart Fertility Trackers Market Outlook, by Product Type, 2026–2033
5.5.10 France Smart Fertility Trackers Market Outlook, by Technology, 2026–2033
5.5.11 France Smart Fertility Trackers Market Outlook, by Distribution Channel, 2026–2033
5.5.12 France Smart Fertility Trackers Market Outlook, by End User, 2026–2033
5.5.13 Nordic countries Smart Fertility Trackers Market Outlook, by Product Type, 2026–2033
5.5.14 Nordic countries Smart Fertility Trackers Market Outlook, by Technology, 2026–2033
5.5.15 Nordic countries Smart Fertility Trackers Market Outlook, by Distribution Channel, 2026–2033
5.5.16 Nordic countries Smart Fertility Trackers Market Outlook, by End User, 2026–2033
5.5.17 Switzerland Smart Fertility Trackers Market Outlook, by Product Type, 2026–2033
5.5.18 Switzerland Smart Fertility Trackers Market Outlook, by Technology, 2026–2033
5.5.19 Switzerland Smart Fertility Trackers Market Outlook, by Distribution Channel, 2026–2033
5.5.20 Switzerland Smart Fertility Trackers Market Outlook, by End User, 2026–2033
5.5.21 Sweden Smart Fertility Trackers Market Outlook, by Product Type, 2026–2033
5.5.22 Sweden Smart Fertility Trackers Market Outlook, by Technology, 2026–2033
5.5.23 Sweden Smart Fertility Trackers Market Outlook, by Distribution Channel, 2026–2033
5.5.24 Sweden Smart Fertility Trackers Market Outlook, by End User, 2026–2033
6. Asia Pacific Smart Fertility Trackers Market Outlook, 2026–2033
6.1 Asia Pacific Smart Fertility Trackers Market Outlook, by Product Type, Value (US$ Billion), 2026–2033
6.1.1 Wearable Trackers
6.1.2 At-Home Hormone Testing Devices
6.1.3 Standalone Software Platforms
6.1.4 Accessories and Consumables
6.2 Asia Pacific Smart Fertility Trackers Market Outlook, by Technology, Value (US$ Billion), 2026–2033
6.2.1 Temperature-Based Sensing
6.2.2 Hormone Detection
6.2.3 Cardiorespiratory Sensing
6.2.4 AI-Enabled Cycle Analytics
6.3 Asia Pacific Smart Fertility Trackers Market Outlook, by Distribution Channel, Value (US$ Billion), 2026–2033
6.3.1 Direct-to-Consumer Online
6.3.2 E-Commerce Marketplaces
6.3.3 Retail Pharmacies and Drugstores
6.3.4 Clinic and Hospital Channels
6.4 Asia Pacific Smart Fertility Trackers Market Outlook, by End User, Value (US$ Billion), 2026–2033
6.4.1 Individual Consumers
6.4.2 Fertility Clinics and Reproductive Health Centers
6.4.3 Hospital Gynecology Departments
6.4.4 Employer and Payer-Sponsored Programs
6.5 Asia Pacific Smart Fertility Trackers Market Outlook, by Country, Value (US$ Billion), 2026–2033
6.5.1 China Smart Fertility Trackers Market Outlook, by Product Type, 2026–2033
6.5.2 China Smart Fertility Trackers Market Outlook, by Technology, 2026–2033
6.5.3 China Smart Fertility Trackers Market Outlook, by Distribution Channel, 2026–2033
6.5.4 China Smart Fertility Trackers Market Outlook, by End User, 2026–2033
6.5.5 Japan Smart Fertility Trackers Market Outlook, by Product Type, 2026–2033
6.5.6 Japan Smart Fertility Trackers Market Outlook, by Technology, 2026–2033
6.5.7 Japan Smart Fertility Trackers Market Outlook, by Distribution Channel, 2026–2033
6.5.8 Japan Smart Fertility Trackers Market Outlook, by End User, 2026–2033
6.5.9 South Korea Smart Fertility Trackers Market Outlook, by Product Type, 2026–2033
6.5.10 South Korea Smart Fertility Trackers Market Outlook, by Technology, 2026–2033
6.5.11 South Korea Smart Fertility Trackers Market Outlook, by Distribution Channel, 2026–2033
6.5.12 South Korea Smart Fertility Trackers Market Outlook, by End User, 2026–2033
6.5.13 India Smart Fertility Trackers Market Outlook, by Product Type, 2026–2033
6.5.14 India Smart Fertility Trackers Market Outlook, by Technology, 2026–2033
6.5.15 India Smart Fertility Trackers Market Outlook, by Distribution Channel, 2026–2033
6.5.16 India Smart Fertility Trackers Market Outlook, by End User, 2026–2033
6.5.17 Australia Smart Fertility Trackers Market Outlook, by Product Type, 2026–2033
6.5.18 Australia Smart Fertility Trackers Market Outlook, by Technology, 2026–2033
6.5.19 Australia Smart Fertility Trackers Market Outlook, by Distribution Channel, 2026–2033
6.5.20 Australia Smart Fertility Trackers Market Outlook, by End User, 2026–2033
7. Latin America Smart Fertility Trackers Market Outlook, 2026–2033
7.1 Latin America Smart Fertility Trackers Market Outlook, by Product Type, Value (US$ Billion), 2026–2033
7.1.1 Wearable Trackers
7.1.2 At-Home Hormone Testing Devices
7.1.3 Standalone Software Platforms
7.1.4 Accessories and Consumables
7.2 Latin America Smart Fertility Trackers Market Outlook, by Technology, Value (US$ Billion), 2026–2033
7.2.1 Temperature-Based Sensing
7.2.2 Hormone Detection
7.2.3 Cardiorespiratory Sensing
7.2.4 AI-Enabled Cycle Analytics
7.3 Latin America Smart Fertility Trackers Market Outlook, by Distribution Channel, Value (US$ Billion), 2026–2033
7.3.1 Direct-to-Consumer Online
7.3.2 E-Commerce Marketplaces
7.3.3 Retail Pharmacies and Drugstores
7.3.4 Clinic and Hospital Channels
7.4 Latin America Smart Fertility Trackers Market Outlook, by End User, Value (US$ Billion), 2026–2033
7.4.1 Individual Consumers
7.4.2 Fertility Clinics and Reproductive Health Centers
7.4.3 Hospital Gynecology Departments
7.4.4 Employer and Payer-Sponsored Programs
7.5 Latin America Smart Fertility Trackers Market Outlook, by Country, Value (US$ Billion), 2026–2033
7.5.1 Brazil Smart Fertility Trackers Market Outlook, by Product Type, 2026–2033
7.5.2 Brazil Smart Fertility Trackers Market Outlook, by Technology, 2026–2033
7.5.3 Brazil Smart Fertility Trackers Market Outlook, by Distribution Channel, 2026–2033
7.5.4 Brazil Smart Fertility Trackers Market Outlook, by End User, 2026–2033
7.5.5 Mexico Smart Fertility Trackers Market Outlook, by Product Type, 2026–2033
7.5.6 Mexico Smart Fertility Trackers Market Outlook, by Technology, 2026–2033
7.5.7 Mexico Smart Fertility Trackers Market Outlook, by Distribution Channel, 2026–2033
7.5.8 Mexico Smart Fertility Trackers Market Outlook, by End User, 2026–2033
7.5.9 Argentina Smart Fertility Trackers Market Outlook, by Product Type, 2026–2033
7.5.10 Argentina Smart Fertility Trackers Market Outlook, by Technology, 2026–2033
7.5.11 Argentina Smart Fertility Trackers Market Outlook, by Distribution Channel, 2026–2033
7.5.12 Argentina Smart Fertility Trackers Market Outlook, by End User, 2026–2033
7.5.13 Chile Smart Fertility Trackers Market Outlook, by Product Type, 2026–2033
7.5.14 Chile Smart Fertility Trackers Market Outlook, by Technology, 2026–2033
7.5.15 Chile Smart Fertility Trackers Market Outlook, by Distribution Channel, 2026–2033
7.5.16 Chile Smart Fertility Trackers Market Outlook, by End User, 2026–2033
8. Middle East & Africa Smart Fertility Trackers Market Outlook, 2026–2033
8.1 Middle East & Africa Smart Fertility Trackers Market Outlook, by Product Type, Value (US$ Billion), 2026–2033
8.1.1 Wearable Trackers
8.1.2 At-Home Hormone Testing Devices
8.1.3 Standalone Software Platforms
8.1.4 Accessories and Consumables
8.2 Middle East & Africa Smart Fertility Trackers Market Outlook, by Technology, Value (US$ Billion), 2026–2033
8.2.1 Temperature-Based Sensing
8.2.2 Hormone Detection
8.2.3 Cardiorespiratory Sensing
8.2.4 AI-Enabled Cycle Analytics
8.3 Middle East & Africa Smart Fertility Trackers Market Outlook, by Distribution Channel, Value (US$ Billion), 2026–2033
8.3.1 Direct-to-Consumer Online
8.3.2 E-Commerce Marketplaces
8.3.3 Retail Pharmacies and Drugstores
8.3.4 Clinic and Hospital Channels
8.4 Middle East & Africa Smart Fertility Trackers Market Outlook, by End User, Value (US$ Billion), 2026–2033
8.4.1 Individual Consumers
8.4.2 Fertility Clinics and Reproductive Health Centers
8.4.3 Hospital Gynecology Departments
8.4.4 Employer and Payer-Sponsored Programs
8.5 Middle East & Africa Smart Fertility Trackers Market Outlook, by Country and Subregion, Value (US$ Billion), 2026–2033
8.5.1 United Arab Emirates Smart Fertility Trackers Market Outlook, by Product Type, 2026–2033
8.5.2 United Arab Emirates Smart Fertility Trackers Market Outlook, by Technology, 2026–2033
8.5.3 United Arab Emirates Smart Fertility Trackers Market Outlook, by Distribution Channel, 2026–2033
8.5.4 United Arab Emirates Smart Fertility Trackers Market Outlook, by End User, 2026–2033
8.5.5 Saudi Arabia Smart Fertility Trackers Market Outlook, by Product Type, 2026–2033
8.5.6 Saudi Arabia Smart Fertility Trackers Market Outlook, by Technology, 2026–2033
8.5.7 Saudi Arabia Smart Fertility Trackers Market Outlook, by Distribution Channel, 2026–2033
8.5.8 Saudi Arabia Smart Fertility Trackers Market Outlook, by End User, 2026–2033
8.5.9 Israel Smart Fertility Trackers Market Outlook, by Product Type, 2026–2033
8.5.10 Israel Smart Fertility Trackers Market Outlook, by Technology, 2026–2033
8.5.11 Israel Smart Fertility Trackers Market Outlook, by Distribution Channel, 2026–2033
8.5.12 Israel Smart Fertility Trackers Market Outlook, by End User, 2026–2033
8.5.13 South Africa Smart Fertility Trackers Market Outlook, by Product Type, 2026–2033
8.5.14 South Africa Smart Fertility Trackers Market Outlook, by Technology, 2026–2033
8.5.15 South Africa Smart Fertility Trackers Market Outlook, by Distribution Channel, 2026–2033
8.5.16 South Africa Smart Fertility Trackers Market Outlook, by End User, 2026–2033
8.5.17 Gulf states Smart Fertility Trackers Market Outlook, by Product Type, 2026–2033
8.5.18 Gulf states Smart Fertility Trackers Market Outlook, by Technology, 2026–2033
8.5.19 Gulf states Smart Fertility Trackers Market Outlook, by Distribution Channel, 2026–2033
8.5.20 Gulf states Smart Fertility Trackers Market Outlook, by End User, 2026–2033
9. Competitive Landscape
9.1 Industry Leaders
9.2 Company Profiles
9.2.1 Natural Cycles Nordic AB
9.2.2 Ava AG
9.2.3 Oura Health Oy
9.2.4 SPD Swiss Precision Diagnostics GmbH (Clearblue)
9.2.5 Quanovate Tech, Inc. (Mira)
9.2.6 Valley Electronics AG (Daysy)
9.2.7 Flo Health, Inc.
9.2.8 BioWink GmbH (Clue)
9.2.9 MFB Fertility, Inc. (Proov)
9.2.10 Inito, Inc.
9.2.11 Tempdrop LLC
9.2.12 Fertility Focus Limited (OvuSense)
9.2.13 Whoop, Inc.
9.2.14 Garmin Ltd.
9.2.15 Shenzhen Femometer Technology Co., Ltd.
10. Appendix
10.1 Research Methodology
10.2 Report Assumptions
10.3 Acronyms and Abbreviations
| By Product Type | Wearable Trackers, At-Home Hormone Testing Devices, Standalone Software Platforms, Accessories and Consumables |
| By Technology | Temperature-Based Sensing, Hormone Detection, Cardiorespiratory Sensing, AI-Enabled Cycle Analytics |
| By Distribution Channel | Direct-to-Consumer Online, E-Commerce Marketplaces, Retail Pharmacies and Drugstores, Clinic and Hospital Channels |
| By End User | Individual Consumers, Fertility Clinics and Reproductive Health Centers, Hospital Gynecology Departments, Employer and Payer-Sponsored Programs |
| By Region | North America, Europe, Asia Pacific, Latin America, Middle East & Africa |
Our Research Methodology
Considering the volatility of business today, traditional approaches to strategizing a game plan can be unfruitful if not detrimental. True ambiguity is no way to determine a forecast. A myriad of predetermined factors must be accounted for such as the degree of risk involved, the magnitude of circumstances, as well as conditions or consequences that are not known or unpredictable. To circumvent binary views that cast uncertainty, the application of market research intelligence to strategically posture, move, and enable actionable outcomes is necessary.
View Methodology
Quality Assured
Rigorous Validation Process

Confidentiality Assured
End-to-end Data Security

Custom Research Services
Tailored To Your Objectives
FAQs
The market is valued at US$ 1.42 billion in 2026, supported by wearable sensing adoption, quantitative home hormone testing and recurring subscription software revenue.
The market is projected to grow at an 11.8% CAGR between 2026 and 2033, reaching US$ 3.10 billion by the end of the forecast period.
Wearable trackers led with a 38% share in 2026, since passive overnight temperature and pulse sensing needs no daily action from the user.
Asia Pacific is growing fastest at a 14.4% CAGR through 2033, helped by smartphone penetration, local hardware manufacturing and competitive domestic pricing.
The market is fragmented, with specialist femtech firms, diagnostics manufacturers and general-purpose wearable makers competing across hardware, software and consumable revenue streams.
Related Reports
Endodontic Instruments Market Size, Share, Insights, Competitive Landscape, and Forecast 2026 to 2033
Explore the endodontic instruments market, forecast to reach US$2.19 billion by 2033 at 6.4% CAGR, with product, application, and regional insights.
Blood Transfusion Diagnostics Market Size, Share, Insights, Competitive Landscape, and Forecast 2026 to 2033
Explore the blood transfusion diagnostics market, forecast to reach US$7.4 billion by 2033 at 6.4% CAGR, with insights on products, tests, and regions.
Ankle Splints Market Size, Share, Insights, Competitive Landscape, and Forecast 2026 to 2033
Explore the ankle splints market, forecast to reach US$2.30 billion by 2033 at 6.6% CAGR, with insights on products, applications, channels, and regions.
ACL Reconstruction Market Size, Share, Insights, Competitive Landscape, and Forecast 2026 to 2033
Explore the ACL reconstruction market, forecast to reach US$14.04 billion by 2033 at 6.9% CAGR, with insights on grafts, fixation, end users, and regions.
Stroke Diagnostics and Therapeutics Market Size, Share, Insights, Competitive Landscape, and Forecast 2026 to 2033
Explore the stroke diagnostics and therapeutics market, forecast to reach US$81.70 billion by 2033 at 7.9% CAGR, with insights on types and regions.
IoT Medical Devices Market Size, Share, Insights, Competitive Landscape, and Forecast 2026 to 2033
Explore the IoT medical devices market, forecast to reach US$259.93 billion by 2033 at 18.9% CAGR, with insights on products, connectivity, and regions.