



Bus Rapid Transit (BRT) Market
Bus Rapid Transit (BRT) Market Size, Share, Insights, Competitive Landscape, and Forecast 2026 to 2033
Bus Rapid Transit (BRT) Market Analysis, 2026–2033
Bus Rapid Transit (BRT) Market Size and Trend Analysis
How Fast Is the Bus Rapid Transit (BRT) Market Growing?
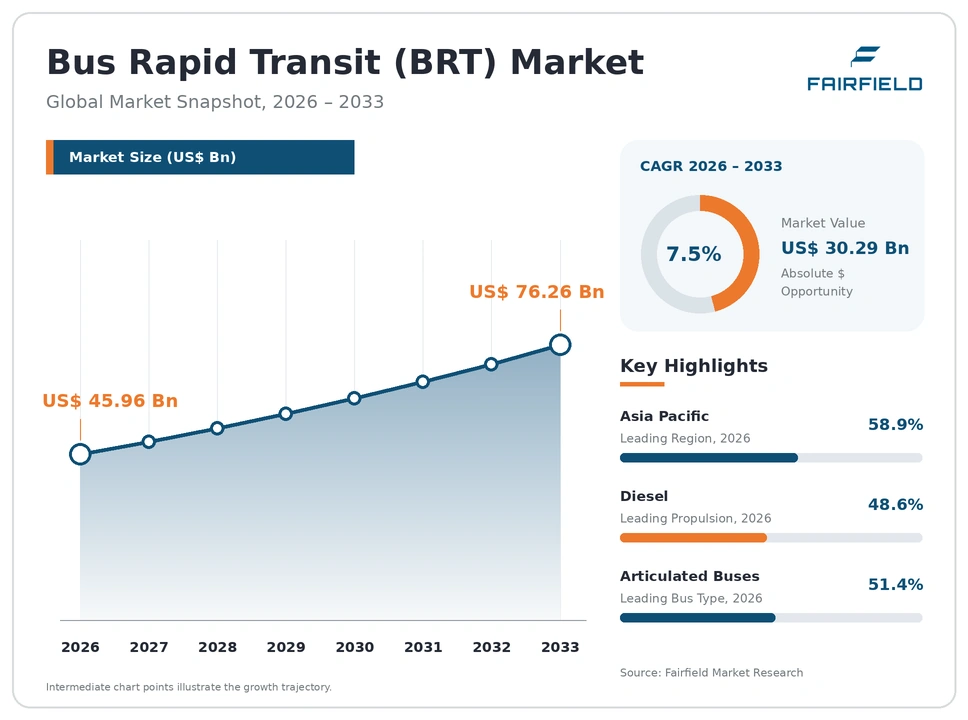
The global bus rapid transit (BRT) market size is expected to be valued at US$ 45.96 billion in 2026 and projected to reach US$ 76.26 billion by 2033, growing at a CAGR of 7.5% between 2026 and 2033.
Between 2020 and 2025, the market grew at a CAGR of about 5.9%, as ridership fell sharply during the pandemic and then recovered while cities resumed corridor projects. Three factors now drive growth: rapid urbanization, the lower cost of BRT compared with metro rail, and the shift to electric buses under climate targets. The market is moving toward zero-emission buses, larger articulated buses, and digital systems such as signal priority and contactless fare collection. Cities increasingly link BRT corridors with transit-oriented development to raise ridership and land value.
Key Report Takeaways
- By Propulsion: Diesel held 48.6% share in 2026, while Electric is projected to expand at a 14.2% CAGR through 2033, driven by falling battery costs, climate targets, and development bank funding.
- By Bus Type: Articulated Buses held 51.4% share in 2026, while Bi-articulated Buses are projected to expand at a 9.1% CAGR through 2033, driven by high-capacity corridors in growing cities.
- By Application: Urban held 72.6% share in 2026, while Suburban & Regional is projected to expand at a 8.6% CAGR through 2033, driven by metropolitan expansion and new commuter corridors.
- By Region: Asia Pacific held 58.9% share in 2026, while India is projected to expand at a 10.4% CAGR through 2033, driven by national electric bus programs and new urban corridors.
Global Bus Rapid Transit (BRT) Market Trends and Insights
Drivers Impact Analysis
Two drivers carry the strongest influence on bus rapid transit demand during the forecast period.
| Driver | Impact on CAGR Forecast | Geographic Relevance | Impact Timeline |
| Urbanization and low-cost mass transit needs | High | Asia Pacific, Latin America, Middle East & Africa | Long term (≥4 years) |
| Electrification and climate targets | High | Asia Pacific, Europe, North America | Medium term (2-4 years) |
Urbanization and Low-cost Mass Transit Are Driving the Bus Rapid Transit Market
Urbanization and the need for low-cost mass transit are the strongest drivers of the bus rapid transit market. Fast-growing cities need high-capacity public transport but often cannot afford metro rail.
The mechanism is cost and speed of delivery. A BRT corridor typically costs a fraction of a metro line per kilometer and can be built in a few years rather than a decade. Dedicated bus lanes, level boarding, off-board fare collection, and signal priority let buses carry large numbers of passengers quickly. Cities in India, Indonesia, Brazil, Mexico, Nigeria, and Tanzania face congestion as populations grow. Development banks such as the World Bank and the Asian Development Bank finance BRT projects because they deliver high ridership per dollar. These factors make BRT a preferred option for cities expanding mass transit.
Electrification and Climate Targets Are Expanding the Bus Rapid Transit Market
Electrification and climate targets are expanding the bus rapid transit market. Cities are replacing diesel fleets with electric buses to cut emissions and improve air quality.
The cause is policy support and falling vehicle costs. Many cities have committed to buying only zero-emission buses by 2030 or earlier. Battery prices have fallen, and the total cost of ownership of electric buses is now close to or below diesel in many markets. BRT corridors suit electric buses because routes are fixed, depots are centralized, and charging can be planned. China has largely electrified its city bus fleets, and Latin America cities such as Bogotá and Santiago operate large electric fleets. The Miami-Dade South Corridor became the first fully electric BRT line in the United States in 2025, showing how electric fleets can serve long suburban corridors.
Restraints Impact Analysis
Two restraints limit how quickly the bus rapid transit market grows.
| Restraint | Impact on CAGR Forecast | Geographic Relevance | Impact Timeline |
| High upfront costs and funding constraints | High | Latin America, Middle East & Africa, Asia Pacific | Short term (≤2 years) |
| Political resistance and road space conflicts | Medium | North America, Europe | Medium term (2-4 years) |
High Upfront Costs and Funding Gaps Slow the Bus Rapid Transit Market
High upfront costs and funding constraints slow the bus rapid transit market. Even though BRT is cheaper than rail, corridors, stations, depots, and fleets still require large investment.
The specific causes are limited city budgets and expensive electric fleets. Electric buses cost much more upfront than diesel buses, and charging depots require grid upgrades. Many cities in Africa, Pakistan, Bangladesh, and Latin America depend on loans from development banks, which take years to approve. Currency weakness raises the cost of imported buses and equipment. Operating subsidies are often needed to keep fares affordable, putting pressure on city finances. Delays in land acquisition and utility relocation add costs. Some projects, such as BRT systems in Lagos and Dar es Salaam, have faced fleet shortages and service problems due to funding gaps.
Political Resistance and Road Space Conflicts Restrict the Bus Rapid Transit Market
Political resistance and road space conflicts restrict the bus rapid transit market. BRT takes lanes away from cars, which can create opposition from drivers and businesses.
The underlying causes are competing road users and changing political priorities. Shop owners often fear that removing parking and traffic lanes will hurt business. Drivers oppose lane reallocation, especially in car-dependent cities in North America. Elections can lead to project cancellations or downgrades, with dedicated lanes replaced by mixed traffic. Weak enforcement of dedicated bus lanes reduces speed and reliability, lowering public support. Poorly designed systems with overcrowded buses, long waits, and unsafe stations damage BRT’s reputation. Some cities choose light rail instead because it is seen as more permanent and more likely to attract investment. These factors delay or weaken new BRT corridors.
Market Opportunities
Electric BRT Fleets and Charging Infrastructure Open a Major Revenue Pool
Electric BRT fleets and charging infrastructure open a major revenue pool in the bus rapid transit market. Cities need high-capacity electric buses, depot chargers, and energy management systems.
Bus makers, charger suppliers, and energy companies can capture this opportunity. Electric articulated and bi-articulated buses command higher prices than diesel models. Volvo Buses won its first order for electric bi-articulated buses in Brazil in 2025. Opportunity charging at terminals, depot charging, and battery leasing create additional revenue streams. Development banks and climate funds increasingly finance electric fleets, as with the World Bank-supported Karachi Yellow Line project. Fleet leasing models separate vehicle ownership from operations, reducing upfront costs for cities. Suppliers that offer buses, chargers, and maintenance as one package can win long-term contracts and repeat fleet orders.
Digital Systems and Transit-oriented Development Create a Systems Revenue Pool
Digital systems and transit-oriented development create a systems revenue pool in the bus rapid transit market. BRT corridors need technology and land development to reach full potential.
Technology suppliers and developers can capture this opportunity. Intelligent transport systems, including signal priority, real-time passenger information, automated fare collection, and fleet management software, improve speed and reliability. Contactless and mobile ticketing reduce boarding times. Data analytics help operators plan routes and schedules. Cities also use BRT corridors to encourage housing and commercial development near stations, raising ridership and land value. Real estate developers and city governments share the benefits through value capture financing. Suppliers that combine hardware, software, and planning services can win corridor-wide contracts. Upgrading older corridors with modern systems offers a further revenue stream, since many early BRT systems in Latin America and Asia Pacific now need technology renewal.
Segment Analysis
By Propulsion: Diesel Leads While Electric Gains Momentum
Diesel held 48.6% share in 2026. Diesel buses remain common in BRT systems across Latin America, Africa, and India because they are cheaper to buy and need no charging infrastructure. Many existing fleets still have years of service life left. Natural gas and hybrid buses form a middle option in several cities.
Electric is the fastest-growing propulsion type, expanding at a 14.2% CAGR through 2033. Falling battery costs, climate targets, and development bank funding are pushing cities toward electric buses. China leads electric BRT adoption, and cities in Colombia, Chile, Brazil, India, and the United States are expanding electric fleets. BYD, Yutong, and Volvo Buses supply electric BRT models. For the market, electrification raises vehicle values and creates demand for charging systems.
By Bus Type: Articulated Buses Lead While Bi-articulated Buses Grow Fastest
Articulated Buses held 51.4% share in 2026. Articulated buses, typically 18 meters long, carry more passengers than standard buses and are the most common BRT vehicle. They suit busy corridors in cities such as Mexico City, Jakarta, and Istanbul. Standard 12-meter buses serve feeder routes and smaller systems.
Bi-articulated Buses are the fastest-growing bus type, expanding at a 9.1% CAGR through 2033. These buses, about 25 to 28 meters long, carry up to around 250 passengers and suit the busiest corridors. Curitiba, Bogotá, and São Paulo operate bi-articulated fleets, and electric versions are now entering service. Volvo Buses and Marcopolo supply bodies and chassis. For the market, larger buses raise capacity without building rail.
By Application: Urban Leads While Suburban & Regional Grows Fastest
Urban held 72.6% share in 2026. Most BRT systems run within city centers and dense urban corridors, where congestion is highest and ridership is strongest. Cities such as Bogotá, Guangzhou, Ahmedabad, and Istanbul operate large urban networks. Urban corridors also attract the most funding.
Suburban & Regional is the fastest-growing application, expanding at a 8.6% CAGR through 2033. As cities expand outward, BRT lines connect suburbs, satellite towns, and airports with city centers. Projects in North America, such as the Miami-Dade South Corridor and the Utah Transit Authority Midvalley Express, serve fast-growing suburbs. Regional lines often use highway shoulders or dedicated busways. For the market, suburban growth extends BRT into new areas where rail is too costly.
Geography Analysis
North America Expands the Bus Rapid Transit Market With Electric Corridors
North America is a growing bus rapid transit market where cities use BRT as a cheaper alternative to light rail. The United States has expanded BRT through federal funding from the Federal Transit Administration. Miami-Dade opened the first fully electric BRT line in 2025, and the Utah Transit Authority opened its electric Midvalley Express in 2026. Cities such as Minneapolis, Indianapolis, and Atlanta are building new lines. New Flyer and Gillig supply buses. Canada has BRT systems in Ottawa, Brampton, and Edmonton. One change shaping the region is the shift to battery-electric fleets.
Europe Advances the Bus Rapid Transit Market Through Zero-emission Fleets
Europe is a mature bus rapid transit market where cities often brand BRT as high-quality bus services. France has developed many “Bus à Haut Niveau de Service” lines in cities such as Nantes, Metz, and Thionville. Turkey, the United Kingdom, Spain, and Sweden also operate BRT-style corridors, with Istanbul running one of the busiest systems in the world. European Union rules require public buyers to purchase a share of clean buses. Solaris, Daimler Buses, Volvo Buses, and Irizar supply electric models. One opportunity is converting existing corridors to electric operation.
Which Region Is Leading the Bus Rapid Transit Market?
Asia Pacific is leading the bus rapid transit market with a 58.9% share in 2026. China has the largest number of BRT systems, in cities such as Guangzhou, Xiamen, and Lanzhou, and leading bus makers Yutong, BYD, and Zhongtong. Indonesia operates TransJakarta, one of the longest BRT networks in the world. Pakistan runs BRT systems in Lahore, Peshawar, and Karachi, where the World Bank supports the Yellow Line with 256 electric buses. India is growing fastest, as detailed below. Bangladesh is completing its first BRT line in Dhaka, and Vietnam and the Philippines are planning new corridors. One change shaping the region is rapid fleet electrification.
Which Country Is Growing Fastest in the Bus Rapid Transit Market?
India is growing fastest in the bus rapid transit market at a 10.4% CAGR through 2033. The PM e-Bus Sewa scheme supports 10,000 electric buses for cities, and the PM e-DRIVE program funds more electric buses. BRT systems operate in Ahmedabad, Surat, Pune, Indore, and Bhopal, and new corridors are planned. Tata Motors, Olectra Greentech, JBM Auto, and PMI Electro Mobility supply electric buses. Gross cost contracts let private operators run electric buses while cities pay per kilometer, lowering upfront costs. Road space conflicts and weak lane enforcement remain challenges. One opportunity is electric BRT for fast-growing mid-sized cities.
Latin America Pioneers the Bus Rapid Transit Market With High-capacity Systems
Latin America is a major bus rapid transit market and the birthplace of modern BRT. Curitiba in Brazil pioneered the concept, and Bogotá’s TransMilenio is one of the world’s busiest BRT systems. Mexico City’s Metrobús, Santiago, Quito, and Lima operate large networks. Colombia and Chile have large electric bus fleets supplied by BYD and Yutong. Marcopolo and Volvo Buses build bodies and chassis in Brazil. Many systems run near capacity at peak hours, and fleets need renewal. Key barriers include funding constraints, overcrowding, and fare evasion. Volvo Buses began building electric BRT buses at its Curitiba plant in 2025. One opportunity is electric bi-articulated buses for busy corridors.
Middle East & Africa Builds the Bus Rapid Transit Market Through New Systems
Middle East & Africa is an emerging bus rapid transit market where development banks finance new systems. Senegal opened an electric BRT in Dakar in 2024, using buses from CRRC. Tanzania operates the Dar es Salaam BRT, and Nigeria runs BRT in Lagos. South Africa has systems in Johannesburg and Cape Town. Saudi Arabia has opened BRT corridors in Riyadh as part of its wider public transport program, and Morocco runs BRT in Casablanca and Marrakech. Kenya, Uganda, and Ghana are planning or building new corridors. Key barriers include funding gaps, fleet shortages, and competition from informal minibus operators. One opportunity is electric BRT supported by climate finance.
Competitive Landscape
The bus rapid transit market is moderately concentrated. Volvo Buses, Yutong, BYD, Daimler Buses, and Marcopolo lead in BRT vehicles, while MAN Truck & Bus, Scania, Zhongtong, CRRC, Tata Motors, New Flyer, and Solaris compete in regional markets. Technology firms such as Siemens Mobility and Kapsch supply traffic and fare systems.
Companies compete on vehicle capacity, battery range, charging solutions, total cost of ownership, local production, financing, and after-sales service. Local assembly matters because many tenders favor domestic content. Chinese makers compete strongly on price for electric buses, while European makers compete on quality, service, and local factories in Latin America and India.
Strategic moves show how competition is changing. In August 2025, Volvo Buses won its first order for electric articulated and bi-articulated buses in Brazil, for Goiânia’s BRT. In October 2025, Miami-Dade launched the first fully electric BRT line in the United States. In June 2026, Karachi moved to procure 256 electric buses for its Yellow Line BRT with World Bank support. These moves show competition shifting toward electric, high-capacity fleets financed by public budgets, development banks, and climate funds. BYD and Yutong continue to win large electric bus tenders in Latin America and Asia Pacific, often supported by competitive financing terms.
Three themes shape vendor strategy. First, companies are expanding electric articulated and bi-articulated models. Second, they are offering charging and financing packages. Third, they are increasing local production to win tenders.
Bus Rapid Transit (BRT) Market Industry Leaders
- Volvo Buses
- Yutong
- BYD
- Daimler Buses
- Marcopolo
Recent Industry Developments
- June 2026: Karachi’s Yellow Line BRT project moved to procure 256 electric buses with World Bank support - expands electric BRT in Pakistan.
- June 2026: Utah Transit Authority opened the all-electric Midvalley Express BRT - adds a third BRT line to its network.
- October 2025: Miami-Dade County launched an all-electric BRT on the 20-mile South Corridor - the first fully electric BRT in the United States.
- August 2025: Volvo Buses won an order for 21 electric articulated and bi-articulated buses for Goiânia - its first electric BRT bus order in Brazil.
Companies Covered in the Report
- Volvo Buses
- Yutong
- BYD
- Daimler Buses
- Marcopolo
- MAN Truck & Bus
- Scania
- Zhongtong Bus
- CRRC
- Tata Motors
- New Flyer
- Solaris Bus & Coach
Bus Rapid Transit (BRT) Market Report Scope
This report covers bus rapid transit vehicles, including standard, articulated, and bi-articulated buses powered by diesel, natural gas, hybrid, and electric drivetrains, used on urban and suburban BRT corridors. It excludes conventional city buses on mixed-traffic routes, coaches, trolleybuses on fixed wires, and civil construction of corridors. The base year is 2025, and the forecast period runs from 2026 to 2033. All values are expressed in US$ Billion.
Propulsion
- Diesel
- Natural Gas
- Hybrid
- Electric
Bus Type
- Standard Buses
- Articulated Buses
- Bi-articulated Buses
Application
- Urban
- Suburban & Regional
Regions
- North America
- Europe
- Asia Pacific
- Latin America
- Middle East & Africa
Key Questions Answered in the Report
How big is the bus rapid transit market in 2026?
The bus rapid transit market is valued at US$ 45.96 billion in 2026, led by urban corridors and articulated diesel and electric buses.
What is the bus rapid transit market forecast to 2033?
The market is projected to reach US$ 76.26 billion by 2033, growing at a 7.5% CAGR and adding US$ 30.29 billion.
Which propulsion type is growing fastest in bus rapid transit?
Electric is growing fastest at a 14.2% CAGR through 2033, driven by falling battery costs, climate targets, and development bank funding.
Which country is growing fastest in the bus rapid transit market?
India is growing fastest at a 10.4% CAGR through 2033, driven by national electric bus programs and new urban BRT corridors.
Which region holds the largest bus rapid transit market share?
Asia Pacific holds the largest share at 58.9% in 2026, supported by large BRT networks in China, Indonesia, and Pakistan.
1. Executive Summary
1.1. Global Bus Rapid Transit (BRT) Market Snapshot
1.2. Future Projections
1.3. Key Report Takeaways
1.4. Regional Snapshot
2. Market Overview
2.1. Market Definition and Report Scope
2.2. Historical Trends 2020–2025
2.3. Market Dynamics
2.3.1. Drivers
2.3.1.1. Urbanization and Low-cost Mass Transit Are Driving the Bus Rapid Transit Market
2.3.1.2. Electrification and Climate Targets Are Expanding the Bus Rapid Transit Market
2.3.2. Restraints
2.3.2.1. High Upfront Costs and Funding Gaps Slow the Bus Rapid Transit Market
2.3.2.2. Political Resistance and Road Space Conflicts Restrict the Bus Rapid Transit Market
2.3.3. Market Opportunities
2.3.3.1. Electric BRT Fleets and Charging Infrastructure Open a Major Revenue Pool
2.3.3.2. Digital Systems and Transit-oriented Development Create a Systems Revenue Pool
3. Global Bus Rapid Transit (BRT) Market Outlook, 2020-2033
3.1. Global Bus Rapid Transit (BRT) Market Outlook, by Propulsion, Value (US$ Billion), 2020-2033
3.1.1. Diesel
3.1.2. Natural Gas
3.1.3. Hybrid
3.1.4. Electric
3.2. Global Bus Rapid Transit (BRT) Market Outlook, by Bus Type, Value (US$ Billion), 2020-2033
3.2.1. Standard Buses
3.2.2. Articulated Buses
3.2.3. Bi-articulated Buses
3.3. Global Bus Rapid Transit (BRT) Market Outlook, by Application, Value (US$ Billion), 2020-2033
3.3.1. Urban
3.3.2. Suburban & Regional
3.4. Global Bus Rapid Transit (BRT) Market Outlook, by Region, Value (US$ Billion), 2020-2033
3.4.1. North America
3.4.2. Europe
3.4.3. Asia Pacific
3.4.4. Latin America
3.4.5. Middle East & Africa
4. North America Bus Rapid Transit (BRT) Market Outlook, 2020-2033
4.1. North America Bus Rapid Transit (BRT) Market Outlook, by Propulsion, Value (US$ Billion), 2020-2033
4.1.1. Diesel
4.1.2. Natural Gas
4.1.3. Hybrid
4.1.4. Electric
4.2. North America Bus Rapid Transit (BRT) Market Outlook, by Bus Type, Value (US$ Billion), 2020-2033
4.2.1. Standard Buses
4.2.2. Articulated Buses
4.2.3. Bi-articulated Buses
4.3. North America Bus Rapid Transit (BRT) Market Outlook, by Application, Value (US$ Billion), 2020-2033
4.3.1. Urban
4.3.2. Suburban & Regional
4.4. North America Bus Rapid Transit (BRT) Market Outlook, by Country, Value (US$ Billion), 2020-2033
4.4.1. United States Bus Rapid Transit (BRT) Market Outlook, by Propulsion, 2020-2033
4.4.2. United States Bus Rapid Transit (BRT) Market Outlook, by Bus Type, 2020-2033
4.4.3. United States Bus Rapid Transit (BRT) Market Outlook, by Application, 2020-2033
4.4.4. Canada Bus Rapid Transit (BRT) Market Outlook, by Propulsion, 2020-2033
4.4.5. Canada Bus Rapid Transit (BRT) Market Outlook, by Bus Type, 2020-2033
4.4.6. Canada Bus Rapid Transit (BRT) Market Outlook, by Application, 2020-2033
5. Europe Bus Rapid Transit (BRT) Market Outlook, 2020-2033
5.1. Europe Bus Rapid Transit (BRT) Market Outlook, by Propulsion, Value (US$ Billion), 2020-2033
5.1.1. Diesel
5.1.2. Natural Gas
5.1.3. Hybrid
5.1.4. Electric
5.2. Europe Bus Rapid Transit (BRT) Market Outlook, by Bus Type, Value (US$ Billion), 2020-2033
5.2.1. Standard Buses
5.2.2. Articulated Buses
5.2.3. Bi-articulated Buses
5.3. Europe Bus Rapid Transit (BRT) Market Outlook, by Application, Value (US$ Billion), 2020-2033
5.3.1. Urban
5.3.2. Suburban & Regional
5.4. Europe Bus Rapid Transit (BRT) Market Outlook, by Country, Value (US$ Billion), 2020-2033
5.4.1. France Bus Rapid Transit (BRT) Market Outlook, by Propulsion, 2020-2033
5.4.2. France Bus Rapid Transit (BRT) Market Outlook, by Bus Type, 2020-2033
5.4.3. France Bus Rapid Transit (BRT) Market Outlook, by Application, 2020-2033
5.4.4. Turkey Bus Rapid Transit (BRT) Market Outlook, by Propulsion, 2020-2033
5.4.5. Turkey Bus Rapid Transit (BRT) Market Outlook, by Bus Type, 2020-2033
5.4.6. Turkey Bus Rapid Transit (BRT) Market Outlook, by Application, 2020-2033
5.4.7. United Kingdom Bus Rapid Transit (BRT) Market Outlook, by Propulsion, 2020-2033
5.4.8. United Kingdom Bus Rapid Transit (BRT) Market Outlook, by Bus Type, 2020-2033
5.4.9. United Kingdom Bus Rapid Transit (BRT) Market Outlook, by Application, 2020-2033
5.4.10. Spain Bus Rapid Transit (BRT) Market Outlook, by Propulsion, 2020-2033
5.4.11. Spain Bus Rapid Transit (BRT) Market Outlook, by Bus Type, 2020-2033
5.4.12. Spain Bus Rapid Transit (BRT) Market Outlook, by Application, 2020-2033
5.4.13. Sweden Bus Rapid Transit (BRT) Market Outlook, by Propulsion, 2020-2033
5.4.14. Sweden Bus Rapid Transit (BRT) Market Outlook, by Bus Type, 2020-2033
5.4.15. Sweden Bus Rapid Transit (BRT) Market Outlook, by Application, 2020-2033
6. Asia Pacific Bus Rapid Transit (BRT) Market Outlook, 2020-2033
6.1. Asia Pacific Bus Rapid Transit (BRT) Market Outlook, by Propulsion, Value (US$ Billion), 2020-2033
6.1.1. Diesel
6.1.2. Natural Gas
6.1.3. Hybrid
6.1.4. Electric
6.2. Asia Pacific Bus Rapid Transit (BRT) Market Outlook, by Bus Type, Value (US$ Billion), 2020-2033
6.2.1. Standard Buses
6.2.2. Articulated Buses
6.2.3. Bi-articulated Buses
6.3. Asia Pacific Bus Rapid Transit (BRT) Market Outlook, by Application, Value (US$ Billion), 2020-2033
6.3.1. Urban
6.3.2. Suburban & Regional
6.4. Asia Pacific Bus Rapid Transit (BRT) Market Outlook, by Country, Value (US$ Billion), 2020-2033
6.4.1. China Bus Rapid Transit (BRT) Market Outlook, by Propulsion, 2020-2033
6.4.2. China Bus Rapid Transit (BRT) Market Outlook, by Bus Type, 2020-2033
6.4.3. China Bus Rapid Transit (BRT) Market Outlook, by Application, 2020-2033
6.4.4. Indonesia Bus Rapid Transit (BRT) Market Outlook, by Propulsion, 2020-2033
6.4.5. Indonesia Bus Rapid Transit (BRT) Market Outlook, by Bus Type, 2020-2033
6.4.6. Indonesia Bus Rapid Transit (BRT) Market Outlook, by Application, 2020-2033
6.4.7. Pakistan Bus Rapid Transit (BRT) Market Outlook, by Propulsion, 2020-2033
6.4.8. Pakistan Bus Rapid Transit (BRT) Market Outlook, by Bus Type, 2020-2033
6.4.9. Pakistan Bus Rapid Transit (BRT) Market Outlook, by Application, 2020-2033
6.4.10. India Bus Rapid Transit (BRT) Market Outlook, by Propulsion, 2020-2033
6.4.11. India Bus Rapid Transit (BRT) Market Outlook, by Bus Type, 2020-2033
6.4.12. India Bus Rapid Transit (BRT) Market Outlook, by Application, 2020-2033
6.4.13. Bangladesh Bus Rapid Transit (BRT) Market Outlook, by Propulsion, 2020-2033
6.4.14. Bangladesh Bus Rapid Transit (BRT) Market Outlook, by Bus Type, 2020-2033
6.4.15. Bangladesh Bus Rapid Transit (BRT) Market Outlook, by Application, 2020-2033
6.4.16. Vietnam Bus Rapid Transit (BRT) Market Outlook, by Propulsion, 2020-2033
6.4.17. Vietnam Bus Rapid Transit (BRT) Market Outlook, by Bus Type, 2020-2033
6.4.18. Vietnam Bus Rapid Transit (BRT) Market Outlook, by Application, 2020-2033
6.4.19. Philippines Bus Rapid Transit (BRT) Market Outlook, by Propulsion, 2020-2033
6.4.20. Philippines Bus Rapid Transit (BRT) Market Outlook, by Bus Type, 2020-2033
6.4.21. Philippines Bus Rapid Transit (BRT) Market Outlook, by Application, 2020-2033
7. Latin America Bus Rapid Transit (BRT) Market Outlook, 2020-2033
7.1. Latin America Bus Rapid Transit (BRT) Market Outlook, by Propulsion, Value (US$ Billion), 2020-2033
7.1.1. Diesel
7.1.2. Natural Gas
7.1.3. Hybrid
7.1.4. Electric
7.2. Latin America Bus Rapid Transit (BRT) Market Outlook, by Bus Type, Value (US$ Billion), 2020-2033
7.2.1. Standard Buses
7.2.2. Articulated Buses
7.2.3. Bi-articulated Buses
7.3. Latin America Bus Rapid Transit (BRT) Market Outlook, by Application, Value (US$ Billion), 2020-2033
7.3.1. Urban
7.3.2. Suburban & Regional
7.4. Latin America Bus Rapid Transit (BRT) Market Outlook, by Country, Value (US$ Billion), 2020-2033
7.4.1. Brazil Bus Rapid Transit (BRT) Market Outlook, by Propulsion, 2020-2033
7.4.2. Brazil Bus Rapid Transit (BRT) Market Outlook, by Bus Type, 2020-2033
7.4.3. Brazil Bus Rapid Transit (BRT) Market Outlook, by Application, 2020-2033
7.4.4. Colombia Bus Rapid Transit (BRT) Market Outlook, by Propulsion, 2020-2033
7.4.5. Colombia Bus Rapid Transit (BRT) Market Outlook, by Bus Type, 2020-2033
7.4.6. Colombia Bus Rapid Transit (BRT) Market Outlook, by Application, 2020-2033
7.4.7. Chile Bus Rapid Transit (BRT) Market Outlook, by Propulsion, 2020-2033
7.4.8. Chile Bus Rapid Transit (BRT) Market Outlook, by Bus Type, 2020-2033
7.4.9. Chile Bus Rapid Transit (BRT) Market Outlook, by Application, 2020-2033
8. Middle East & Africa Bus Rapid Transit (BRT) Market Outlook, 2020-2033
8.1. Middle East & Africa Bus Rapid Transit (BRT) Market Outlook, by Propulsion, Value (US$ Billion), 2020-2033
8.1.1. Diesel
8.1.2. Natural Gas
8.1.3. Hybrid
8.1.4. Electric
8.2. Middle East & Africa Bus Rapid Transit (BRT) Market Outlook, by Bus Type, Value (US$ Billion), 2020-2033
8.2.1. Standard Buses
8.2.2. Articulated Buses
8.2.3. Bi-articulated Buses
8.3. Middle East & Africa Bus Rapid Transit (BRT) Market Outlook, by Application, Value (US$ Billion), 2020-2033
8.3.1. Urban
8.3.2. Suburban & Regional
8.4. Middle East & Africa Bus Rapid Transit (BRT) Market Outlook, by Country, Value (US$ Billion), 2020-2033
8.4.1. Senegal Bus Rapid Transit (BRT) Market Outlook, by Propulsion, 2020-2033
8.4.2. Senegal Bus Rapid Transit (BRT) Market Outlook, by Bus Type, 2020-2033
8.4.3. Senegal Bus Rapid Transit (BRT) Market Outlook, by Application, 2020-2033
8.4.4. Tanzania Bus Rapid Transit (BRT) Market Outlook, by Propulsion, 2020-2033
8.4.5. Tanzania Bus Rapid Transit (BRT) Market Outlook, by Bus Type, 2020-2033
8.4.6. Tanzania Bus Rapid Transit (BRT) Market Outlook, by Application, 2020-2033
8.4.7. Nigeria Bus Rapid Transit (BRT) Market Outlook, by Propulsion, 2020-2033
8.4.8. Nigeria Bus Rapid Transit (BRT) Market Outlook, by Bus Type, 2020-2033
8.4.9. Nigeria Bus Rapid Transit (BRT) Market Outlook, by Application, 2020-2033
8.4.10. South Africa Bus Rapid Transit (BRT) Market Outlook, by Propulsion, 2020-2033
8.4.11. South Africa Bus Rapid Transit (BRT) Market Outlook, by Bus Type, 2020-2033
8.4.12. South Africa Bus Rapid Transit (BRT) Market Outlook, by Application, 2020-2033
8.4.13. Saudi Arabia Bus Rapid Transit (BRT) Market Outlook, by Propulsion, 2020-2033
8.4.14. Saudi Arabia Bus Rapid Transit (BRT) Market Outlook, by Bus Type, 2020-2033
8.4.15. Saudi Arabia Bus Rapid Transit (BRT) Market Outlook, by Application, 2020-2033
8.4.16. Morocco Bus Rapid Transit (BRT) Market Outlook, by Propulsion, 2020-2033
8.4.17. Morocco Bus Rapid Transit (BRT) Market Outlook, by Bus Type, 2020-2033
8.4.18. Morocco Bus Rapid Transit (BRT) Market Outlook, by Application, 2020-2033
8.4.19. Kenya Bus Rapid Transit (BRT) Market Outlook, by Propulsion, 2020-2033
8.4.20. Kenya Bus Rapid Transit (BRT) Market Outlook, by Bus Type, 2020-2033
8.4.21. Kenya Bus Rapid Transit (BRT) Market Outlook, by Application, 2020-2033
8.4.22. Uganda Bus Rapid Transit (BRT) Market Outlook, by Propulsion, 2020-2033
8.4.23. Uganda Bus Rapid Transit (BRT) Market Outlook, by Bus Type, 2020-2033
8.4.24. Uganda Bus Rapid Transit (BRT) Market Outlook, by Application, 2020-2033
8.4.25. Ghana Bus Rapid Transit (BRT) Market Outlook, by Propulsion, 2020-2033
8.4.26. Ghana Bus Rapid Transit (BRT) Market Outlook, by Bus Type, 2020-2033
8.4.27. Ghana Bus Rapid Transit (BRT) Market Outlook, by Application, 2020-2033
9. Competitive Landscape
9.1. Market Concentration and Industry Leaders
9.2. Competitive Differentiation
9.3. Strategic Moves and Market Direction
9.4. Recent Industry Developments
9.5. Company Profiles
9.5.1. Volvo Buses
9.5.2. Yutong
9.5.3. BYD
9.5.4. Daimler Buses
9.5.5. Marcopolo
9.5.6. MAN Truck & Bus
9.5.7. Scania
9.5.8. Zhongtong Bus
9.5.9. CRRC
9.5.10. Tata Motors
9.5.11. New Flyer
9.5.12. Solaris Bus & Coach
10. Appendix
10.1. Research Methodology
10.2. Report Assumptions
10.3. Acronyms and Abbreviations
| Segmentation | Coverage |
|---|---|
| Propulsion | Diesel; Natural Gas; Hybrid; Electric |
| Bus Type | Standard Buses; Articulated Buses; Bi-articulated Buses |
| Application | Urban; Suburban & Regional |
| Regions | North America; Europe; Asia Pacific; Latin America; Middle East & Africa |
Our Research Methodology
Considering the volatility of business today, traditional approaches to strategizing a game plan can be unfruitful if not detrimental. True ambiguity is no way to determine a forecast. A myriad of predetermined factors must be accounted for such as the degree of risk involved, the magnitude of circumstances, as well as conditions or consequences that are not known or unpredictable. To circumvent binary views that cast uncertainty, the application of market research intelligence to strategically posture, move, and enable actionable outcomes is necessary.
View Methodology
Quality Assured
Rigorous Validation Process

Confidentiality Assured
End-to-end Data Security

Custom Research Services
Tailored To Your Objectives
FAQs
The bus rapid transit market is valued at US$ 45.96 billion in 2026, led by urban corridors and articulated diesel and electric buses.
The market is projected to reach US$ 76.26 billion by 2033, growing at a 7.5% CAGR and adding US$ 30.29 billion.
Electric is growing fastest at a 14.2% CAGR through 2033, driven by falling battery costs, climate targets, and development bank funding.
India is growing fastest at a 10.4% CAGR through 2033, driven by national electric bus programs and new urban BRT corridors.
Asia Pacific holds the largest share at 58.9% in 2026, supported by large BRT networks in China, Indonesia, and Pakistan.
Related Reports
Humanoid Robots in Automotive Manufacturing Market Size, Share, Insights, Competitive Landscape, and Forecast 2026 to 2033
Humanoid robots in automotive manufacturing market to reach US$ 6.52 billion by 2033 at 40.3% CAGR. Explore applications and regional trends.
Automotive ABS and ESC Market Size, Share, Insights, Competitive Landscape, and Forecast 2026 to 2033
Automotive ABS and ESC market to reach US$ 107.69 billion by 2033 at 8.2% CAGR. Explore system, vehicle, propulsion and regional trends.
Airport Shuttle Bus Market Size, Share, Insights, Competitive Landscape, and Forecast 2026 to 2033
Airport shuttle bus market to reach US$26.57 billion by 2033 at 6.7% CAGR, driven by passenger growth, airport expansion and electric fleets.
Lane Keep Assist System Market Size, Share, Insights, Competitive Landscape, and Forecast 2026 to 2033
Explore the lane keep assist system market, reaching US$ 18.95 billion by 2033 at 14.4% CAGR, with component, vehicle and regional insights.
Foldable Electric Scooter Market Size, Share, Insights, Competitive Landscape, and Forecast 2026 to 2033
Explore the foldable electric scooter market, reaching US$ 6.9 billion by 2033 at 6.3% CAGR, with range, price tier and regional insights.
In-car Audio System Market Size, Share, Insights, Competitive Landscape, and Forecast 2026 to 2033
Explore the in-car audio system market, reaching US$ 21.8 billion by 2033 at 6.0% CAGR, with component, system tier and regional insights.