



Capping Machine Market
Capping Machine Market Size, Share, Insights, Competitive Landscape, and Forecast 2026 to 2033
Report Overview
Capping Machine Market Size and Trend Analysis
How Fast Will the Capping Machine Market Grow?
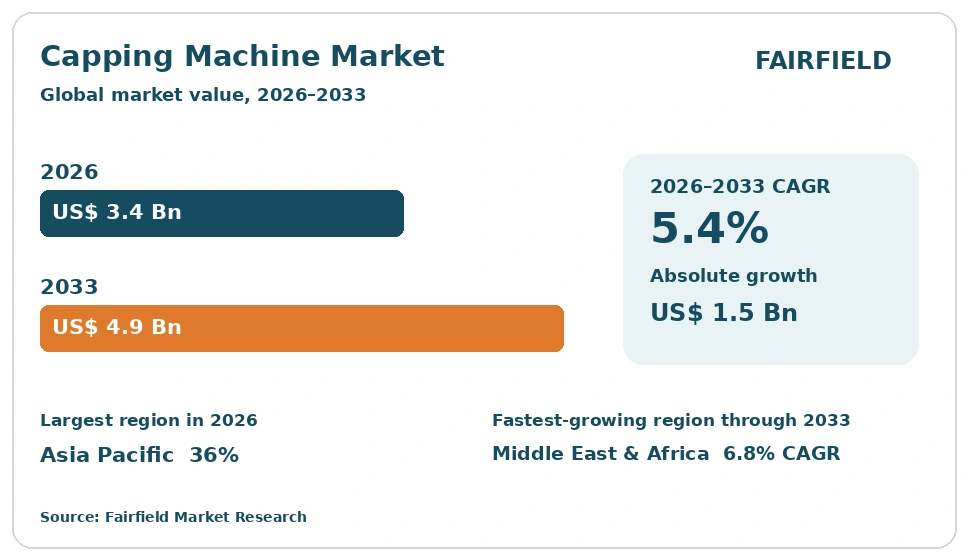
The global Capping Machine market size is expected to be valued at US$ 3.4 billion in 2026 and projected to reach US$ 4.9 billion by 2033, growing at a CAGR of 5.4% between 2026 and 2033. Growth rests on steady bottling and jar-filling capacity additions across beverage, dairy, pharmaceutical and personal care plants. Packagers are replacing ageing chuck and spindle cappers with servo-driven heads that hold application torque inside tight limits. Lightweight closures, tamper-evident bands and child-resistant pharmaceutical fitments all demand finer control, pushing buyers toward higher-specification machines. Between 2020 and 2025 the market advanced at a 4.1% CAGR, so the forecast implies measurable acceleration and an absolute dollar opportunity of US$ 1.5 billion.
Key Report Takeaways
- By Machine Type: Screw capping machines led with 41% share in 2026, while ROPP capping machines are projected to expand at a 6.5% CAGR through 2033, driven by wider use of aluminium roll-on pilfer-proof closures across spirits and edible oil bottling.
- By Operation Mode: Fully automatic cappers held 58% share in 2026, while semi-automatic cappers should grow at a 5.9% CAGR through 2033, driven by contract packers and small-batch producers that need affordable, changeover-friendly equipment on short runs.
- By End-use Industry: Beverages accounted for 38% of revenue in 2026, while pharmaceuticals is set to rise at a 6.8% CAGR through 2033, driven by serialisation-ready vial, syringe and dosage-bottle lines inside regulated sterile manufacturing sites.
- By Container Material: Plastic containers captured 54% share in 2026, while glass containers are forecast to advance at a 6.0% CAGR through 2033, driven by premium spirits, functional drinks and injectable packaging formats returning to glass.
- By Region: Asia Pacific led with 36% share in 2026, ahead of North America at 26%, Europe at 25%, Latin America at 7% and Middle East & Africa at 6%, while Middle East & Africa grows fastest at a 6.8% CAGR through 2033 on new beverage bottling capacity.
Market Trends and Insights
Market Growth Drivers
Beverage and Dairy Bottling Capacity Keeps Expanding
Capping equipment demand rises in step with new beverage, dairy and bottled water filling lines. Every added filler block needs a matched capper, because closure application sets the pace of the entire line. Bottlers adding single-serve formats, functional drinks and flavoured water multiply the closure sizes a plant must handle, which usually means extra capping heads rather than one faster machine.
The underlying trend is a long shift toward lightweight plastic and carton closures in emerging economies, alongside continued premium glass bottling in mature ones. Dairy processors moving to extended shelf-life and aseptic formats specify capping heads that operate under controlled hygiene conditions. Juice and ready-to-drink tea producers run hot-fill lines where caps must seat within a narrow temperature window. These process constraints keep the capper a quality-critical asset rather than a commodity purchase.
Servo Technology Raises Torque Accuracy and Line Uptime
Servo-driven capping heads lift demand because they convert closure application from a mechanical setting into a measured, repeatable process. Each head records applied torque and angle for every container, so packagers catch cross-threaded, cocked or under-tightened caps before pallets reach distribution. That traceability reduces leakage claims and product recalls, which carries more weight with buyers than headline speed. Lower reject rates also justify replacing serviceable cappers early.
Behind this sits the wider move to connected packaging lines and tighter closure tolerances. Thinner caps and lightweighted necks leave far less margin for error, so fixed-clutch systems struggle to hold specification. Plant engineers increasingly want capping data feeding the same control layer as filling and labelling. Equipment builders have responded with modular servo turrets, tool-less changeover parts and recipe-based setup that shortens validation work.
Restraints Impact Analysis of Market
High Capital Cost Slows Adoption Among Small Packagers
Capital intensity limits market growth because a high-speed rotary capper represents a major outlay for small and mid-size packagers. The machine alone is only part of the bill, since buyers also fund change parts, guarding, integration, controls and operator training. Many regional bottlers, craft beverage producers and cosmetics fillers therefore keep older equipment running longer, repairing clutches and chucks instead of replacing complete turrets.
Financing conditions reinforce the caution. Packaging lines compete for capital against warehousing, refrigeration and product development, and payback calculations on capping upgrades depend on avoided rejects that are hard to quantify in advance. Equipment builders respond with entry-level inline cappers, leasing arrangements and staged upgrade paths that add heads later. Even so, the installed base of serviceable mechanical cappers remains large, and that installed base slows the pace of replacement demand.
Closure Variety and Frequent Changeovers Strain Machine Flexibility
Closure proliferation restrains growth because every new cap geometry risks making existing capping tooling obsolete. Brand owners launch sports caps, flip-tops, dosing closures, dispensing pumps and tethered designs at a pace that outruns equipment refresh cycles. Packagers running many stock-keeping units lose productive hours to changeovers, and that downtime undercuts the throughput case that justified the machine.
Regulatory and sustainability pressure adds to the churn. Tethered-cap requirements in several markets changed closure dimensions across large beverage portfolios, forcing tooling reviews on installed lines. Lightweighting programmes cut cap height and wall thickness, which alters gripping and torque behaviour. Recyclability targets are also moving some closures from multi-material to mono-material constructions. Machine builders must supply flexible heads and quick-release parts, yet each adaptation lengthens specification work and raises the engineering cost of a sale.
Market Opportunities
Pharmaceutical and Nutraceutical Lines Open Premium Equipment Demand
Regulated dosage manufacturing creates the richest new revenue pool for capping equipment suppliers. Pharmaceutical and nutraceutical fillers pay a clear premium for cappers that deliver documented torque control, validated cleaning, stainless construction and audit-ready batch records. Margins on these machines sit well above beverage equipment, and the aftermarket attaches qualification services, spare tooling and periodic requalification that extend supplier revenue across the asset life.
Several industry currents support the opportunity. Biologics and injectable production expands vial and syringe capping needs, where crimping precision determines container closure integrity. Serialisation and tamper-evidence rules require capping stations to work alongside vision inspection and coding equipment. Nutraceutical and supplement brands, meanwhile, need child-resistant and induction-sealed closures on fast-growing bottle formats. Suppliers able to combine clean-room design with validation documentation can enter accounts that rarely change equipment vendors once qualified.
Retrofit, Service and Remote Monitoring Create Recurring Revenue
Aftermarket services turn a cyclical machine business into a steadier income stream. Capping equipment stays on the floor for many years, so retrofit kits, servo head upgrades, replacement chucks and control refreshes let suppliers earn revenue between capital cycles. Condition monitoring contracts and spare-parts subscriptions add predictable margin, and they give builders direct visibility of how installed machines perform in real production conditions.
The enabling trend is wider connectivity on packaging lines. Torque, cycle-count and vibration data from capping heads support predictive maintenance, so parts get changed before a head fails mid-shift. Remote diagnostics also reduce the cost of supporting plants in distant markets, which matters where skilled service engineers are scarce. Packagers facing maintenance staffing shortages increasingly prefer suppliers offering structured service agreements. That preference favours builders with installed-base density and well-organised regional parts networks.
Category-wise Insights
Which Capping Machine Type Holds the Largest Share?
Screw capping machines hold the largest position, at 41% share in 2026, because threaded closures remain the default across almost every packaged goods category. Water, carbonated drinks, sauces, syrups, lotions and dosage bottles all use screw caps, so chuck and spindle machines serve the broadest installed base.
Growth leadership sits elsewhere. ROPP capping machines are forecast to expand at a 6.5% CAGR through 2033, as aluminium roll-on pilfer-proof closures gain ground in spirits, wine, edible oil and pharmaceutical syrup bottling. ROPP heads form the thread onto the cap during application, which demands precise knife and roller control and supports higher prices. The divergence matters strategically: suppliers defend volume through screw capping platforms while building margin and differentiation around ROPP, crimping and corking formats.
Automation Depth Decides Where Capping Capital Is Spent
Fully automatic cappers dominate spending, with 58% share in 2026, because high-volume bottling plants cannot meet output or hygiene targets with operator-paced equipment. Rotary automatic turrets integrate with fillers, rinsers and labellers under one control system, run continuously across shifts and keep torque verification inline.
The faster climb belongs to semi-automatic cappers, projected at a 5.9% CAGR through 2033. Contract packagers, craft beverage makers, supplement brands and cosmetics startups need equipment that handles many short runs at modest capital cost. Semi-automatic units allow quick closure changes and fit constrained floor space, which suits co-packing models serving several brand owners. For suppliers, this split means maintaining two distinct commercial approaches: engineered projects for integrated lines, and catalogue-led, fast-delivery sales for smaller buyers.
Which End-use Industry Buys the Most Capping Machines?
Beverages buy the most capping equipment, taking 38% of revenue in 2026, because bottling runs the highest container volumes of any packaged sector. Water, carbonated drinks, juices, dairy beverages and ready-to-drink categories all run continuous lines where capping capacity directly caps throughput.
Pharmaceuticals is the fastest-growing end use, at a 6.8% CAGR through 2033. Expanding injectable, oral liquid and solid dosage capacity requires capping and crimping stations built for clean-room conditions and container closure integrity testing. Regulatory expectations around tamper evidence, child resistance and serialisation raise the specification of every station. The business implication is a shift in revenue mix: beverage work sustains volume and installed-base scale, while pharmaceutical projects raise average selling prices and lengthen supplier relationships through validation and requalification commitments.
Plastic Containers Anchor Volume While Glass Regains Ground
Plastic containers anchor capping equipment demand, representing 54% share in 2026, because polyethylene terephthalate and high-density polyethylene bottles carry most beverage, household and personal care volume. Plastic necks tolerate high line speeds, and lightweighting has made closure handling a precision task that favours modern servo heads.
Glass containers show the faster trajectory, at a 6.0% CAGR through 2033. Premium spirits, wine, functional beverages, fragrances and injectable pharmaceuticals continue to favour glass for barrier performance and brand presentation. Glass requires gentler container handling, careful neck support and tighter torque windows, since over-application causes breakage rather than deformation. Suppliers offering corking, crimping and ROPP capability alongside screw capping are better positioned for these accounts. The pattern points to a market where volume and value growth increasingly come from different container streams.
Geography Analysis
North America Runs a Replacement-Driven Capping Equipment Cycle
North America holds 26% share in 2026 and is projected to grow at a 4.4% CAGR through 2033, a replacement-led pattern rather than a capacity boom. The United States contributes most demand, with Canada and Mexico adding beverage, dairy and household chemical lines. Buyers modernise installed cappers to raise torque traceability, reduce rejects and cope with persistent maintenance labour shortages.
Pharmaceutical and nutraceutical filling supports the higher-value end of regional demand, where U.S. Food and Drug Administration expectations on tamper evidence, child-resistant closures and container closure integrity shape equipment specification. Craft beverage and functional drink producers add a steady stream of smaller inline and semi-automatic purchases. Nearshoring of consumer goods production into Mexico is also adding packaging capacity and regional service demand.
Europe Competes on Engineering Depth and Sustainability Rules
Europe accounts for 25% share in 2026 with a 4.2% CAGR through 2033, reflecting a mature installed base and a strong domestic machine-building industry. Germany, Italy, France and Spain host both major equipment manufacturers and large bottling, wine, spirits and pharmaceutical operations, so technology adoption moves quickly from supplier to user.
Regulation is the clearest demand driver. Tethered-cap requirements under European packaging rules changed closure designs across beverage portfolios, prompting tooling reviews and head upgrades on many installed lines. Broader packaging and packaging waste measures push lightweighting and mono-material closures, each of which alters capping behaviour. Energy costs and sustainability reporting also favour machines with lower consumption and longer service lives. Buyers increasingly judge suppliers on the ability to retrofit rather than replace complete lines.
Which Region Is Leading the Capping Machine Market?
Asia Pacific leads the capping machine market, with 36% share in 2026 and a 6.7% CAGR through 2033, the largest and one of the fastest-moving regions. China and India supply most of that demand through packaged water, carbonated drinks, dairy, edible oil, agrochemical and personal care bottling. Japan, South Korea, Indonesia and Vietnam add further processing volume.
Three forces explain the lead. Rising urban populations and modern retail expansion keep packaged goods consumption climbing, which drives steady filling line additions. Generic pharmaceutical manufacturing in India and contract cosmetics production across Southeast Asia create demand for higher-specification capping and crimping stations. Finally, a dense base of regional machine builders supplies competitively priced equipment, lowering entry costs for small producers and widening the market.
Latin America Builds Out Beverage and Agro-Processing Lines
Latin America holds 7% share in 2026 and is set to grow at a 5.5% CAGR through 2033, supported by beverage, agro-processing and personal care investment. Brazil and Mexico account for most installed capacity, with Argentina, Chile, Colombia and Peru contributing through wine, juice, edible oil and dairy bottling.
Demand reflects both consumption growth and export orientation. Bottled water, flavoured drinks and beer continue to add filling capacity for domestic markets, while wine and agricultural processing lines serve export customers with stricter closure integrity expectations. Currency volatility and import duties make capital equipment decisions cautious, so semi-automatic and mid-speed machines take a larger share than in mature regions. Local parts availability also weighs heavily in supplier selection, favouring builders with established distributor networks.
Which Region Is Growing Fastest in the Capping Machine Market?
Middle East & Africa is growing fastest, at a 6.8% CAGR through 2033, from a 6% share in 2026 that leaves ample room for expansion. Saudi Arabia, the United Arab Emirates, Egypt, South Africa, Morocco and Nigeria supply most activity through dairy, juice, bottled water, edible oil and household chemical packaging.
Food security and industrial diversification policies drive the pace. Gulf states fund domestic dairy, beverage and food processing capacity to cut import dependence, and each new plant installs complete filling and capping lines. North African manufacturers serve local consumption and nearby export markets. Rising local pharmaceutical production adds demand for crimping and clean-room capping stations. Because much of this capacity is new rather than replacement, buyers often specify automated equipment from the start.
Competitive Landscape
The capping machine market is moderately concentrated. A small group of large packaging line builders supplies integrated rinser-filler-capper systems to multinational beverage, dairy and pharmaceutical producers, while a wider field of capping specialists and regional machine makers serves mid-size and small packagers. Scale matters at the top because global brand owners want one supplier accountable for line performance, validation and service across several countries. Below that tier, the market remains genuinely fragmented, with many builders competing on price, delivery speed and local support. Consolidation has generally taken the form of larger groups adding specialist capping capability to broaden line coverage rather than removing competitors.
Technical competition centres on closure handling accuracy rather than headline speed. Vendors differentiate through servo head design, torque and angle verification, tool-less changeover, hygienic construction and the ability to handle fragile glass or lightweighted plastic without damage. Energy efficiency, machine footprint and control-system openness increasingly appear in buyer specifications. Entrants from regional engineering bases compete effectively at the semi-automatic and mid-speed end, where standardised closures reduce the engineering content of a sale and price becomes decisive.
Strategic activity concentrates on capability building. Suppliers invest in modular platforms that shorten delivery times, in pharmaceutical-grade product lines that open higher-margin accounts, and in digital service offerings that monetise the installed base. Expanding regional assembly, demonstration and spare-parts capacity matters competitively because packagers weigh service response heavily when selecting equipment.
The competitive direction is clear. Vendors are shifting from selling machines toward supporting closure performance across the asset life, combining flexible hardware, verification data and responsive service into a single commercial proposition.
Industry Leaders
- Krones AG
- KHS GmbH
- Sidel
- SACMI
- AROL S.p.A.
- IMA S.p.A.
- Pro Mach, Inc.
- Serac Group
Companies Covered in the Report
- Krones AG
- KHS GmbH
- Sidel
- SACMI
- AROL S.p.A.
- IMA S.p.A.
- Pro Mach, Inc.
- Serac Group
- GEA Group Aktiengesellschaft
- Bausch + Ströbel Maschinenfabrik Ilshofen GmbH + Co. KG
- Marchesini Group S.p.A.
- Groninger & Co. GmbH
- Ronchi Mario S.p.A.
- Accutek Packaging Equipment Companies, Inc.
- Kinex Cappers, LLC
- Nalbach Engineering Company, Inc.
- Cozzoli Machine Company
- E-PAK Machinery, Inc.
Capping Machine Market Report Scope
Fairfield Market Research segments the capping machine market across four commercial dimensions and five regions.
| By Machine Type | Screw Capping Machines, ROPP Capping Machines, Snap and Press-on Capping Machines, Crimping Capping Machines, Corking Machines |
| By Operation Mode | Fully Automatic, Semi-Automatic, Manual |
| By End-use Industry | Beverages, Pharmaceuticals, Food, Personal Care and Cosmetics, Chemicals and Household Products |
| By Container Material | Plastic, Glass, Metal, Composite and Others |
| By Region | North America, Europe, Asia Pacific, Latin America, Middle East & Africa |
1. Executive Summary
1.1 Global Capping Machine Market Snapshot
1.2 Future Projections, 2026–2033
1.3 Key Industry Highlights
1.4 Regional Snapshot
2. Market Overview
2.1 Market Definition and Report Scope
2.2 Historical Market Trends
2.3 Market Dynamics
2.3.1 Drivers
2.3.1.1 Beverage and Dairy Bottling Capacity Keeps Expanding
2.3.1.2 Servo Technology Raises Torque Accuracy and Line Uptime
2.3.2 Restraints
2.3.2.1 High Capital Cost Slows Adoption Among Small Packagers
2.3.2.2 Closure Variety and Frequent Changeovers Strain Machine Flexibility
2.3.3 Market Opportunities
2.3.3.1 Pharmaceutical and Nutraceutical Lines Open Premium Equipment Demand
2.3.3.2 Retrofit, Service and Remote Monitoring Create Recurring Revenue
3. Global Capping Machine Market Outlook, 2026–2033
3.1 Global Capping Machine Market Outlook, by Machine Type, Value (US$ Billion), 2026–2033
3.1.1 Screw Capping Machines
3.1.2 ROPP Capping Machines
3.1.3 Snap and Press-on Capping Machines
3.1.4 Crimping Capping Machines
3.1.5 Corking Machines
3.2 Global Capping Machine Market Outlook, by Operation Mode, Value (US$ Billion), 2026–2033
3.2.1 Fully Automatic
3.2.2 Semi-Automatic
3.2.3 Manual
3.3 Global Capping Machine Market Outlook, by End-use Industry, Value (US$ Billion), 2026–2033
3.3.1 Beverages
3.3.2 Pharmaceuticals
3.3.3 Food
3.3.4 Personal Care and Cosmetics
3.3.5 Chemicals and Household Products
3.4 Global Capping Machine Market Outlook, by Container Material, Value (US$ Billion), 2026–2033
3.4.1 Plastic
3.4.2 Glass
3.4.3 Metal
3.4.4 Composite and Others
3.5 Global Capping Machine Market Outlook, by Region, Value (US$ Billion), 2026–2033
3.5.1 North America
3.5.2 Europe
3.5.3 Asia Pacific
3.5.4 Latin America
3.5.5 Middle East & Africa
4. North America Capping Machine Market Outlook, 2026–2033
4.1 North America Capping Machine Market Outlook, by Machine Type, Value (US$ Billion), 2026–2033
4.1.1 Screw Capping Machines
4.1.2 ROPP Capping Machines
4.1.3 Snap and Press-on Capping Machines
4.1.4 Crimping Capping Machines
4.1.5 Corking Machines
4.2 North America Capping Machine Market Outlook, by Operation Mode, Value (US$ Billion), 2026–2033
4.2.1 Fully Automatic
4.2.2 Semi-Automatic
4.2.3 Manual
4.3 North America Capping Machine Market Outlook, by End-use Industry, Value (US$ Billion), 2026–2033
4.3.1 Beverages
4.3.2 Pharmaceuticals
4.3.3 Food
4.3.4 Personal Care and Cosmetics
4.3.5 Chemicals and Household Products
4.4 North America Capping Machine Market Outlook, by Container Material, Value (US$ Billion), 2026–2033
4.4.1 Plastic
4.4.2 Glass
4.4.3 Metal
4.4.4 Composite and Others
4.5 North America Capping Machine Market Outlook, by Country, Value (US$ Billion), 2026–2033
4.5.1 United States Capping Machine Market Outlook, by Machine Type, 2026–2033
4.5.2 United States Capping Machine Market Outlook, by Operation Mode, 2026–2033
4.5.3 United States Capping Machine Market Outlook, by End-use Industry, 2026–2033
4.5.4 United States Capping Machine Market Outlook, by Container Material, 2026–2033
4.5.5 Canada Capping Machine Market Outlook, by Machine Type, 2026–2033
4.5.6 Canada Capping Machine Market Outlook, by Operation Mode, 2026–2033
4.5.7 Canada Capping Machine Market Outlook, by End-use Industry, 2026–2033
4.5.8 Canada Capping Machine Market Outlook, by Container Material, 2026–2033
4.5.9 Mexico Capping Machine Market Outlook, by Machine Type, 2026–2033
4.5.10 Mexico Capping Machine Market Outlook, by Operation Mode, 2026–2033
4.5.11 Mexico Capping Machine Market Outlook, by End-use Industry, 2026–2033
4.5.12 Mexico Capping Machine Market Outlook, by Container Material, 2026–2033
5. Europe Capping Machine Market Outlook, 2026–2033
5.1 Europe Capping Machine Market Outlook, by Machine Type, Value (US$ Billion), 2026–2033
5.1.1 Screw Capping Machines
5.1.2 ROPP Capping Machines
5.1.3 Snap and Press-on Capping Machines
5.1.4 Crimping Capping Machines
5.1.5 Corking Machines
5.2 Europe Capping Machine Market Outlook, by Operation Mode, Value (US$ Billion), 2026–2033
5.2.1 Fully Automatic
5.2.2 Semi-Automatic
5.2.3 Manual
5.3 Europe Capping Machine Market Outlook, by End-use Industry, Value (US$ Billion), 2026–2033
5.3.1 Beverages
5.3.2 Pharmaceuticals
5.3.3 Food
5.3.4 Personal Care and Cosmetics
5.3.5 Chemicals and Household Products
5.4 Europe Capping Machine Market Outlook, by Container Material, Value (US$ Billion), 2026–2033
5.4.1 Plastic
5.4.2 Glass
5.4.3 Metal
5.4.4 Composite and Others
5.5 Europe Capping Machine Market Outlook, by Country, Value (US$ Billion), 2026–2033
5.5.1 Germany Capping Machine Market Outlook, by Machine Type, 2026–2033
5.5.2 Germany Capping Machine Market Outlook, by Operation Mode, 2026–2033
5.5.3 Germany Capping Machine Market Outlook, by End-use Industry, 2026–2033
5.5.4 Germany Capping Machine Market Outlook, by Container Material, 2026–2033
5.5.5 Italy Capping Machine Market Outlook, by Machine Type, 2026–2033
5.5.6 Italy Capping Machine Market Outlook, by Operation Mode, 2026–2033
5.5.7 Italy Capping Machine Market Outlook, by End-use Industry, 2026–2033
5.5.8 Italy Capping Machine Market Outlook, by Container Material, 2026–2033
5.5.9 France Capping Machine Market Outlook, by Machine Type, 2026–2033
5.5.10 France Capping Machine Market Outlook, by Operation Mode, 2026–2033
5.5.11 France Capping Machine Market Outlook, by End-use Industry, 2026–2033
5.5.12 France Capping Machine Market Outlook, by Container Material, 2026–2033
5.5.13 Spain Capping Machine Market Outlook, by Machine Type, 2026–2033
5.5.14 Spain Capping Machine Market Outlook, by Operation Mode, 2026–2033
5.5.15 Spain Capping Machine Market Outlook, by End-use Industry, 2026–2033
5.5.16 Spain Capping Machine Market Outlook, by Container Material, 2026–2033
6. Asia Pacific Capping Machine Market Outlook, 2026–2033
6.1 Asia Pacific Capping Machine Market Outlook, by Machine Type, Value (US$ Billion), 2026–2033
6.1.1 Screw Capping Machines
6.1.2 ROPP Capping Machines
6.1.3 Snap and Press-on Capping Machines
6.1.4 Crimping Capping Machines
6.1.5 Corking Machines
6.2 Asia Pacific Capping Machine Market Outlook, by Operation Mode, Value (US$ Billion), 2026–2033
6.2.1 Fully Automatic
6.2.2 Semi-Automatic
6.2.3 Manual
6.3 Asia Pacific Capping Machine Market Outlook, by End-use Industry, Value (US$ Billion), 2026–2033
6.3.1 Beverages
6.3.2 Pharmaceuticals
6.3.3 Food
6.3.4 Personal Care and Cosmetics
6.3.5 Chemicals and Household Products
6.4 Asia Pacific Capping Machine Market Outlook, by Container Material, Value (US$ Billion), 2026–2033
6.4.1 Plastic
6.4.2 Glass
6.4.3 Metal
6.4.4 Composite and Others
6.5 Asia Pacific Capping Machine Market Outlook, by Country, Value (US$ Billion), 2026–2033
6.5.1 China Capping Machine Market Outlook, by Machine Type, 2026–2033
6.5.2 China Capping Machine Market Outlook, by Operation Mode, 2026–2033
6.5.3 China Capping Machine Market Outlook, by End-use Industry, 2026–2033
6.5.4 China Capping Machine Market Outlook, by Container Material, 2026–2033
6.5.5 India Capping Machine Market Outlook, by Machine Type, 2026–2033
6.5.6 India Capping Machine Market Outlook, by Operation Mode, 2026–2033
6.5.7 India Capping Machine Market Outlook, by End-use Industry, 2026–2033
6.5.8 India Capping Machine Market Outlook, by Container Material, 2026–2033
6.5.9 Japan Capping Machine Market Outlook, by Machine Type, 2026–2033
6.5.10 Japan Capping Machine Market Outlook, by Operation Mode, 2026–2033
6.5.11 Japan Capping Machine Market Outlook, by End-use Industry, 2026–2033
6.5.12 Japan Capping Machine Market Outlook, by Container Material, 2026–2033
6.5.13 South Korea Capping Machine Market Outlook, by Machine Type, 2026–2033
6.5.14 South Korea Capping Machine Market Outlook, by Operation Mode, 2026–2033
6.5.15 South Korea Capping Machine Market Outlook, by End-use Industry, 2026–2033
6.5.16 South Korea Capping Machine Market Outlook, by Container Material, 2026–2033
6.5.17 Indonesia Capping Machine Market Outlook, by Machine Type, 2026–2033
6.5.18 Indonesia Capping Machine Market Outlook, by Operation Mode, 2026–2033
6.5.19 Indonesia Capping Machine Market Outlook, by End-use Industry, 2026–2033
6.5.20 Indonesia Capping Machine Market Outlook, by Container Material, 2026–2033
6.5.21 Vietnam Capping Machine Market Outlook, by Machine Type, 2026–2033
6.5.22 Vietnam Capping Machine Market Outlook, by Operation Mode, 2026–2033
6.5.23 Vietnam Capping Machine Market Outlook, by End-use Industry, 2026–2033
6.5.24 Vietnam Capping Machine Market Outlook, by Container Material, 2026–2033
7. Latin America Capping Machine Market Outlook, 2026–2033
7.1 Latin America Capping Machine Market Outlook, by Machine Type, Value (US$ Billion), 2026–2033
7.1.1 Screw Capping Machines
7.1.2 ROPP Capping Machines
7.1.3 Snap and Press-on Capping Machines
7.1.4 Crimping Capping Machines
7.1.5 Corking Machines
7.2 Latin America Capping Machine Market Outlook, by Operation Mode, Value (US$ Billion), 2026–2033
7.2.1 Fully Automatic
7.2.2 Semi-Automatic
7.2.3 Manual
7.3 Latin America Capping Machine Market Outlook, by End-use Industry, Value (US$ Billion), 2026–2033
7.3.1 Beverages
7.3.2 Pharmaceuticals
7.3.3 Food
7.3.4 Personal Care and Cosmetics
7.3.5 Chemicals and Household Products
7.4 Latin America Capping Machine Market Outlook, by Container Material, Value (US$ Billion), 2026–2033
7.4.1 Plastic
7.4.2 Glass
7.4.3 Metal
7.4.4 Composite and Others
7.5 Latin America Capping Machine Market Outlook, by Country, Value (US$ Billion), 2026–2033
7.5.1 Brazil Capping Machine Market Outlook, by Machine Type, 2026–2033
7.5.2 Brazil Capping Machine Market Outlook, by Operation Mode, 2026–2033
7.5.3 Brazil Capping Machine Market Outlook, by End-use Industry, 2026–2033
7.5.4 Brazil Capping Machine Market Outlook, by Container Material, 2026–2033
7.5.5 Mexico Capping Machine Market Outlook, by Machine Type, 2026–2033
7.5.6 Mexico Capping Machine Market Outlook, by Operation Mode, 2026–2033
7.5.7 Mexico Capping Machine Market Outlook, by End-use Industry, 2026–2033
7.5.8 Mexico Capping Machine Market Outlook, by Container Material, 2026–2033
7.5.9 Argentina Capping Machine Market Outlook, by Machine Type, 2026–2033
7.5.10 Argentina Capping Machine Market Outlook, by Operation Mode, 2026–2033
7.5.11 Argentina Capping Machine Market Outlook, by End-use Industry, 2026–2033
7.5.12 Argentina Capping Machine Market Outlook, by Container Material, 2026–2033
7.5.13 Chile Capping Machine Market Outlook, by Machine Type, 2026–2033
7.5.14 Chile Capping Machine Market Outlook, by Operation Mode, 2026–2033
7.5.15 Chile Capping Machine Market Outlook, by End-use Industry, 2026–2033
7.5.16 Chile Capping Machine Market Outlook, by Container Material, 2026–2033
7.5.17 Colombia Capping Machine Market Outlook, by Machine Type, 2026–2033
7.5.18 Colombia Capping Machine Market Outlook, by Operation Mode, 2026–2033
7.5.19 Colombia Capping Machine Market Outlook, by End-use Industry, 2026–2033
7.5.20 Colombia Capping Machine Market Outlook, by Container Material, 2026–2033
7.5.21 Peru Capping Machine Market Outlook, by Machine Type, 2026–2033
7.5.22 Peru Capping Machine Market Outlook, by Operation Mode, 2026–2033
7.5.23 Peru Capping Machine Market Outlook, by End-use Industry, 2026–2033
7.5.24 Peru Capping Machine Market Outlook, by Container Material, 2026–2033
8. Middle East & Africa Capping Machine Market Outlook, 2026–2033
8.1 Middle East & Africa Capping Machine Market Outlook, by Machine Type, Value (US$ Billion), 2026–2033
8.1.1 Screw Capping Machines
8.1.2 ROPP Capping Machines
8.1.3 Snap and Press-on Capping Machines
8.1.4 Crimping Capping Machines
8.1.5 Corking Machines
8.2 Middle East & Africa Capping Machine Market Outlook, by Operation Mode, Value (US$ Billion), 2026–2033
8.2.1 Fully Automatic
8.2.2 Semi-Automatic
8.2.3 Manual
8.3 Middle East & Africa Capping Machine Market Outlook, by End-use Industry, Value (US$ Billion), 2026–2033
8.3.1 Beverages
8.3.2 Pharmaceuticals
8.3.3 Food
8.3.4 Personal Care and Cosmetics
8.3.5 Chemicals and Household Products
8.4 Middle East & Africa Capping Machine Market Outlook, by Container Material, Value (US$ Billion), 2026–2033
8.4.1 Plastic
8.4.2 Glass
8.4.3 Metal
8.4.4 Composite and Others
8.5 Middle East & Africa Capping Machine Market Outlook, by Country and Subregion, Value (US$ Billion), 2026–2033
8.5.1 Saudi Arabia Capping Machine Market Outlook, by Machine Type, 2026–2033
8.5.2 Saudi Arabia Capping Machine Market Outlook, by Operation Mode, 2026–2033
8.5.3 Saudi Arabia Capping Machine Market Outlook, by End-use Industry, 2026–2033
8.5.4 Saudi Arabia Capping Machine Market Outlook, by Container Material, 2026–2033
8.5.5 United Arab Emirates Capping Machine Market Outlook, by Machine Type, 2026–2033
8.5.6 United Arab Emirates Capping Machine Market Outlook, by Operation Mode, 2026–2033
8.5.7 United Arab Emirates Capping Machine Market Outlook, by End-use Industry, 2026–2033
8.5.8 United Arab Emirates Capping Machine Market Outlook, by Container Material, 2026–2033
8.5.9 Egypt Capping Machine Market Outlook, by Machine Type, 2026–2033
8.5.10 Egypt Capping Machine Market Outlook, by Operation Mode, 2026–2033
8.5.11 Egypt Capping Machine Market Outlook, by End-use Industry, 2026–2033
8.5.12 Egypt Capping Machine Market Outlook, by Container Material, 2026–2033
8.5.13 South Africa Capping Machine Market Outlook, by Machine Type, 2026–2033
8.5.14 South Africa Capping Machine Market Outlook, by Operation Mode, 2026–2033
8.5.15 South Africa Capping Machine Market Outlook, by End-use Industry, 2026–2033
8.5.16 South Africa Capping Machine Market Outlook, by Container Material, 2026–2033
8.5.17 Morocco Capping Machine Market Outlook, by Machine Type, 2026–2033
8.5.18 Morocco Capping Machine Market Outlook, by Operation Mode, 2026–2033
8.5.19 Morocco Capping Machine Market Outlook, by End-use Industry, 2026–2033
8.5.20 Morocco Capping Machine Market Outlook, by Container Material, 2026–2033
8.5.21 Nigeria Capping Machine Market Outlook, by Machine Type, 2026–2033
8.5.22 Nigeria Capping Machine Market Outlook, by Operation Mode, 2026–2033
8.5.23 Nigeria Capping Machine Market Outlook, by End-use Industry, 2026–2033
8.5.24 Nigeria Capping Machine Market Outlook, by Container Material, 2026–2033
8.5.25 Gulf states Capping Machine Market Outlook, by Machine Type, 2026–2033
8.5.26 Gulf states Capping Machine Market Outlook, by Operation Mode, 2026–2033
8.5.27 Gulf states Capping Machine Market Outlook, by End-use Industry, 2026–2033
8.5.28 Gulf states Capping Machine Market Outlook, by Container Material, 2026–2033
9. Competitive Landscape
9.1 Industry Leaders
9.2 Company Profiles
9.2.1 Krones AG
9.2.2 KHS GmbH
9.2.3 Sidel
9.2.4 SACMI
9.2.5 AROL S.p.A.
9.2.6 IMA S.p.A.
9.2.7 Pro Mach, Inc.
9.2.8 Serac Group
9.2.9 GEA Group Aktiengesellschaft
9.2.10 Bausch + Ströbel Maschinenfabrik Ilshofen GmbH + Co. KG
9.2.11 Marchesini Group S.p.A.
9.2.12 Groninger & Co. GmbH
9.2.13 Ronchi Mario S.p.A.
9.2.14 Accutek Packaging Equipment Companies, Inc.
9.2.15 Kinex Cappers, LLC
9.2.16 Nalbach Engineering Company, Inc.
9.2.17 Cozzoli Machine Company
9.2.18 E-PAK Machinery, Inc.
10. Appendix
10.1 Research Methodology
10.2 Report Assumptions
10.3 Acronyms and Abbreviations
| By Machine Type | Screw Capping Machines, ROPP Capping Machines, Snap and Press-on Capping Machines, Crimping Capping Machines, Corking Machines |
| By Operation Mode | Fully Automatic, Semi-Automatic, Manual |
| By End-use Industry | Beverages, Pharmaceuticals, Food, Personal Care and Cosmetics, Chemicals and Household Products |
| By Container Material | Plastic, Glass, Metal, Composite and Others |
| By Region | North America, Europe, Asia Pacific, Latin America, Middle East & Africa |
Our Research Methodology
Considering the volatility of business today, traditional approaches to strategizing a game plan can be unfruitful if not detrimental. True ambiguity is no way to determine a forecast. A myriad of predetermined factors must be accounted for such as the degree of risk involved, the magnitude of circumstances, as well as conditions or consequences that are not known or unpredictable. To circumvent binary views that cast uncertainty, the application of market research intelligence to strategically posture, move, and enable actionable outcomes is necessary.
View Methodology
Quality Assured
Rigorous Validation Process

Confidentiality Assured
End-to-end Data Security

Custom Research Services
Tailored To Your Objectives
FAQs
The global capping machine market is valued at US$ 3.4 billion in 2026, supported by beverage, pharmaceutical and personal care bottling line investment worldwide.
The market is projected to reach US$ 4.9 billion by 2033, expanding at a 5.4% CAGR and adding US$ 1.5 billion in absolute opportunity.
Screw capping machines lead with 41% share in 2026, because threaded closures dominate beverage, food, pharmaceutical and personal care containers across most packaging formats.
Asia Pacific leads with 36% share in 2026, helped by large beverage bottling bases and expanding pharmaceutical and personal care manufacturing across China and India.
The market is moderately concentrated, with large integrated line builders competing against focused capping specialists and regional machine makers serving price-sensitive small and mid-size packagers.
Related Reports
Machine Automation Controller Market Size, Share, Insights, Competitive Landscape, and Forecast 2026 to 2033
The global machine automation controller market is valued at US$2.4 billion in 2026, reaching US$4.5 billion by 2033, growing at a 9.4% CAGR
Lined Valve Market Size, Share, Insights, Competitive Landscape, and Forecast 2026 to 2033
The global lined valve market is valued at US$2.8 billion in 2026, reaching US$4.1 billion by 2033, growing at a 5.6% CAGR
Hydraulic Intensifiers Market Size, Share, Insights, Competitive Landscape, and Forecast 2026 to 2033
The global hydraulic intensifiers market is valued at US$1.28 billion in 2026, reaching US$1.92 billion by 2033, growing at a 6.0% CAGR
Dual Chamber Syringe Filling Machine Market Size, Share, Insights, Competitive Landscape, and Forecast 2026 to 2033
The dual chamber syringe filling machine market is projected to grow from US$430 million in 2026 to US$771 million by 2033 at an 8.7% CAGR.
CVD and CVI Vacuum Furnaces Market Size, Share, Insights, Competitive Landscape, and Forecast 2026 to 2033
The CVD and CVI vacuum furnaces market is projected to grow from US$1.24 billion in 2026 to US$2.04 billion by 2033 at a 7.4% CAGR.
Construction Bolts Market Size, Share, Insights, Competitive Landscape, and Forecast 2026 to 2033
The construction bolts market is projected to grow from US$9.6 billion in 2026 to US$13.9 billion by 2033 at a 5.4% CAGR.