



Container Fleet Market
Container Fleet Market Size, Share, Insights, Competitive Landscape, and Forecast 2026 to 2033
Container Fleet Market Size, Share, Insights, Competitive Landscape, and Forecast 2026 to 2033
How Fast Will the Container Fleet Market Grow?
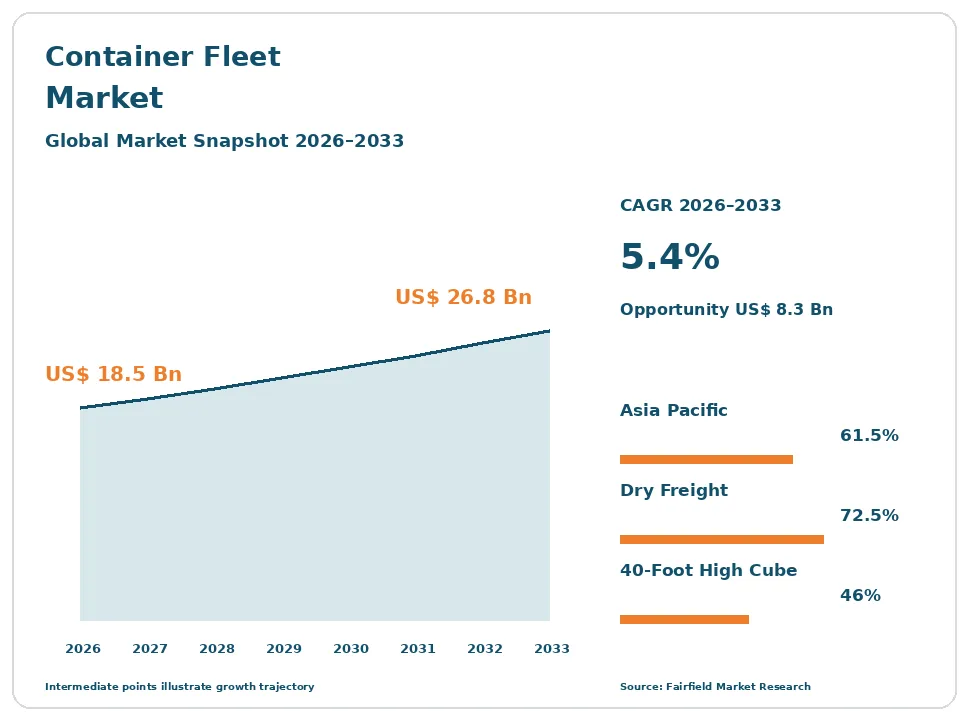
The global Container Fleet market size is expected to be valued at US$ 18.5 billion in 2026 and projected to reach US$ 26.8 billion by 2033, growing at a CAGR of 5.4% between 2026 and 2033.
These figures measure annual new container production and leasing revenue, not the capital value of the roughly 55 million TEU of equipment in service. Between 2020 and 2025 the sector expanded at about a 4.1% CAGR, but the path was violent rather than smooth. Port congestion locked boxes in yards, collapsed effective supply, and pushed factory prices and lease rates to records. Congestion then cleared and the same boxes reappeared as surplus. Growth to 2033 rests on trade volume recovery, replacement of equipment ordered during the last buying spike, and a gradual mix shift toward refrigerated and tank units. The direction is upward, punctuated by sharp cyclical swings.
Key Report Takeaways
- By Container Type: Dry freight standard containers held 72.5% share in 2026, while tank containers are projected to expand at a 7.9% CAGR through 2033, driven by chemical and food-grade liquid flows that cannot move in drums.
- By Container Size: Forty-foot high cube boxes held 46.0% share in 2026, while 53-foot domestic and pallet-wide formats are projected to expand at a 7.1% CAGR through 2033, supported by inland intermodal and regional distribution networks.
- By Ownership Model: Carrier and shipper owned fleets held 52.0% share in 2026, while container lessor fleets are projected to expand at a 6.4% CAGR through 2033, as carriers preserve balance-sheet flexibility after the last ordering cycle.
- By End Use: Consumer goods and retail held 31.5% share in 2026, while pharmaceuticals and healthcare are projected to expand at an 8.2% CAGR through 2033, reflecting stricter temperature-integrity requirements on medicines in transit.
- By Geography: Asia Pacific held 61.5% share in 2026, while Middle East & Africa is projected to expand at a 7.2% CAGR through 2033, as transhipment hubs and new industrial corridors absorb more equipment.
Global Container Fleet Market Trends and Insights
Drivers Impact Analysis
| Driver | Impact on CAGR Forecast | Geographic Relevance | Impact Timeline |
| Equipment turn time amplifying trade volume into new-build orders | High | Global, led by Asia Pacific | Short term (≤2 years) |
| Replacement of an ageing box population built in earlier spikes | Medium | Global | Long term (≥4 years) |
Two forces explain most of the ordering behaviour seen across the container equipment cycle.
Equipment Turn Time Converts Modest Trade Growth into Sharp Container Fleet Ordering
Container demand is derived from trade volume, but it is amplified by how long a box takes to complete a round trip. When ports congest, boxes sit in yards and effective supply collapses even though the physical fleet is unchanged. Carriers and lessors respond by ordering new equipment, and factory output can double within a few quarters. That amplification, not trade growth itself, is what moves this market.
The mechanism is arithmetic. A fleet that turns six times a year carries twice the cargo of the same fleet turning three times. Berth waiting, inland chassis shortages, canal transit restrictions and rerouting around disrupted corridors all lengthen the cycle. Each added week of dwell removes usable capacity, and the shortfall is met by production in China, which supplies the overwhelming majority of new boxes.
Replacement of an Ageing Box Population Sustains Container Fleet Production Through the Cycle
Replacement demand provides the floor under new container production and is more predictable than trade-driven demand. Boxes ordered during earlier buying spikes reach the end of their marine life in clusters, which creates repeating waves of retirement. Fleet owners must either rebuy or accept shrinking capacity, so a baseline order volume persists even when freight markets are weak.
The cause is physical and regulatory. A dry box typically stays in marine service for twelve to fifteen years before being sold into static storage or one-way trades, and corrosion, racking damage and floor failure accumulate. Under the International Convention for Safe Containers, each unit must carry a valid safety approval plate and pass periodic examination or an approved continuous examination programme. Units that cannot be economically repaired to that standard leave the fleet permanently.
Restraints Impact Analysis
| Restraint | Impact on CAGR Forecast | Geographic Relevance | Impact Timeline |
| Manufacturing concentration and corten steel input cost | High | Asia Pacific manufacturing base, global effect | Medium term (2–4 years) |
| Long asset life, idle fleet and depot storage cost | Medium | Global, acute at Europe and North America depots | Long term (≥4 years) |
Two structural constraints limit how quickly supply and returns can adjust in this market.
Manufacturing Concentration in China Narrows Supply Response in the Container Fleet Market
Almost all new marine containers are built in China, which concentrates both supply response and price formation in a handful of plants. When demand turns, factory lead times and quoted prices move together and buyers have little alternative source. The same concentration works in reverse during a downturn, when plants idle lines and the industry loses the gradual supply adjustment a dispersed manufacturing base would provide.
The cost structure explains the concentration. A dry box is mostly corten weathering steel, with hardwood or bamboo flooring, a refrigeration unit in reefer models, and labour-intensive welding and painting. Steel is the single largest input, so hot-rolled coil prices pass almost directly into factory quotations. Plant economics depend on continuous high-volume runs, which deters new entrants in higher-cost locations despite repeated interest in diversifying supply.
A Long Box Life and Idle Fleet Storage Costs Prolong Container Fleet Downturns
A container that is not needed does not disappear, and that is the central problem of this market in a downturn. Units built during one ordering spike stay serviceable for well over a decade, so surplus equipment overhangs the market for years rather than months. Idle rates rise, resale prices fall, and lessors earn storage costs instead of lease revenue on parked assets.
The cause is the combination of asset durability and depot economics. Off-hired units accrue daily storage charges at depots, plus handling, inspection and repair costs before they can be re-leased or sold. Trade policy and tariff changes compound the problem by moving volumes between lanes, leaving equipment stranded in locations where it is not wanted and where the cost of repositioning a unit by sea exceeds what the box can earn over a full lease term.
Market Opportunities
Refrigerated and Tank Containers Open a Higher-Value Container Fleet Revenue Pool
Specialised equipment is where pricing power still exists in the intermodal container business. Refrigerated and tank containers command far higher per-unit values and lease rates than dry boxes, and they are far less commoditised because fewer builders can make them to the required standard. For owners facing thin dry-box margins, shifting capital toward specialised equipment raises revenue per unit without increasing fleet count.
Perishable food exporters, pharmaceutical shippers and chemical producers create this demand. Temperature-controlled cargo requires continuous monitoring and certified refrigeration units, while liquid and gas cargoes move in tanks built and tested to recognised design codes and inspected on a fixed cycle. Refrigerant policy supports replacement: the Kigali Amendment and the recast European Union fluorinated greenhouse gas rules push reefer units toward lower global warming potential refrigerants, which accelerates the retirement of older machinery.
Telematics Fitment and Container Conversion Create New Container Fleet Earnings Streams
Two adjacent revenue pools are opening around the existing box population. Fitting tracking and telematics devices turns a passive steel asset into a monitored one, and owners can charge for visibility, door-event alerts and reefer condition data. Separately, structural conversion of retired boxes into storage units, site accommodation, modular buildings and equipment enclosures gives the fleet a second life at values above scrap.
Shippers and cargo owners drive the telematics demand, because they want shipment-level visibility rather than vessel-level estimates, and because temperature and humidity records support claims on high-value cargo. Conversion demand comes from construction, mining, defence and retail buyers who value a weatherproof, stackable, standard-dimension shell. Both pools are supported by the fact that ISO 6346 marking and ISO 668 dimensions make every unit identifiable and interchangeable long after it leaves marine service.
Segment Analysis
By Container Type: Dry Freight Boxes Dominate While Tank Containers Climb Fastest
Dry freight standard containers held 72.5% of the container fleet market in 2026, because they carry most general cargo and are the cheapest unit of intermodal capacity to build and maintain. Their dimensions and testing are fixed by ISO 668 and ISO 1496, which makes them fully interchangeable across carriers, terminals and lessors. Tank containers are the fastest-growing type at a 7.9% CAGR to 2033, as chemical, food-grade liquid and gas shippers move away from drums and flexitanks toward reusable, inspected pressure vessels. Refrigerated containers remain the highest-value mainstream type, while open top, flat rack and platform units serve project and out-of-gauge cargo. Special and regional formats, including pallet-wide boxes, round out the mix. The implication is that fleet owners increasingly separate commodity dry capacity from specialised equipment with genuine pricing power.
By Container Size: Forty-Foot High Cube Leads as Domestic 53-Foot Formats Accelerate
Forty-foot high cube containers held 46.0% share in 2026, because they offer the best volume per slot on deep-sea trades and have become the default box for consumer goods. Carriers prefer them since stowage and lashing plans are built around forty-foot bays, and lessors keep them as the liquid core of a leasing fleet. The 53-foot domestic and pallet-wide group grows fastest at a 7.1% CAGR, driven by inland rail intermodal in North America and by European pallet-wide formats that fit standard pallets without wasted width. Twenty-foot boxes retain a stable role in heavy, dense cargo such as metals, minerals and machinery, where weight limits bind before volume does. The practical consequence is that fleet planning must balance deep-sea volume efficiency against inland loading economics in each region.
By Ownership Model: Carrier Fleets Hold the Larger Share While Lessor Fleets Expand Quicker
Carrier and shipper owned fleets held 52.0% share in 2026, a legacy of the heavy direct buying that followed the last congestion-driven shortage. Owning equipment gives a carrier certainty of supply during a squeeze and avoids per-diem exposure when boxes are slow to return. Container lessor fleets grow faster at a 6.4% CAGR through 2033, because carriers now prefer to keep capital for vessels and decarbonisation spending rather than steel boxes. Long-term leases are the mechanism that protects lessor returns through the trough, since they lock in rates and terms for multi-year periods; spot and master leasing offers no such protection. The used and resale market, where retired units move to traders and conversion buyers, provides the residual value that underpins lease pricing. Ownership choice is therefore a financing decision as much as an operational one.
By End Use: Consumer Goods Lead the Fleet While Pharmaceutical Cargo Grows Fastest
Consumer goods and retail accounted for 31.5% of container fleet demand in 2026, because finished goods move in the highest unit volumes and fill dry boxes on the main deep-sea trades. Food and agricultural products form the second major block and anchor refrigerated demand, from fruit and seafood to chilled meat. Pharmaceuticals and healthcare is the fastest-growing end use at an 8.2% CAGR, as regulators and shippers tighten temperature-integrity expectations for medicines and biologics in transit, which favours certified reefer equipment with continuous data logging. Chemicals and petrochemicals underpin tank container demand and are governed in transport by the IMDG Code and the CTU Code on packing. Industrial and machinery cargo keeps twenty-foot and flat rack demand alive. The mix matters because specialised end uses defend margin when dry freight rates are weak.
Geography Analysis
North America Anchors Inland Intermodal Demand for Container Equipment
North America held 11.5% of container fleet value in 2026, with the United States, Canada and Mexico driving demand. The region is unusual because its inland network runs on 53-foot domestic containers that never cross an ocean, creating a large box population outside the international fleet. Import volumes through west and east coast gateways set marine equipment needs, while nearshoring into Mexico has lifted cross-border intermodal flows. The main constraint is chassis availability and inland dwell, which lengthens turn time and raises effective equipment requirements. Tariff changes and trade policy shifts move volumes between gateways and leave repositioning imbalances. The clearest opportunity is telematics fitment, because shippers here place a high value on door-to-door visibility and on documented temperature records for food and pharmaceutical loads.
Europe Sets the Regulatory and Refrigerant Agenda for Container Fleets
Europe accounted for 15.0% of the market in 2026, led by Germany, the Netherlands, Belgium, France and Poland. The region is a major importer of equipment rather than a producer, and its depots hold a large share of the world’s idle boxes during downturns because trade imbalance leaves surplus units at destination. Pallet-wide formats are a regional specialty, since standard pallets fit without wasted width in short-sea and continental traffic. Regulation is the region’s defining influence: the recast fluorinated greenhouse gas rules reach refrigerated container refrigerants, customs and temporary admission conventions govern repositioning, and packing is held to the CTU Code. Short-sea and inland waterway services offer the main growth opportunity, because they add turns without adding deep-sea exposure.
Which Region Is Leading the Container Fleet Market?
Asia Pacific leads the container fleet market with 61.5% share in 2026, because it builds the boxes and generates the cargo that fills them. China hosts almost all new container manufacturing, which places price formation, lead times and supply response inside one country. Export flows from China, Vietnam, Thailand and India, plus intra-regional feeder networks, create the densest equipment demand anywhere. The leading carriers and several of the largest lessors are headquartered or heavily invested in the region, so ordering decisions are made close to the factories. Japan and Korea contribute reefer technology and finance capacity. The main risk is concentration itself: a single-country supply base means that a disruption to steel supply, energy costs or plant operations transmits immediately into global container prices and availability.
Latin America Builds Fleet Demand Around Refrigerated Export Cargo
Latin America represented 5.0% of container fleet value in 2026, with Brazil, Chile, Peru, Colombia and Ecuador leading. The region’s equipment profile is distinctive because refrigerated containers matter far more here than the global average, serving fruit, fish, meat and flower exports with tight seasonal peaks. That seasonality creates sharp repositioning costs, since reefers arrive empty and leave full on a predictable annual rhythm. Barriers include limited inland rail, port draft restrictions, customs processing delays and currency volatility that complicates equipment purchases. Depot and repair capacity for refrigeration units is thin outside the main ports. The opportunity lies in longer-term lease structures and in local reefer servicing capability, both of which reduce the cost of serving a market where equipment utilisation is uneven across the year.
Which Region Is Growing Fastest in the Container Fleet Market?
Middle East & Africa is growing fastest in the container fleet market, at a 7.2% CAGR from 2026 to 2033, from a 7.0% share base. Transhipment hubs in the United Arab Emirates, Oman, Saudi Arabia, Egypt and Morocco are adding capacity, and every transhipment move consumes equipment time without generating an extra box of cargo. Industrial diversification programmes in the Gulf states are creating new export flows in chemicals, plastics and processed food, which lifts tank and reefer demand. Africa adds a long-term layer as regional trade agreements and port upgrades deepen container penetration in cargo that currently moves in breakbulk. Barriers remain real: inland corridors are slow, repair capacity is limited, and equipment imbalance is severe. Security disruption on regional routes also lengthens voyages and tightens effective supply.
Competitive Landscape
The container fleet market is moderately concentrated, with a clear split between manufacturing and ownership. Box production sits in a small group of China-based builders, which makes manufacturing highly concentrated. Ownership is more dispersed: a handful of large lessors control the majority of leased equipment, while ocean carriers and some large shippers hold the rest. Consolidation among lessors has been a persistent theme, as scale lowers funding costs and gives a fleet the geographic spread needed to reposition equipment efficiently. The result is a market where pricing power concentrates at the factory gate during shortages and at the lessor balance sheet during gluts.
Competition among lessors turns on cost of capital, fleet utilisation, lease duration and depot network coverage rather than on product differentiation, because a dry box is a standardised commodity. The share of fleet on long-term lease is the single most watched competitive metric, since it determines how much revenue survives a trough. Manufacturers compete on price, lead time, build quality and increasingly on refrigeration unit integration and lower-carbon production methods. New entrants are rare in dry box manufacturing, but specialist builders of tank containers, reefer machinery and telematics hardware have carved defensible positions.
Strategic activity across the industry concentrates on portfolio quality rather than volume. Owners have been lengthening lease terms, raising the proportion of specialised equipment in their fleets, and tightening residual value assumptions after watching resale prices swing violently. Several carriers have moved in the opposite direction, trimming owned fleets to release capital for vessel renewal and fuel transition spending. Digital investment is now standard, covering telematics fitment, automated inspection and depot management systems.
Strategic direction across the industry is set by three themes: protecting returns through the cycle with contract structure rather than volume, moving capital toward refrigerated and tank equipment, and extending asset life through repair, conversion and better condition data.
Container Fleet Industry Leaders
- Triton International Limited
- Textainer Group Holdings Limited
- China International Marine Containers (Group) Co., Ltd.
- Seaco Global
- Florens Asset Management Company Limited
Recent Industry Developments
- March 2024: The recast European Union fluorinated greenhouse gas regulation entered into application, tightening the phase-down of high global warming potential refrigerants used in refrigerated container units – it accelerates reefer machinery replacement and raises the value of newer equipment.
- 2022: The International Organization for Standardization issued a revised edition of ISO 6346, the standard governing container identification coding and marking – consistent coding underpins interchange, telematics data matching and resale across every fleet owner.
- January 2026: A new mandatory edition of the IMDG Code took effect for the carriage of dangerous goods in containers – updated packing, segregation and documentation rules raise compliance requirements for tank and chemical cargo operators.
Companies Covered in the Report
- Triton International Limited
- Textainer Group Holdings Limited
- Seaco Global
- Beacon Intermodal Leasing, LLC
- SeaCube Container Leasing Ltd.
- Touax Group
- Florens Asset Management Company Limited
- China International Marine Containers (Group) Co., Ltd.
- Singamas Container Holdings Limited
- Dong Fang International Container (Hong Kong) Co., Ltd.
- CARU Containers B.V.
- Mitsubishi HC Capital Inc.
- Maersk Container Industry A/S
Container Fleet Market Report Scope
This report covers the global fleet of intermodal shipping containers and the business of owning and leasing it, including new container production, carrier and shipper owned fleets, lessor fleets, and used resale. All values represent annual new-build and leasing revenue, not the capital value of equipment in service. Chassis, trailers, vessels and terminal handling equipment are excluded. The base year is 2025 and the forecast period runs from 2026 to 2033, in US$ Billion.
Container Type
- Dry Freight Standard Containers
- Refrigerated Containers
- Tank Containers
- Open Top, Flat Rack and Platform Containers
- Special and Regional Formats
Container Size
- 20-Foot
- 40-Foot Standard
- 40-Foot High Cube
- 53-Foot Domestic and Pallet-Wide
Ownership Model
- Carrier and Shipper Owned Fleets
- Container Lessor Fleets
- Used and Resale Market
End Use
- Consumer Goods and Retail
- Food and Agricultural Products
- Chemicals and Petrochemicals
- Industrial and Machinery
- Pharmaceuticals and Healthcare
Regions
- North America
- Europe
- Asia Pacific
- Latin America
- Middle East & Africa
Key Questions Answered in the Report
How big is the container fleet market in 2026?
The container fleet market is valued at US$ 18.5 billion in 2026, measured as annual new container production and leasing revenue worldwide.
What is the container fleet market forecast to 2033?
The market is projected to reach US$ 26.8 billion by 2033, expanding at a 5.4% CAGR and adding US$ 8.3 billion in value.
Which container type holds the largest share?
Dry freight standard containers lead with 72.5% share in 2026, because they carry most general cargo at the lowest cost per unit.
Which container segment is growing fastest?
Tank containers grow fastest at a 7.9% CAGR to 2033, as chemical and food-grade liquid shippers replace drums with reusable pressure vessels.
Which region leads the container fleet market?
Asia Pacific leads with 61.5% share in 2026, because it builds nearly all new containers and generates the heaviest export cargo volumes.
1. Executive Summary
1.1. Global Container Fleet Market Snapshot
1.2. Future Projections, 2026-2033
1.3. Key Market Trends
1.4. Regional Snapshot
2. Market Overview
2.1. Market Definition and Report Scope
2.2. Historical Market Trends, 2020-2025
2.3. Market Dynamics
2.3.1. Drivers Impact Analysis
2.3.1.1. Equipment Turn Time Converts Modest Trade Growth into Sharp Container Fleet Ordering
2.3.1.2. Replacement of an Ageing Box Population Sustains Container Fleet Production Through the Cycle
2.3.2. Restraints Impact Analysis
2.3.2.1. Manufacturing Concentration in China Narrows Supply Response in the Container Fleet Market
2.3.2.2. A Long Box Life and Idle Fleet Storage Costs Prolong Container Fleet Downturns
2.3.3. Market Opportunities
2.3.3.1. Refrigerated and Tank Containers Open a Higher-Value Container Fleet Revenue Pool
2.3.3.2. Telematics Fitment and Container Conversion Create New Container Fleet Earnings Streams
3. Global Container Fleet Market Outlook, 2020-2033
3.1. Global Container Fleet Market Outlook, by Container Type, Value (US$ Billion), 2020-2033
3.1.1. Dry Freight Standard Containers
3.1.2. Refrigerated Containers
3.1.3. Tank Containers
3.1.4. Open Top, Flat Rack and Platform Containers
3.1.5. Special and Regional Formats
3.2. Global Container Fleet Market Outlook, by Container Size, Value (US$ Billion), 2020-2033
3.2.1. 20-Foot
3.2.2. 40-Foot Standard
3.2.3. 40-Foot High Cube
3.2.4. 53-Foot Domestic and Pallet-Wide
3.3. Global Container Fleet Market Outlook, by Ownership Model, Value (US$ Billion), 2020-2033
3.3.1. Carrier and Shipper Owned Fleets
3.3.2. Container Lessor Fleets
3.3.3. Used and Resale Market
3.4. Global Container Fleet Market Outlook, by End Use, Value (US$ Billion), 2020-2033
3.4.1. Consumer Goods and Retail
3.4.2. Food and Agricultural Products
3.4.3. Chemicals and Petrochemicals
3.4.4. Industrial and Machinery
3.4.5. Pharmaceuticals and Healthcare
3.5. Global Container Fleet Market Outlook, by Region, Value (US$ Billion), 2020-2033
3.5.1. North America
3.5.2. Europe
3.5.3. Asia Pacific
3.5.4. Latin America
3.5.5. Middle East & Africa
4. North America Container Fleet Market Outlook, 2020-2033
4.1. North America Container Fleet Market Outlook, by Container Type, Value (US$ Billion), 2020-2033
4.1.1. Dry Freight Standard Containers
4.1.2. Refrigerated Containers
4.1.3. Tank Containers
4.1.4. Open Top, Flat Rack and Platform Containers
4.1.5. Special and Regional Formats
4.2. North America Container Fleet Market Outlook, by Container Size, Value (US$ Billion), 2020-2033
4.2.1. 20-Foot
4.2.2. 40-Foot Standard
4.2.3. 40-Foot High Cube
4.2.4. 53-Foot Domestic and Pallet-Wide
4.3. North America Container Fleet Market Outlook, by Ownership Model, Value (US$ Billion), 2020-2033
4.3.1. Carrier and Shipper Owned Fleets
4.3.2. Container Lessor Fleets
4.3.3. Used and Resale Market
4.4. North America Container Fleet Market Outlook, by End Use, Value (US$ Billion), 2020-2033
4.4.1. Consumer Goods and Retail
4.4.2. Food and Agricultural Products
4.4.3. Chemicals and Petrochemicals
4.4.4. Industrial and Machinery
4.4.5. Pharmaceuticals and Healthcare
4.5. North America Container Fleet Market Outlook, by Country, Value (US$ Billion), 2020-2033
4.5.1. United States Container Fleet Market Outlook, by Container Type, 2020-2033
4.5.2. United States Container Fleet Market Outlook, by Container Size, 2020-2033
4.5.3. United States Container Fleet Market Outlook, by Ownership Model, 2020-2033
4.5.4. United States Container Fleet Market Outlook, by End Use, 2020-2033
4.5.5. Canada Container Fleet Market Outlook, by Container Type, 2020-2033
4.5.6. Canada Container Fleet Market Outlook, by Container Size, 2020-2033
4.5.7. Canada Container Fleet Market Outlook, by Ownership Model, 2020-2033
4.5.8. Canada Container Fleet Market Outlook, by End Use, 2020-2033
4.5.9. Mexico Container Fleet Market Outlook, by Container Type, 2020-2033
4.5.10. Mexico Container Fleet Market Outlook, by Container Size, 2020-2033
4.5.11. Mexico Container Fleet Market Outlook, by Ownership Model, 2020-2033
4.5.12. Mexico Container Fleet Market Outlook, by End Use, 2020-2033
5. Europe Container Fleet Market Outlook, 2020-2033
5.1. Europe Container Fleet Market Outlook, by Container Type, Value (US$ Billion), 2020-2033
5.1.1. Dry Freight Standard Containers
5.1.2. Refrigerated Containers
5.1.3. Tank Containers
5.1.4. Open Top, Flat Rack and Platform Containers
5.1.5. Special and Regional Formats
5.2. Europe Container Fleet Market Outlook, by Container Size, Value (US$ Billion), 2020-2033
5.2.1. 20-Foot
5.2.2. 40-Foot Standard
5.2.3. 40-Foot High Cube
5.2.4. 53-Foot Domestic and Pallet-Wide
5.3. Europe Container Fleet Market Outlook, by Ownership Model, Value (US$ Billion), 2020-2033
5.3.1. Carrier and Shipper Owned Fleets
5.3.2. Container Lessor Fleets
5.3.3. Used and Resale Market
5.4. Europe Container Fleet Market Outlook, by End Use, Value (US$ Billion), 2020-2033
5.4.1. Consumer Goods and Retail
5.4.2. Food and Agricultural Products
5.4.3. Chemicals and Petrochemicals
5.4.4. Industrial and Machinery
5.4.5. Pharmaceuticals and Healthcare
5.5. Europe Container Fleet Market Outlook, by Country, Value (US$ Billion), 2020-2033
5.5.1. Germany Container Fleet Market Outlook, by Container Type, 2020-2033
5.5.2. Germany Container Fleet Market Outlook, by Container Size, 2020-2033
5.5.3. Germany Container Fleet Market Outlook, by Ownership Model, 2020-2033
5.5.4. Germany Container Fleet Market Outlook, by End Use, 2020-2033
5.5.5. Netherlands Container Fleet Market Outlook, by Container Type, 2020-2033
5.5.6. Netherlands Container Fleet Market Outlook, by Container Size, 2020-2033
5.5.7. Netherlands Container Fleet Market Outlook, by Ownership Model, 2020-2033
5.5.8. Netherlands Container Fleet Market Outlook, by End Use, 2020-2033
5.5.9. Belgium Container Fleet Market Outlook, by Container Type, 2020-2033
5.5.10. Belgium Container Fleet Market Outlook, by Container Size, 2020-2033
5.5.11. Belgium Container Fleet Market Outlook, by Ownership Model, 2020-2033
5.5.12. Belgium Container Fleet Market Outlook, by End Use, 2020-2033
5.5.13. France Container Fleet Market Outlook, by Container Type, 2020-2033
5.5.14. France Container Fleet Market Outlook, by Container Size, 2020-2033
5.5.15. France Container Fleet Market Outlook, by Ownership Model, 2020-2033
5.5.16. France Container Fleet Market Outlook, by End Use, 2020-2033
5.5.17. Poland Container Fleet Market Outlook, by Container Type, 2020-2033
5.5.18. Poland Container Fleet Market Outlook, by Container Size, 2020-2033
5.5.19. Poland Container Fleet Market Outlook, by Ownership Model, 2020-2033
5.5.20. Poland Container Fleet Market Outlook, by End Use, 2020-2033
6. Asia Pacific Container Fleet Market Outlook, 2020-2033
6.1. Asia Pacific Container Fleet Market Outlook, by Container Type, Value (US$ Billion), 2020-2033
6.1.1. Dry Freight Standard Containers
6.1.2. Refrigerated Containers
6.1.3. Tank Containers
6.1.4. Open Top, Flat Rack and Platform Containers
6.1.5. Special and Regional Formats
6.2. Asia Pacific Container Fleet Market Outlook, by Container Size, Value (US$ Billion), 2020-2033
6.2.1. 20-Foot
6.2.2. 40-Foot Standard
6.2.3. 40-Foot High Cube
6.2.4. 53-Foot Domestic and Pallet-Wide
6.3. Asia Pacific Container Fleet Market Outlook, by Ownership Model, Value (US$ Billion), 2020-2033
6.3.1. Carrier and Shipper Owned Fleets
6.3.2. Container Lessor Fleets
6.3.3. Used and Resale Market
6.4. Asia Pacific Container Fleet Market Outlook, by End Use, Value (US$ Billion), 2020-2033
6.4.1. Consumer Goods and Retail
6.4.2. Food and Agricultural Products
6.4.3. Chemicals and Petrochemicals
6.4.4. Industrial and Machinery
6.4.5. Pharmaceuticals and Healthcare
6.5. Asia Pacific Container Fleet Market Outlook, by Country, Value (US$ Billion), 2020-2033
6.5.1. China Container Fleet Market Outlook, by Container Type, 2020-2033
6.5.2. China Container Fleet Market Outlook, by Container Size, 2020-2033
6.5.3. China Container Fleet Market Outlook, by Ownership Model, 2020-2033
6.5.4. China Container Fleet Market Outlook, by End Use, 2020-2033
6.5.5. Vietnam Container Fleet Market Outlook, by Container Type, 2020-2033
6.5.6. Vietnam Container Fleet Market Outlook, by Container Size, 2020-2033
6.5.7. Vietnam Container Fleet Market Outlook, by Ownership Model, 2020-2033
6.5.8. Vietnam Container Fleet Market Outlook, by End Use, 2020-2033
6.5.9. Thailand Container Fleet Market Outlook, by Container Type, 2020-2033
6.5.10. Thailand Container Fleet Market Outlook, by Container Size, 2020-2033
6.5.11. Thailand Container Fleet Market Outlook, by Ownership Model, 2020-2033
6.5.12. Thailand Container Fleet Market Outlook, by End Use, 2020-2033
6.5.13. India Container Fleet Market Outlook, by Container Type, 2020-2033
6.5.14. India Container Fleet Market Outlook, by Container Size, 2020-2033
6.5.15. India Container Fleet Market Outlook, by Ownership Model, 2020-2033
6.5.16. India Container Fleet Market Outlook, by End Use, 2020-2033
6.5.17. Japan Container Fleet Market Outlook, by Container Type, 2020-2033
6.5.18. Japan Container Fleet Market Outlook, by Container Size, 2020-2033
6.5.19. Japan Container Fleet Market Outlook, by Ownership Model, 2020-2033
6.5.20. Japan Container Fleet Market Outlook, by End Use, 2020-2033
6.5.21. Korea Container Fleet Market Outlook, by Container Type, 2020-2033
6.5.22. Korea Container Fleet Market Outlook, by Container Size, 2020-2033
6.5.23. Korea Container Fleet Market Outlook, by Ownership Model, 2020-2033
6.5.24. Korea Container Fleet Market Outlook, by End Use, 2020-2033
7. Latin America Container Fleet Market Outlook, 2020-2033
7.1. Latin America Container Fleet Market Outlook, by Container Type, Value (US$ Billion), 2020-2033
7.1.1. Dry Freight Standard Containers
7.1.2. Refrigerated Containers
7.1.3. Tank Containers
7.1.4. Open Top, Flat Rack and Platform Containers
7.1.5. Special and Regional Formats
7.2. Latin America Container Fleet Market Outlook, by Container Size, Value (US$ Billion), 2020-2033
7.2.1. 20-Foot
7.2.2. 40-Foot Standard
7.2.3. 40-Foot High Cube
7.2.4. 53-Foot Domestic and Pallet-Wide
7.3. Latin America Container Fleet Market Outlook, by Ownership Model, Value (US$ Billion), 2020-2033
7.3.1. Carrier and Shipper Owned Fleets
7.3.2. Container Lessor Fleets
7.3.3. Used and Resale Market
7.4. Latin America Container Fleet Market Outlook, by End Use, Value (US$ Billion), 2020-2033
7.4.1. Consumer Goods and Retail
7.4.2. Food and Agricultural Products
7.4.3. Chemicals and Petrochemicals
7.4.4. Industrial and Machinery
7.4.5. Pharmaceuticals and Healthcare
7.5. Latin America Container Fleet Market Outlook, by Country, Value (US$ Billion), 2020-2033
7.5.1. Brazil Container Fleet Market Outlook, by Container Type, 2020-2033
7.5.2. Brazil Container Fleet Market Outlook, by Container Size, 2020-2033
7.5.3. Brazil Container Fleet Market Outlook, by Ownership Model, 2020-2033
7.5.4. Brazil Container Fleet Market Outlook, by End Use, 2020-2033
7.5.5. Chile Container Fleet Market Outlook, by Container Type, 2020-2033
7.5.6. Chile Container Fleet Market Outlook, by Container Size, 2020-2033
7.5.7. Chile Container Fleet Market Outlook, by Ownership Model, 2020-2033
7.5.8. Chile Container Fleet Market Outlook, by End Use, 2020-2033
7.5.9. Peru Container Fleet Market Outlook, by Container Type, 2020-2033
7.5.10. Peru Container Fleet Market Outlook, by Container Size, 2020-2033
7.5.11. Peru Container Fleet Market Outlook, by Ownership Model, 2020-2033
7.5.12. Peru Container Fleet Market Outlook, by End Use, 2020-2033
7.5.13. Colombia Container Fleet Market Outlook, by Container Type, 2020-2033
7.5.14. Colombia Container Fleet Market Outlook, by Container Size, 2020-2033
7.5.15. Colombia Container Fleet Market Outlook, by Ownership Model, 2020-2033
7.5.16. Colombia Container Fleet Market Outlook, by End Use, 2020-2033
7.5.17. Ecuador Container Fleet Market Outlook, by Container Type, 2020-2033
7.5.18. Ecuador Container Fleet Market Outlook, by Container Size, 2020-2033
7.5.19. Ecuador Container Fleet Market Outlook, by Ownership Model, 2020-2033
7.5.20. Ecuador Container Fleet Market Outlook, by End Use, 2020-2033
8. Middle East & Africa Container Fleet Market Outlook, 2020-2033
8.1. Middle East & Africa Container Fleet Market Outlook, by Container Type, Value (US$ Billion), 2020-2033
8.1.1. Dry Freight Standard Containers
8.1.2. Refrigerated Containers
8.1.3. Tank Containers
8.1.4. Open Top, Flat Rack and Platform Containers
8.1.5. Special and Regional Formats
8.2. Middle East & Africa Container Fleet Market Outlook, by Container Size, Value (US$ Billion), 2020-2033
8.2.1. 20-Foot
8.2.2. 40-Foot Standard
8.2.3. 40-Foot High Cube
8.2.4. 53-Foot Domestic and Pallet-Wide
8.3. Middle East & Africa Container Fleet Market Outlook, by Ownership Model, Value (US$ Billion), 2020-2033
8.3.1. Carrier and Shipper Owned Fleets
8.3.2. Container Lessor Fleets
8.3.3. Used and Resale Market
8.4. Middle East & Africa Container Fleet Market Outlook, by End Use, Value (US$ Billion), 2020-2033
8.4.1. Consumer Goods and Retail
8.4.2. Food and Agricultural Products
8.4.3. Chemicals and Petrochemicals
8.4.4. Industrial and Machinery
8.4.5. Pharmaceuticals and Healthcare
8.5. Middle East & Africa Container Fleet Market Outlook, by Country, Value (US$ Billion), 2020-2033
8.5.1. United Arab Emirates Container Fleet Market Outlook, by Container Type, 2020-2033
8.5.2. United Arab Emirates Container Fleet Market Outlook, by Container Size, 2020-2033
8.5.3. United Arab Emirates Container Fleet Market Outlook, by Ownership Model, 2020-2033
8.5.4. United Arab Emirates Container Fleet Market Outlook, by End Use, 2020-2033
8.5.5. Oman Container Fleet Market Outlook, by Container Type, 2020-2033
8.5.6. Oman Container Fleet Market Outlook, by Container Size, 2020-2033
8.5.7. Oman Container Fleet Market Outlook, by Ownership Model, 2020-2033
8.5.8. Oman Container Fleet Market Outlook, by End Use, 2020-2033
8.5.9. Saudi Arabia Container Fleet Market Outlook, by Container Type, 2020-2033
8.5.10. Saudi Arabia Container Fleet Market Outlook, by Container Size, 2020-2033
8.5.11. Saudi Arabia Container Fleet Market Outlook, by Ownership Model, 2020-2033
8.5.12. Saudi Arabia Container Fleet Market Outlook, by End Use, 2020-2033
8.5.13. Egypt Container Fleet Market Outlook, by Container Type, 2020-2033
8.5.14. Egypt Container Fleet Market Outlook, by Container Size, 2020-2033
8.5.15. Egypt Container Fleet Market Outlook, by Ownership Model, 2020-2033
8.5.16. Egypt Container Fleet Market Outlook, by End Use, 2020-2033
8.5.17. Morocco Container Fleet Market Outlook, by Container Type, 2020-2033
8.5.18. Morocco Container Fleet Market Outlook, by Container Size, 2020-2033
8.5.19. Morocco Container Fleet Market Outlook, by Ownership Model, 2020-2033
8.5.20. Morocco Container Fleet Market Outlook, by End Use, 2020-2033
9. Competitive Landscape
9.1. Market Concentration and Industry Leaders
9.2. Competitive Differentiation
9.3. Strategic Initiatives
9.4. Recent Industry Developments
9.5. Company Profiles
9.5.1. Triton International Limited
9.5.2. Textainer Group Holdings Limited
9.5.3. Seaco Global
9.5.4. Beacon Intermodal Leasing, LLC
9.5.5. SeaCube Container Leasing Ltd.
9.5.6. Touax Group
9.5.7. Florens Asset Management Company Limited
9.5.8. China International Marine Containers (Group) Co., Ltd.
9.5.9. Singamas Container Holdings Limited
9.5.10. Dong Fang International Container (Hong Kong) Co., Ltd.
9.5.11. CARU Containers B.V.
9.5.12. Mitsubishi HC Capital Inc.
9.5.13. Maersk Container Industry A/S
10. Appendix
10.1. Research Methodology
10.2. Report Assumptions
10.3. Acronyms and Abbreviations
| Container Type | Dry Freight Standard Containers, Refrigerated Containers, Tank Containers, Open Top, Flat Rack and Platform Containers, Special and Regional Formats |
| Container Size | 20-Foot, 40-Foot Standard, 40-Foot High Cube, 53-Foot Domestic and Pallet-Wide |
| Ownership Model | Carrier and Shipper Owned Fleets, Container Lessor Fleets, Used and Resale Market |
| End Use | Consumer Goods and Retail, Food and Agricultural Products, Chemicals and Petrochemicals, Industrial and Machinery, Pharmaceuticals and Healthcare |
| Regions | North America, Europe, Asia Pacific, Latin America, Middle East & Africa |
Our Research Methodology
Considering the volatility of business today, traditional approaches to strategizing a game plan can be unfruitful if not detrimental. True ambiguity is no way to determine a forecast. A myriad of predetermined factors must be accounted for such as the degree of risk involved, the magnitude of circumstances, as well as conditions or consequences that are not known or unpredictable. To circumvent binary views that cast uncertainty, the application of market research intelligence to strategically posture, move, and enable actionable outcomes is necessary.
View Methodology
Quality Assured
Rigorous Validation Process

Confidentiality Assured
End-to-end Data Security

Custom Research Services
Tailored To Your Objectives
FAQs
The container fleet market is valued at US$ 18.5 billion in 2026, measured as annual new container production and leasing revenue worldwide.
The market is projected to reach US$ 26.8 billion by 2033, expanding at a 5.4% CAGR and adding US$ 8.3 billion in value.
Dry freight standard containers lead with 72.5% share in 2026, because they carry most general cargo at the lowest cost per unit.
Tank containers grow fastest at a 7.9% CAGR to 2033, as chemical and food-grade liquid shippers replace drums with reusable pressure vessels.
Asia Pacific leads with 61.5% share in 2026, because it builds nearly all new containers and generates the heaviest export cargo volumes.
Related Reports
Micro-mobility Charging Infrastructure Market Size, Share, Insights, Competitive Landscape, and Forecast 2026 to 2033
The global micro-mobility charging infrastructure market is valued at US$9.06 billion in 2026, reaching US$34.02 billion by 2033, growing at a 20.8% CAGR
eCTOL Aircraft Market Size, Share, Insights, Competitive Landscape, and Forecast 2026 to 2033
Explore the eCTOL aircraft market, projected to reach US$ 11.14 billion by 2033 at a 10.6% CAGR, with propulsion, application and regional insights.
Smart EV Charging Networks Market Size, Share, Insights, Competitive Landscape, and Forecast 2026 to 2033
The global smart EV charging networks market is valued at US$9.43 billion in 2026, reaching US$37.07 billion by 2033, growing at a 21.6% CAGR
Ultra High Performance Tire Market Size, Share, Insights, Competitive Landscape, and Forecast 2026 to 2033
The global ultra high performance tire market is valued at US$18.65 billion in 2026, reaching US$38.97 billion by 2033, growing at an 11.1% CAGR
Small Parcels Delivery Market Size, Share, Insights, Competitive Landscape, and Forecast 2026 to 2033
Explore the small parcels delivery market, forecast to reach US$957.5 billion by 2033 at 7.3% CAGR, with service, shipment weight and regional insights.
Advanced Aerial Mobility Market Size, Share, Insights, Competitive Landscape, and Forecast 2026 to 2033
The global advanced aerial mobility market is valued at US$18.51 billion in 2026, reaching US$90.75 billion by 2033, growing at a 25.5% CAGR