



Conveying Equipment Market
Conveying Equipment Market Size, Share, Insights, Competitive Landscape, and Forecast 2026 to 2033
Conveying Equipment Market Size, Share, Insights, Competitive Landscape, and Forecast 2026 to 2033
How Big Is the Conveying Equipment Market in 2026?
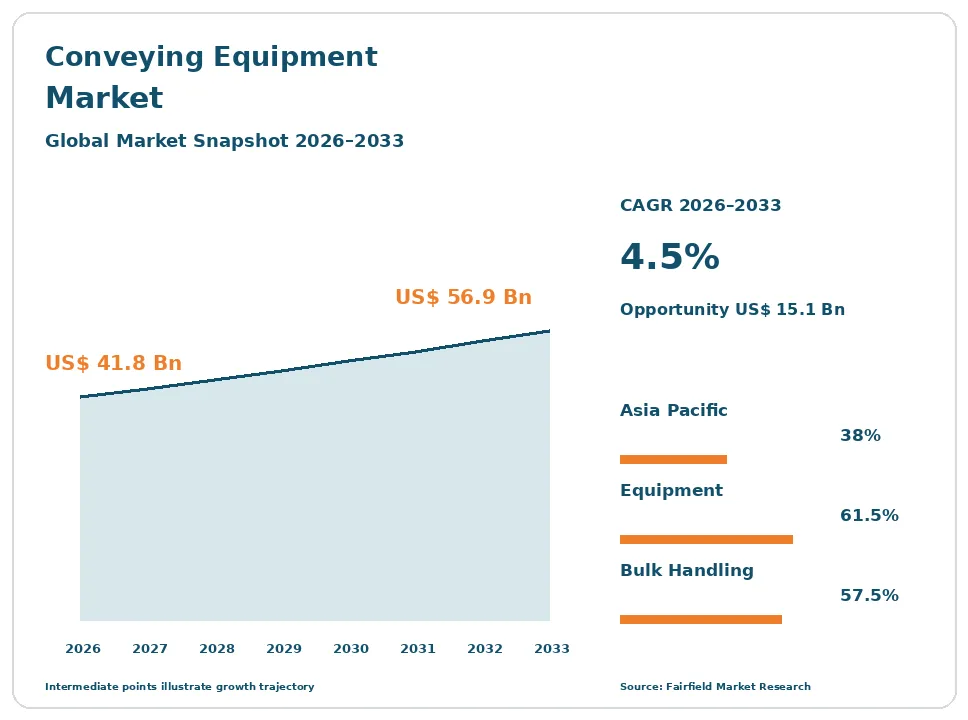
The global conveying equipment market size is expected to be valued at US$ 41.8 billion in 2026 and projected to reach US$ 56.9 billion by 2033, growing at a CAGR of 4.5% between 2026 and 2033.
Between 2020 and 2025 the market grew at roughly 4.1% a year, with heavy bulk handling expanding steadily while warehouse sortation surged and then corrected. Three factors carry the forecast. Mining and port operators are replacing truck haulage with long overland belt conveyor systems to cut diesel and labour cost. Cement, grain and fertiliser terminals are enclosing conveying lines to meet dust and emission rules. Parcel and retail operators have resumed sortation investment after digesting capacity added during the pandemic years. Growth is steady rather than smooth, because the bulk half tracks resource capital spending and the unit-handling half tracks logistics budgets.
Key Report Takeaways
- By Equipment Type: Belt conveyors held a 31.5% share in 2026, while automated sortation and accumulation systems are projected to expand at a 6.8% CAGR through 2033, driven by parcel operators retrofitting throughput density into existing buildings.
- By Offering: Equipment held a 61.5% share in 2026, while aftermarket parts and services are projected to grow at a 5.8% CAGR through 2033, as belting, idler and splice replacement contracts replace reactive spares purchasing.
- By Load Type: Bulk material handling held a 57.5% share in 2026, while unit load handling is projected to advance at a 5.3% CAGR through 2033, supported by warehouse automation retrofits and gentler accumulation control for mixed parcel sizes.
- By End-use Industry: Mining and aggregates held a 22.0% share in 2026, while warehousing and parcel logistics is projected to rise at a 6.5% CAGR through 2033, reflecting rising picking wages in developed logistics markets.
- By Geography: Asia Pacific held a 38.0% share in 2026, while Latin America is projected to grow at a 6.0% CAGR through 2033, led by copper, iron ore and grain terminal conveying investment.
Global Conveying Equipment Market Trends and Insights
Drivers Impact Analysis
| Driver | Impact on CAGR Forecast | Geographic Relevance | Impact Timeline |
| Overland conveying replaces truck haulage in mining and aggregates | High | Asia Pacific, Latin America, Middle East & Africa | Long term ≥4 years |
| Parcel and fulfilment operators resume sortation conveyor investment | Medium | North America, Europe | Medium term 2–4 years |
The two demand forces below act on different halves of the category and on different timelines.
Overland Belt Conveying Displaces Truck Haulage and Lifts Conveying Equipment Demand in Mining
Mining and aggregate operators are the largest buyers of conveying equipment, and they are shifting ore and overburden movement from haul trucks to long overland and in-pit belt conveyors. One overland installation can replace dozens of trucks, cutting diesel burn, tyre consumption and driver hours. That substitution raises demand for high-strength belting, idlers, pulleys, drive packages and transfer chutes across copper, iron ore, phosphate and coal operations.
The mechanism is cost and emissions arithmetic. Diesel haulage cost climbs with pit depth and haul distance, while an electrically driven belt consumes far less energy per tonne-kilometre and can recover energy on downhill runs. Operators working to emissions targets treat conveying as the cheapest available abatement in material movement. DIN 22101 and ISO 5048 design practice, with CEMA component standards, give engineers a settled basis for sizing these systems.
Parcel and Fulfilment Restart Revives Sortation and Accumulation Conveying Orders
Unit-handling demand is recovering after a sharp correction in conveying equipment orders. Parcel carriers and retailers over-built automated fulfilment capacity during the pandemic years, then paused while they digested it. That pause has ended. Operators are ordering sortation, accumulation and merge conveyors again, but for throughput density and labour replacement inside existing buildings rather than for new floor space. Retrofit projects favour modular, lower-footprint lines.
The mechanism is labour economics inside the warehouse. Picking and sortation wages have risen faster than building rents across most developed markets, so operators now justify conveyor automation on headcount rather than on capacity. Parcel volumes have also shifted towards smaller and more variable items, which demands finer sortation and gentler accumulation. ISO 13857 safety distances and IEC 61508 functional safety practice shape the guarding and controls on these warehouse automation lines.
Restraints Impact Analysis
| Restraint | Impact on CAGR Forecast | Geographic Relevance | Impact Timeline |
| Capital-cycle dependence and the warehouse automation correction | High | Global | Short term ≤2 years |
| Steel, rubber and installation labour cost on fixed-price projects | Medium | North America, Europe, Asia Pacific | Medium term 2–4 years |
Both constraints below act on margin and schedule rather than on underlying material handling requirements.
Capital-Cycle Dependence Limits Order Visibility Across the Conveying Equipment Market
Conveying equipment revenue follows other people’s capital budgets, which makes order books volatile. Heavy bulk projects depend on mining, cement and port investment decisions that can be deferred for years when commodity prices weaken. Unit-handling projects depend on retail logistics budgets, and the recent correction showed how quickly those stop. Vendors must carry engineering and fabrication capacity through troughs they cannot reliably forecast.
The underlying cause is the engineered-to-order nature of large systems. An overland conveyor is a multi-year project involving site survey, civil works, structural steel and commissioning, so a single deferral removes a large block of revenue at once. On shorter routes, road haulage remains a genuine alternative, because the capital cost of a fixed conveyor cannot be justified below a certain tonnage and distance. That boundary caps addressable bulk material handling equipment demand.
Steel, Rubber and Installation Labour Costs Compress Conveying Equipment Project Margins
Input cost and site labour squeeze margins on fixed-price conveying contracts. Structural steel, steel cord, rubber compound and electric motors account for most of the cost of a bulk conveying system, and those prices move independently of the signed contract. When they rise after award, the builder absorbs the difference. Belting is the most exposed item, because rubber and reinforcement are bought in long continuous lengths.
The second cost source is people. Large installations need millwrights, belt splicers, structural erectors and commissioning engineers, and the pool of experienced crews has thinned in several mining and port regions. Splicing a steel-cord belt is skilled work that cannot be compressed. Scarce crews extend schedules, raise travel and accommodation cost, and push vendors to decline work rather than risk liquidated damages on late handover.
Market Opportunities
Both opportunities below monetise the installed base rather than waiting for new project awards.
Conveyor Belt Monitoring Opens a Recurring Service Revenue Pool in Bulk Conveying
Conveyor belt monitoring converts a spare-parts business into a service contract. Belting and idlers already generate the recurring money in heavy bulk conveying, because a long overland belt is replaced in sections across its life. Embedding rip detection, splice monitoring, thermal scanning and idler acoustic sensing lets suppliers sell inspection, analytics and scheduled replacement instead of reactive spares. Contract margins exceed component margins.
Mine and terminal operators create this demand because an unplanned belt failure stops the whole site. A torn belt on a single-line overland conveyor halts production until a splice is made, which can take a full shift. Reliability engineers therefore pay for early warning. Suppliers holding installed belting, service branches and splicing crews are best placed to capture it, and remote monitoring makes coverage of distant sites practical.
Energy-Efficient Drives and Low-Rolling-Resistance Belting Create a Conveying Equipment Upgrade Market
Drive and belting upgrades open a replacement revenue pool that does not depend on new projects. Conveyors are often the largest single electricity consumer on a mine or cement plant, so a few percentage points of efficiency are worth real money. Low-rolling-resistance belt covers, high-efficiency gearless and permanent-magnet drive packages, and variable speed control on partly loaded belts all pay back without new civil works.
Operators running ageing bulk handling infrastructure create the demand, especially where electricity tariffs or carbon costs have climbed. Ecodesign requirements for electric motors and variable speed drives in the European Union have already pushed conveyor drive packages towards higher efficiency classes, and comparable motor rules apply in other jurisdictions. Suppliers of belting, drives and controls can sell the upgrade as a measured energy saving rather than as a capital request.
Segment Analysis
By Equipment Type: Belt Conveyors Hold Scale While Sortation Systems Set the Pace
Belt conveyors led with a 31.5% share in 2026, because they move the largest tonnages at the lowest cost per tonne across mining, cement, ports and power. Troughed and pipe belt designs handle long distances and awkward terrain that no other equipment type can serve economically. Automated sortation and accumulation systems are the fastest-growing type at a 6.8% CAGR, as parcel and retail operators upgrade induction, merge and divert sections inside existing buildings. Screw conveyors and feeders remain essential in powder and sludge duties, while pneumatic conveying holds its place in enclosed food, plastics and cement handling. Chain conveyors are counted here only as a segment. The practical implication is that suppliers need two engineering cultures: long-life structural design for bulk material handling equipment, and fast, modular design for unit handling.
By Offering: Equipment Dominates Revenue While Aftermarket Services Grow Faster
Equipment accounted for 61.5% of 2026 revenue, since the machine itself carries the largest ticket on both overland projects and fulfilment lines. Installation and integration services take a meaningful further share, particularly on greenfield terminals where civil and structural scope is substantial. Aftermarket parts and services are the fastest-growing offering at a 5.8% CAGR, because belting, idlers, pulleys, splices and drive overhauls repeat across a twenty-year asset life. Operators increasingly buy those parts under framework agreements tied to availability targets rather than as discrete purchase orders. Conveyor belt monitoring data makes that shift easier to price, since consumption becomes predictable. For vendors, the business implication is a gradual earnings mix change: project revenue remains lumpy, while service revenue smooths the cycle and builds switching cost at each site.
By Load Type: Bulk Material Handling Leads While Unit Load Handling Accelerates
Bulk material handling represented 57.5% of the market in 2026, reflecting the scale of mining, ports, cement, power and grain tonnages moved continuously every day. These are engineered-to-order systems with long lives, heavy structural content and a substantial consumables tail. Unit load handling is growing faster at a 5.3% CAGR, carried by warehouse automation, parcel sortation and assembly line transfer. The two halves behave differently: bulk orders are decided by mine and terminal capital committees over multi-year horizons, while unit-load orders follow logistics budget cycles that can turn within a quarter. Dust control, explosion protection and transfer-point design dominate bulk specifications, whereas footprint, changeover flexibility and controls integration dominate unit-load specifications. Suppliers that treat the two as one product line usually lose on either engineering depth or delivery speed.
By End-use Industry: Mining and Aggregates Lead as Parcel Logistics Expands Quickest
Mining and aggregates held a 22.0% share in 2026, the largest single end-use, because ore, overburden and crushed rock are moved in volumes that justify permanent conveying infrastructure. Bulk terminals and ports, cement and power, and agriculture and grain together form the rest of the heavy bulk base, each with its own dust, moisture and abrasion problems. Warehousing and parcel logistics is the fastest-growing industry at a 6.5% CAGR, driven by labour cost and by the need to handle smaller, more variable items. Food and beverage buyers prioritise washdown construction and hygienic design, while chemicals buyers prioritise containment. General manufacturing provides steady replacement demand for roller and gravity lines. The breadth matters commercially, because no single industry downturn removes more than roughly a fifth of demand.
Geography Analysis
North America Anchors Conveyor Aftermarket and Parcel Sortation Demand
North America held 26.5% of global revenue in 2026 and is forecast to grow at 4.3% through 2033. The region combines a large installed base of ageing bulk conveying in coal, aggregates, grain and potash with the world’s most automated parcel network. That mix tilts revenue towards replacement belting, idlers and drive upgrades rather than greenfield systems. The United States and Canada dominate, with grain and fertiliser terminal work concentrated along inland waterways and export ports. Mine dust control obligations have pushed operators towards enclosed transfer points and covered conveyors. Retrofit sortation projects in existing fulfilment buildings are the main source of unit-handling orders, since vacancy and rent conditions discourage new construction. Skilled splicing and installation crews remain scarce, which lengthens project schedules and supports service pricing.
Europe Directs Conveying Equipment Spending Towards Energy Efficiency and Safety Compliance
Europe accounted for 23.0% of the market in 2026, with growth of 3.6% through 2033, the slowest of the five regions. Industrial capacity is largely built out, so spending concentrates on replacement, efficiency and compliance rather than expansion. Germany, France, Italy, Poland and the Nordic countries lead, supported by cement, steel, recycling, port and food processing activity. Ecodesign requirements for motors and variable speed drives have made high-efficiency conveyor drive packages the default specification. EN 620 and EN 618 safety requirements for fixed belt and bulk handling conveyors, together with ATEX explosion protection duties in grain, sugar and powder plants, materially shape design and raise content per metre. High electricity prices make low-rolling-resistance belting and variable speed control unusually attractive, which supports an active upgrade market across the installed base.
Which Region Is Leading the Conveying Equipment Market?
Asia Pacific leads the conveying equipment market with a 38.0% share in 2026, growing at 4.9% through 2033. Leadership rests on sheer tonnage: the region mines, imports, processes and ships more bulk material than anywhere else. China and India operate vast coal, iron ore, cement and steel conveying networks, while Australia and Indonesia supply export terminals that run long overland and shiploading systems. Japan and South Korea contribute precision unit handling for electronics and automotive plants. Grain and fertiliser import terminals across the region continue to add enclosed conveying to control dust losses. Domestic manufacturers compete hard on price in standard belt, roller and screw equipment, which keeps margins thin, while engineered overland systems and high-strength belting still attract international suppliers and specialist design houses.
Which Region Is Growing Fastest in the Conveying Equipment Market?
Latin America is growing fastest in the conveying equipment market, at a 6.0% CAGR through 2033, from a 6.0% share in 2026. The driver is resource and agricultural export capacity. Copper expansion in Chile and Peru favours in-pit crushing with long overland conveying, because haul distances and pit depths have made truck fleets expensive. Iron ore and grain handling in Brazil and Argentina is adding shiploaders, stackers, reclaimers and bucket elevators at river and coastal terminals. Fertiliser import infrastructure is expanding alongside. The barriers are real: project financing is costly, permitting is slow, and currency movement complicates imported equipment pricing. The opportunity lies in long-life service contracts, since remote mine sites value guaranteed belting supply and splicing crews more than the lowest equipment price.
Middle East & Africa Builds Port, Phosphate and Cement Conveying Capacity
Middle East & Africa held 6.5% of revenue in 2026 and is forecast to grow at 5.4% through 2033. Phosphate and potash handling in Morocco and Jordan, cement capacity across the Gulf and Egypt, and copper and cobalt corridors in Zambia and the Democratic Republic of the Congo generate steady conveying demand. Saudi Arabia and the United Arab Emirates continue to expand port and industrial city material handling infrastructure. Barriers include limited local fabrication capability, long lead times for imported belting, extreme ambient temperatures that shorten component life, and scarce maintenance skills at remote sites. The clearest opportunity is in service and training packages bundled with equipment, since operators consistently lose more money to unplanned stoppages than they would spend on structured preventive maintenance programmes.
Competitive Landscape
The conveying equipment market is fragmented, and more so than most capital goods categories. No supplier holds a double-digit global share, because the category spans engineered overland systems, commodity roller lines, belting, drives and warehouse sortation, each with different buyers and economics. Heavy bulk engineering is concentrated among a handful of international houses with structural design and project management depth, while regional fabricators dominate standard conveyors in their home markets on price and proximity. Belting is a separate oligopoly built around rubber and tyre manufacturers. Consolidation has been steady rather than dramatic, usually when a system builder buys service branches or a controls specialist.
Competition turns on different factors in each half. In bulk handling, buyers weigh design references on comparable duties, guaranteed availability, energy consumption per tonne, and the supplier’s ability to put splicing and maintenance crews on site. In unit handling, buyers weigh throughput rates, footprint, changeover flexibility, controls and software integration, and delivery schedule. New entrants are more visible in unit handling, where robotics companies, software integrators and modular conveyor specialists have entered from adjacent motion and automation markets rather than from traditional conveyor engineering.
Strategic activity concentrates on three areas. Suppliers are extending into aftermarket services and conveyor belt monitoring to stabilise earnings between project cycles. They are expanding local service branches close to mining districts and port clusters, since response time decides contract renewals. They are also investing in energy-efficient drive and belting technology, because electricity consumption is now a scored criterion in tenders rather than a footnote. Vendor strategy overall is moving from selling machines towards selling guaranteed material throughput, with financing, monitoring and maintenance attached, and that shift favours firms with installed base density rather than those with the broadest catalogue.
Conveying Equipment Industry Leaders
- FLSmidth
- Metso
- Beumer Group
- Daifuku Co., Ltd.
- Continental AG
Recent Industry Developments
- April 2024: The U.S. Mine Safety and Health Administration issued its final rule lowering the permissible exposure limit for respirable crystalline silica in mining – it pushes operators towards enclosed conveyors, covered transfer points and dust suppression at every handling stage.
- July 2023: The second tier of the European Union ecodesign requirements for electric motors and variable speed drives took effect, extending the highest efficiency class to larger motors – it made high-efficiency drive packages the default specification on new conveyor installations in the region.
- 2025: The National Fire Protection Association issued a consolidated standard for combustible dusts and particulate solids, merging its previously separate agricultural, wood, metal and general dust documents – it simplifies explosion protection design for grain, sugar, flour and powder conveying systems.
Companies Covered in the Report
- FLSmidth
- Metso
- TAKRAF Group
- Beumer Group
- Daifuku Co., Ltd.
- Dematic
- Vanderlande Industries
- Interroll Holding AG
- Continental AG
- Bridgestone Corporation
- Fenner Dunlop
- Hytrol Conveyor Company
- Sandvik AB
- Schenck Process Group
Conveying Equipment Market Report Scope
This report measures global conveying equipment revenue, including belt, roller and gravity, screw, bucket, pneumatic, vibratory, overhead and sortation conveying, together with drives, belting, controls, installation and aftermarket services. Chain conveyors are included only as a segment and are examined in depth in a separate report. Passenger elevators and escalators are excluded. The base year is 2025, and the forecast period runs from 2026 to 2033 in US$ Billion.
Equipment Type
- Belt conveyors (troughed, flat and pipe)
- Roller and gravity conveyors
- Chain conveyors
- Screw conveyors and feeders
- Bucket elevators
- Pneumatic conveying systems (dilute and dense phase)
- Vibratory and oscillating conveyors
- Overhead and monorail conveyors
- Automated sortation and accumulation systems
Offering
- Equipment
- Installation and integration services
- Aftermarket parts and services
Load Type
- Bulk material handling
- Unit load handling
End-use Industry
- Mining and aggregates
- Bulk terminals and ports
- Cement and power
- Food and beverage
- Agriculture and grain
- Chemicals
- Warehousing and parcel logistics
- General manufacturing
Regions
- North America
- Europe
- Asia Pacific
- Latin America
- Middle East & Africa
Key Questions Answered in the Report
How large is the conveying equipment market in 2026?
The global conveying equipment market is estimated at US$ 41.8 billion in 2026, covering bulk handling and unit handling equipment, installation and aftermarket services worldwide.
What is the forecast size and CAGR of the conveying equipment market?
The market is projected to reach US$ 56.9 billion by 2033, expanding at a 4.5% CAGR and adding US$ 15.1 billion of absolute revenue opportunity.
Which equipment type leads the conveying equipment market?
Belt conveyors lead with a 31.5% share in 2026, because they move the largest tonnages at the lowest cost per tonne handled.
Which geography is growing fastest in the conveying equipment market?
Latin America is growing fastest at a 6.0% CAGR through 2033, driven by copper, iron ore, grain and fertiliser terminal conveying investment.
How concentrated is the conveying equipment market?
Concentration is low. No supplier holds a double-digit global share, because engineered bulk systems, commodity conveyors, belting and sortation have different buyers.
1. Executive Summary
1.1. Global Conveying Equipment Market Snapshot
1.2. Future Projections, 2026-2033
1.3. Key Market Trends
1.4. Regional Snapshot
2. Market Overview
2.1. Market Definition and Report Scope
2.2. Historical Market Trends, 2020-2025
2.3. Market Dynamics
2.3.1. Drivers Impact Analysis
2.3.1.1. Overland Belt Conveying Displaces Truck Haulage and Lifts Conveying Equipment Demand in Mining
2.3.1.2. Parcel and Fulfilment Restart Revives Sortation and Accumulation Conveying Orders
2.3.2. Restraints Impact Analysis
2.3.2.1. Capital-Cycle Dependence Limits Order Visibility Across the Conveying Equipment Market
2.3.2.2. Steel, Rubber and Installation Labour Costs Compress Conveying Equipment Project Margins
2.3.3. Market Opportunities
2.3.3.1. Conveyor Belt Monitoring Opens a Recurring Service Revenue Pool in Bulk Conveying
2.3.3.2. Energy-Efficient Drives and Low-Rolling-Resistance Belting Create a Conveying Equipment Upgrade Market
3. Global Conveying Equipment Market Outlook, 2020-2033
3.1. Global Conveying Equipment Market Outlook, by Equipment Type, Value (US$ Billion), 2020-2033
3.1.1. Belt conveyors (troughed, flat and pipe)
3.1.2. Roller and gravity conveyors
3.1.3. Chain conveyors
3.1.4. Screw conveyors and feeders
3.1.5. Bucket elevators
3.1.6. Pneumatic conveying systems (dilute and dense phase)
3.1.7. Vibratory and oscillating conveyors
3.1.8. Overhead and monorail conveyors
3.1.9. Automated sortation and accumulation systems
3.2. Global Conveying Equipment Market Outlook, by Offering, Value (US$ Billion), 2020-2033
3.2.1. Equipment
3.2.2. Installation and integration services
3.2.3. Aftermarket parts and services
3.3. Global Conveying Equipment Market Outlook, by Load Type, Value (US$ Billion), 2020-2033
3.3.1. Bulk material handling
3.3.2. Unit load handling
3.4. Global Conveying Equipment Market Outlook, by End-use Industry, Value (US$ Billion), 2020-2033
3.4.1. Mining and aggregates
3.4.2. Bulk terminals and ports
3.4.3. Cement and power
3.4.4. Food and beverage
3.4.5. Agriculture and grain
3.4.6. Chemicals
3.4.7. Warehousing and parcel logistics
3.4.8. General manufacturing
3.5. Global Conveying Equipment Market Outlook, by Region, Value (US$ Billion), 2020-2033
3.5.1. North America
3.5.2. Europe
3.5.3. Asia Pacific
3.5.4. Latin America
3.5.5. Middle East & Africa
4. North America Conveying Equipment Market Outlook, 2020-2033
4.1. North America Conveying Equipment Market Outlook, by Equipment Type, Value (US$ Billion), 2020-2033
4.1.1. Belt conveyors (troughed, flat and pipe)
4.1.2. Roller and gravity conveyors
4.1.3. Chain conveyors
4.1.4. Screw conveyors and feeders
4.1.5. Bucket elevators
4.1.6. Pneumatic conveying systems (dilute and dense phase)
4.1.7. Vibratory and oscillating conveyors
4.1.8. Overhead and monorail conveyors
4.1.9. Automated sortation and accumulation systems
4.2. North America Conveying Equipment Market Outlook, by Offering, Value (US$ Billion), 2020-2033
4.2.1. Equipment
4.2.2. Installation and integration services
4.2.3. Aftermarket parts and services
4.3. North America Conveying Equipment Market Outlook, by Load Type, Value (US$ Billion), 2020-2033
4.3.1. Bulk material handling
4.3.2. Unit load handling
4.4. North America Conveying Equipment Market Outlook, by End-use Industry, Value (US$ Billion), 2020-2033
4.4.1. Mining and aggregates
4.4.2. Bulk terminals and ports
4.4.3. Cement and power
4.4.4. Food and beverage
4.4.5. Agriculture and grain
4.4.6. Chemicals
4.4.7. Warehousing and parcel logistics
4.4.8. General manufacturing
4.5. North America Conveying Equipment Market Outlook, by Country, Value (US$ Billion), 2020-2033
4.5.1. United States Conveying Equipment Market Outlook, by Equipment Type, 2020-2033
4.5.2. United States Conveying Equipment Market Outlook, by Offering, 2020-2033
4.5.3. United States Conveying Equipment Market Outlook, by Load Type, 2020-2033
4.5.4. United States Conveying Equipment Market Outlook, by End-use Industry, 2020-2033
4.5.5. Canada Conveying Equipment Market Outlook, by Equipment Type, 2020-2033
4.5.6. Canada Conveying Equipment Market Outlook, by Offering, 2020-2033
4.5.7. Canada Conveying Equipment Market Outlook, by Load Type, 2020-2033
4.5.8. Canada Conveying Equipment Market Outlook, by End-use Industry, 2020-2033
5. Europe Conveying Equipment Market Outlook, 2020-2033
5.1. Europe Conveying Equipment Market Outlook, by Equipment Type, Value (US$ Billion), 2020-2033
5.1.1. Belt conveyors (troughed, flat and pipe)
5.1.2. Roller and gravity conveyors
5.1.3. Chain conveyors
5.1.4. Screw conveyors and feeders
5.1.5. Bucket elevators
5.1.6. Pneumatic conveying systems (dilute and dense phase)
5.1.7. Vibratory and oscillating conveyors
5.1.8. Overhead and monorail conveyors
5.1.9. Automated sortation and accumulation systems
5.2. Europe Conveying Equipment Market Outlook, by Offering, Value (US$ Billion), 2020-2033
5.2.1. Equipment
5.2.2. Installation and integration services
5.2.3. Aftermarket parts and services
5.3. Europe Conveying Equipment Market Outlook, by Load Type, Value (US$ Billion), 2020-2033
5.3.1. Bulk material handling
5.3.2. Unit load handling
5.4. Europe Conveying Equipment Market Outlook, by End-use Industry, Value (US$ Billion), 2020-2033
5.4.1. Mining and aggregates
5.4.2. Bulk terminals and ports
5.4.3. Cement and power
5.4.4. Food and beverage
5.4.5. Agriculture and grain
5.4.6. Chemicals
5.4.7. Warehousing and parcel logistics
5.4.8. General manufacturing
5.5. Europe Conveying Equipment Market Outlook, by Country and Subregion, Value (US$ Billion), 2020-2033
5.5.1. Germany Conveying Equipment Market Outlook, by Equipment Type, 2020-2033
5.5.2. Germany Conveying Equipment Market Outlook, by Offering, 2020-2033
5.5.3. Germany Conveying Equipment Market Outlook, by Load Type, 2020-2033
5.5.4. Germany Conveying Equipment Market Outlook, by End-use Industry, 2020-2033
5.5.5. France Conveying Equipment Market Outlook, by Equipment Type, 2020-2033
5.5.6. France Conveying Equipment Market Outlook, by Offering, 2020-2033
5.5.7. France Conveying Equipment Market Outlook, by Load Type, 2020-2033
5.5.8. France Conveying Equipment Market Outlook, by End-use Industry, 2020-2033
5.5.9. Italy Conveying Equipment Market Outlook, by Equipment Type, 2020-2033
5.5.10. Italy Conveying Equipment Market Outlook, by Offering, 2020-2033
5.5.11. Italy Conveying Equipment Market Outlook, by Load Type, 2020-2033
5.5.12. Italy Conveying Equipment Market Outlook, by End-use Industry, 2020-2033
5.5.13. Poland Conveying Equipment Market Outlook, by Equipment Type, 2020-2033
5.5.14. Poland Conveying Equipment Market Outlook, by Offering, 2020-2033
5.5.15. Poland Conveying Equipment Market Outlook, by Load Type, 2020-2033
5.5.16. Poland Conveying Equipment Market Outlook, by End-use Industry, 2020-2033
5.5.17. Nordic Conveying Equipment Market Outlook, by Equipment Type, 2020-2033
5.5.18. Nordic Conveying Equipment Market Outlook, by Offering, 2020-2033
5.5.19. Nordic Conveying Equipment Market Outlook, by Load Type, 2020-2033
5.5.20. Nordic Conveying Equipment Market Outlook, by End-use Industry, 2020-2033
6. Asia Pacific Conveying Equipment Market Outlook, 2020-2033
6.1. Asia Pacific Conveying Equipment Market Outlook, by Equipment Type, Value (US$ Billion), 2020-2033
6.1.1. Belt conveyors (troughed, flat and pipe)
6.1.2. Roller and gravity conveyors
6.1.3. Chain conveyors
6.1.4. Screw conveyors and feeders
6.1.5. Bucket elevators
6.1.6. Pneumatic conveying systems (dilute and dense phase)
6.1.7. Vibratory and oscillating conveyors
6.1.8. Overhead and monorail conveyors
6.1.9. Automated sortation and accumulation systems
6.2. Asia Pacific Conveying Equipment Market Outlook, by Offering, Value (US$ Billion), 2020-2033
6.2.1. Equipment
6.2.2. Installation and integration services
6.2.3. Aftermarket parts and services
6.3. Asia Pacific Conveying Equipment Market Outlook, by Load Type, Value (US$ Billion), 2020-2033
6.3.1. Bulk material handling
6.3.2. Unit load handling
6.4. Asia Pacific Conveying Equipment Market Outlook, by End-use Industry, Value (US$ Billion), 2020-2033
6.4.1. Mining and aggregates
6.4.2. Bulk terminals and ports
6.4.3. Cement and power
6.4.4. Food and beverage
6.4.5. Agriculture and grain
6.4.6. Chemicals
6.4.7. Warehousing and parcel logistics
6.4.8. General manufacturing
6.5. Asia Pacific Conveying Equipment Market Outlook, by Country, Value (US$ Billion), 2020-2033
6.5.1. China Conveying Equipment Market Outlook, by Equipment Type, 2020-2033
6.5.2. China Conveying Equipment Market Outlook, by Offering, 2020-2033
6.5.3. China Conveying Equipment Market Outlook, by Load Type, 2020-2033
6.5.4. China Conveying Equipment Market Outlook, by End-use Industry, 2020-2033
6.5.5. India Conveying Equipment Market Outlook, by Equipment Type, 2020-2033
6.5.6. India Conveying Equipment Market Outlook, by Offering, 2020-2033
6.5.7. India Conveying Equipment Market Outlook, by Load Type, 2020-2033
6.5.8. India Conveying Equipment Market Outlook, by End-use Industry, 2020-2033
6.5.9. Australia Conveying Equipment Market Outlook, by Equipment Type, 2020-2033
6.5.10. Australia Conveying Equipment Market Outlook, by Offering, 2020-2033
6.5.11. Australia Conveying Equipment Market Outlook, by Load Type, 2020-2033
6.5.12. Australia Conveying Equipment Market Outlook, by End-use Industry, 2020-2033
6.5.13. Indonesia Conveying Equipment Market Outlook, by Equipment Type, 2020-2033
6.5.14. Indonesia Conveying Equipment Market Outlook, by Offering, 2020-2033
6.5.15. Indonesia Conveying Equipment Market Outlook, by Load Type, 2020-2033
6.5.16. Indonesia Conveying Equipment Market Outlook, by End-use Industry, 2020-2033
6.5.17. Japan Conveying Equipment Market Outlook, by Equipment Type, 2020-2033
6.5.18. Japan Conveying Equipment Market Outlook, by Offering, 2020-2033
6.5.19. Japan Conveying Equipment Market Outlook, by Load Type, 2020-2033
6.5.20. Japan Conveying Equipment Market Outlook, by End-use Industry, 2020-2033
6.5.21. South Korea Conveying Equipment Market Outlook, by Equipment Type, 2020-2033
6.5.22. South Korea Conveying Equipment Market Outlook, by Offering, 2020-2033
6.5.23. South Korea Conveying Equipment Market Outlook, by Load Type, 2020-2033
6.5.24. South Korea Conveying Equipment Market Outlook, by End-use Industry, 2020-2033
7. Latin America Conveying Equipment Market Outlook, 2020-2033
7.1. Latin America Conveying Equipment Market Outlook, by Equipment Type, Value (US$ Billion), 2020-2033
7.1.1. Belt conveyors (troughed, flat and pipe)
7.1.2. Roller and gravity conveyors
7.1.3. Chain conveyors
7.1.4. Screw conveyors and feeders
7.1.5. Bucket elevators
7.1.6. Pneumatic conveying systems (dilute and dense phase)
7.1.7. Vibratory and oscillating conveyors
7.1.8. Overhead and monorail conveyors
7.1.9. Automated sortation and accumulation systems
7.2. Latin America Conveying Equipment Market Outlook, by Offering, Value (US$ Billion), 2020-2033
7.2.1. Equipment
7.2.2. Installation and integration services
7.2.3. Aftermarket parts and services
7.3. Latin America Conveying Equipment Market Outlook, by Load Type, Value (US$ Billion), 2020-2033
7.3.1. Bulk material handling
7.3.2. Unit load handling
7.4. Latin America Conveying Equipment Market Outlook, by End-use Industry, Value (US$ Billion), 2020-2033
7.4.1. Mining and aggregates
7.4.2. Bulk terminals and ports
7.4.3. Cement and power
7.4.4. Food and beverage
7.4.5. Agriculture and grain
7.4.6. Chemicals
7.4.7. Warehousing and parcel logistics
7.4.8. General manufacturing
7.5. Latin America Conveying Equipment Market Outlook, by Country, Value (US$ Billion), 2020-2033
7.5.1. Chile Conveying Equipment Market Outlook, by Equipment Type, 2020-2033
7.5.2. Chile Conveying Equipment Market Outlook, by Offering, 2020-2033
7.5.3. Chile Conveying Equipment Market Outlook, by Load Type, 2020-2033
7.5.4. Chile Conveying Equipment Market Outlook, by End-use Industry, 2020-2033
7.5.5. Peru Conveying Equipment Market Outlook, by Equipment Type, 2020-2033
7.5.6. Peru Conveying Equipment Market Outlook, by Offering, 2020-2033
7.5.7. Peru Conveying Equipment Market Outlook, by Load Type, 2020-2033
7.5.8. Peru Conveying Equipment Market Outlook, by End-use Industry, 2020-2033
7.5.9. Brazil Conveying Equipment Market Outlook, by Equipment Type, 2020-2033
7.5.10. Brazil Conveying Equipment Market Outlook, by Offering, 2020-2033
7.5.11. Brazil Conveying Equipment Market Outlook, by Load Type, 2020-2033
7.5.12. Brazil Conveying Equipment Market Outlook, by End-use Industry, 2020-2033
7.5.13. Argentina Conveying Equipment Market Outlook, by Equipment Type, 2020-2033
7.5.14. Argentina Conveying Equipment Market Outlook, by Offering, 2020-2033
7.5.15. Argentina Conveying Equipment Market Outlook, by Load Type, 2020-2033
7.5.16. Argentina Conveying Equipment Market Outlook, by End-use Industry, 2020-2033
8. Middle East & Africa Conveying Equipment Market Outlook, 2020-2033
8.1. Middle East & Africa Conveying Equipment Market Outlook, by Equipment Type, Value (US$ Billion), 2020-2033
8.1.1. Belt conveyors (troughed, flat and pipe)
8.1.2. Roller and gravity conveyors
8.1.3. Chain conveyors
8.1.4. Screw conveyors and feeders
8.1.5. Bucket elevators
8.1.6. Pneumatic conveying systems (dilute and dense phase)
8.1.7. Vibratory and oscillating conveyors
8.1.8. Overhead and monorail conveyors
8.1.9. Automated sortation and accumulation systems
8.2. Middle East & Africa Conveying Equipment Market Outlook, by Offering, Value (US$ Billion), 2020-2033
8.2.1. Equipment
8.2.2. Installation and integration services
8.2.3. Aftermarket parts and services
8.3. Middle East & Africa Conveying Equipment Market Outlook, by Load Type, Value (US$ Billion), 2020-2033
8.3.1. Bulk material handling
8.3.2. Unit load handling
8.4. Middle East & Africa Conveying Equipment Market Outlook, by End-use Industry, Value (US$ Billion), 2020-2033
8.4.1. Mining and aggregates
8.4.2. Bulk terminals and ports
8.4.3. Cement and power
8.4.4. Food and beverage
8.4.5. Agriculture and grain
8.4.6. Chemicals
8.4.7. Warehousing and parcel logistics
8.4.8. General manufacturing
8.5. Middle East & Africa Conveying Equipment Market Outlook, by Country, Value (US$ Billion), 2020-2033
8.5.1. Morocco Conveying Equipment Market Outlook, by Equipment Type, 2020-2033
8.5.2. Morocco Conveying Equipment Market Outlook, by Offering, 2020-2033
8.5.3. Morocco Conveying Equipment Market Outlook, by Load Type, 2020-2033
8.5.4. Morocco Conveying Equipment Market Outlook, by End-use Industry, 2020-2033
8.5.5. Jordan Conveying Equipment Market Outlook, by Equipment Type, 2020-2033
8.5.6. Jordan Conveying Equipment Market Outlook, by Offering, 2020-2033
8.5.7. Jordan Conveying Equipment Market Outlook, by Load Type, 2020-2033
8.5.8. Jordan Conveying Equipment Market Outlook, by End-use Industry, 2020-2033
8.5.9. Egypt Conveying Equipment Market Outlook, by Equipment Type, 2020-2033
8.5.10. Egypt Conveying Equipment Market Outlook, by Offering, 2020-2033
8.5.11. Egypt Conveying Equipment Market Outlook, by Load Type, 2020-2033
8.5.12. Egypt Conveying Equipment Market Outlook, by End-use Industry, 2020-2033
8.5.13. Zambia Conveying Equipment Market Outlook, by Equipment Type, 2020-2033
8.5.14. Zambia Conveying Equipment Market Outlook, by Offering, 2020-2033
8.5.15. Zambia Conveying Equipment Market Outlook, by Load Type, 2020-2033
8.5.16. Zambia Conveying Equipment Market Outlook, by End-use Industry, 2020-2033
8.5.17. Democratic Republic of the Congo Conveying Equipment Market Outlook, by Equipment Type, 2020-2033
8.5.18. Democratic Republic of the Congo Conveying Equipment Market Outlook, by Offering, 2020-2033
8.5.19. Democratic Republic of the Congo Conveying Equipment Market Outlook, by Load Type, 2020-2033
8.5.20. Democratic Republic of the Congo Conveying Equipment Market Outlook, by End-use Industry, 2020-2033
8.5.21. Saudi Arabia Conveying Equipment Market Outlook, by Equipment Type, 2020-2033
8.5.22. Saudi Arabia Conveying Equipment Market Outlook, by Offering, 2020-2033
8.5.23. Saudi Arabia Conveying Equipment Market Outlook, by Load Type, 2020-2033
8.5.24. Saudi Arabia Conveying Equipment Market Outlook, by End-use Industry, 2020-2033
8.5.25. United Arab Emirates Conveying Equipment Market Outlook, by Equipment Type, 2020-2033
8.5.26. United Arab Emirates Conveying Equipment Market Outlook, by Offering, 2020-2033
8.5.27. United Arab Emirates Conveying Equipment Market Outlook, by Load Type, 2020-2033
8.5.28. United Arab Emirates Conveying Equipment Market Outlook, by End-use Industry, 2020-2033
9. Competitive Landscape
9.1. Market Concentration and Industry Leaders
9.2. Competitive Differentiation
9.3. Strategic Initiatives
9.4. Recent Industry Developments
9.5. Company Profiles
9.5.1. FLSmidth
9.5.2. Metso
9.5.3. TAKRAF Group
9.5.4. Beumer Group
9.5.5. Daifuku Co., Ltd.
9.5.6. Dematic
9.5.7. Vanderlande Industries
9.5.8. Interroll Holding AG
9.5.9. Continental AG
9.5.10. Bridgestone Corporation
9.5.11. Fenner Dunlop
9.5.12. Hytrol Conveyor Company
9.5.13. Sandvik AB
9.5.14. Schenck Process Group
10. Appendix
10.1. Research Methodology
10.2. Report Assumptions
10.3. Acronyms and Abbreviations
| Equipment Type | Belt conveyors (troughed, flat and pipe), Roller and gravity conveyors, Chain conveyors, Screw conveyors and feeders, Bucket elevators, Pneumatic conveying systems (dilute and dense phase), Vibratory and oscillating conveyors, Overhead and monorail conveyors, Automated sortation and accumulation systems |
| Offering | Equipment, Installation and integration services, Aftermarket parts and services |
| Load Type | Bulk material handling, Unit load handling |
| End-use Industry | Mining and aggregates, Bulk terminals and ports, Cement and power, Food and beverage, Agriculture and grain, Chemicals, Warehousing and parcel logistics, General manufacturing |
| Regions | North America, Europe, Asia Pacific, Latin America, Middle East & Africa |
Our Research Methodology
Considering the volatility of business today, traditional approaches to strategizing a game plan can be unfruitful if not detrimental. True ambiguity is no way to determine a forecast. A myriad of predetermined factors must be accounted for such as the degree of risk involved, the magnitude of circumstances, as well as conditions or consequences that are not known or unpredictable. To circumvent binary views that cast uncertainty, the application of market research intelligence to strategically posture, move, and enable actionable outcomes is necessary.
View Methodology
Quality Assured
Rigorous Validation Process

Confidentiality Assured
End-to-end Data Security

Custom Research Services
Tailored To Your Objectives
FAQs
The global conveying equipment market is estimated at US$ 41.8 billion in 2026, covering bulk handling and unit handling equipment, installation and aftermarket services worldwide.
The market is projected to reach US$ 56.9 billion by 2033, expanding at a 4.5% CAGR and adding US$ 15.1 billion of absolute revenue opportunity.
Belt conveyors lead with a 31.5% share in 2026, because they move the largest tonnages at the lowest cost per tonne handled.
Latin America is growing fastest at a 6.0% CAGR through 2033, driven by copper, iron ore, grain and fertiliser terminal conveying investment.
Concentration is low. No supplier holds a double-digit global share, because engineered bulk systems, commodity conveyors, belting and sortation have different buyers.
Related Reports
Bakery Packaging Machine Market Size, Share, Insights, Competitive Landscape, and Forecast 2026 to 2033
Explore the bakery packaging machine market, projected to reach US$ 4.44 billion by 2033 at a 4.6% CAGR, with automation, machine and regional insights.
EPC Construction Market Size, Share, Insights, Competitive Landscape, and Forecast 2026 to 2033
EPC construction market to grow from US$ 331.5 billion in 2026 to US$ 424.6 billion by 2033 at a 3.6% CAGR. Explore services, contracts and regional trends.
Hydraulic Manifold Market Size, Share, Insights, Competitive Landscape, and Forecast 2026 to 2033
Hydraulic manifold market to grow from US$ 750.0 million in 2026 to US$ 947.8 million by 2033 at a 3.4% CAGR. Explore types, applications and regional trends.
Hydrogen Compressor Market Size, Share, Insights, Competitive Landscape, and Forecast 2026 to 2033
Hydrogen compressor market to grow from US$ 3.3 billion in 2026 to US$ 4.7 billion by 2033 at a 5.2% CAGR. Explore types, end users and regional insights.
Non-Residential Building Market Size, Share, Insights, Competitive Landscape, and Forecast 2026 to 2033
The global non-residential building market is valued at US$8.30 trillion in 2026, reaching US$14.90 trillion by 2033, growing at an 8.7% CAGR
Pet Food Extrusion Market Size, Share, Insights, Competitive Landscape, and Forecast 2026 to 2033
The global pet food extrusion market is valued at US$2.29 billion in 2026, reaching US$3.68 billion by 2033, growing at a 7.0% CAGR