



EPC Construction Market
EPC Construction Market Size, Share, Insights, Competitive Landscape, and Forecast 2026 to 2033
EPC Construction Market Size and Trend Analysis
How Fast Is the EPC Construction Market Growing?
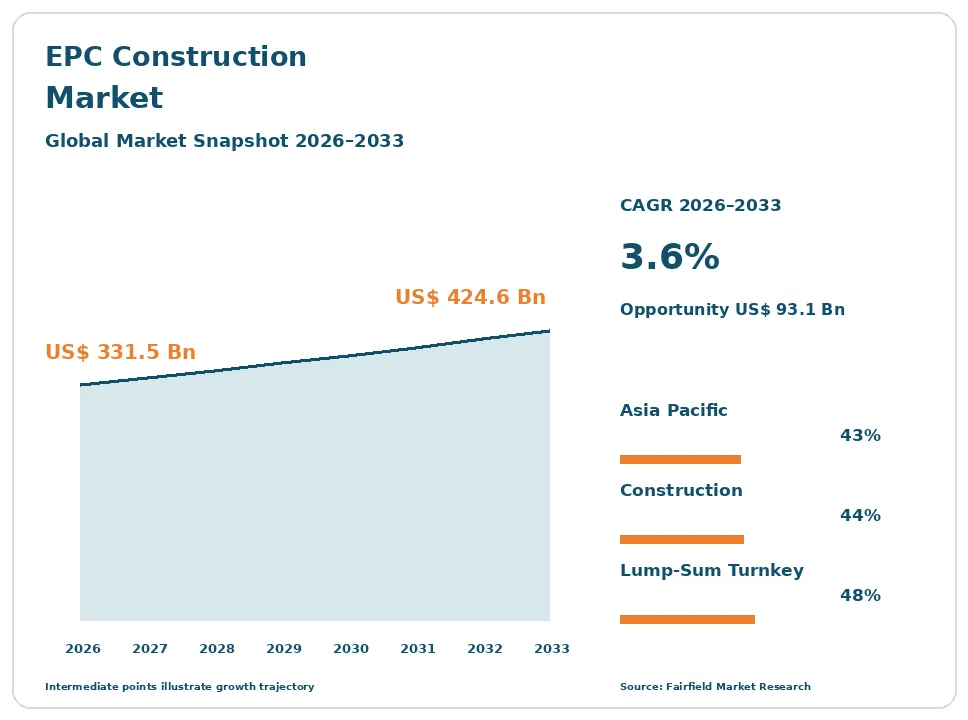
The global EPC construction market size is expected to be valued at US$ 331.5 billion in 2026 and projected to reach US$ 424.6 billion by 2033, growing at a CAGR of 3.6% between 2026 and 2033.
Between 2020 and 2025, the market grew at a CAGR of about 3.1%, as awards slowed during the pandemic, then recovered with new spending on liquefied natural gas, power, refining, and infrastructure. Engineering procurement and construction is a contracting model in which one company, or a consortium, designs a project, buys equipment and materials, and builds it, usually delivering a complete facility to the owner. These turnkey projects cover power plants, oil and gas facilities, chemical plants, mines, transport infrastructure, and industrial sites. Three factors now drive growth: the energy transition, which requires new power grids, renewables, hydrogen, and nuclear plants, continued investment in oil, gas, and petrochemicals in Middle East & Africa and Asia Pacific, and public infrastructure programs. The market is shifting toward digital project execution, modular construction, and shared-risk contracts. In March 2026, Tecnimont, part of MAIRE, won a US$ 1.3 billion EPC contract for a petrochemical plant, showing continued demand for large process projects.
Key Report Takeaways
- By Service Type: Construction held 44.0% share in 2026, while Engineering is projected to expand at a 4.6% CAGR through 2033, driven by complex energy transition projects and digital design tools that raise engineering content.
- By Industry: Power & Energy held 36.0% share in 2026, while Infrastructure is projected to expand at a 4.4% CAGR through 2033, driven by transport, water, and urban projects funded by governments and development banks.
- By Contract Type: Lump-Sum Turnkey held 48.0% share in 2026, while EPCM is projected to expand at a 4.5% CAGR through 2033, driven by owners seeking shared risk on large, complex turnkey projects.
- By Region: Asia Pacific held 43.0% share in 2026, while Middle East & Africa is projected to expand at a 5.0% CAGR through 2033, driven by energy, petrochemical, and giga-projects in Saudi Arabia, Qatar, and the United Arab Emirates.
Global EPC Construction Market Trends and Insights
Drivers Impact Analysis
| Driver | Impact on CAGR Forecast | Geographic Relevance | Impact Timeline |
| Energy transition and power sector investment | High | Global | Long term (≥4 years) |
| Oil, gas, petrochemical, and infrastructure spending | High | Middle East & Africa, Asia Pacific | Medium term (2-4 years) |
Two drivers carry the strongest influence on EPC construction demand during the forecast period.
Energy Transition Is Driving the EPC Construction Market
The energy transition and power sector investment are the strongest driver of the EPC construction market. The world needs new clean energy infrastructure.
The mechanism is large capital spending on power and low-carbon fuels. Utilities and developers are building solar and wind farms, battery storage, transmission lines, and substations to meet rising electricity demand from data centers, electric vehicles, and industry. Nuclear power is returning, with new reactors and fuel facilities planned in the United States, Europe, and Asia Pacific; Fluor is the EPC contractor on a uranium enrichment expansion in Ohio. Green hydrogen, ammonia, and carbon capture projects need complex process engineering. Coal and gas plants are still being built in India and parts of Asia Pacific. EPC contractors with power expertise, such as Bechtel, Larsen & Toubro, and BHEL, are winning large orders. These trends create a pipeline.
Oil, Gas, and Infrastructure Spending Is Expanding the EPC Construction Market
Oil, gas, petrochemical, and infrastructure spending is expanding the EPC construction market. National energy companies continue to invest.
The cause is long-term energy demand and economic diversification. National oil companies in Saudi Arabia, Qatar, the United Arab Emirates, and Kuwait are expanding gas processing, liquefied natural gas, refining, and petrochemical capacity. LNG export projects in the United States, Qatar, Mozambique, and Nigeria need large EPC packages covering liquefaction trains, storage tanks, and marine terminals. Governments in India, Indonesia, and Brazil fund roads, railways, ports, and water projects through national budgets and development bank loans. Saipem, Technip Energies, Samsung E&C, and JGC compete for these contracts, often in consortia that spread risk across partners. Tecnimont won a US$ 1.3 billion petrochemical contract in March 2026. These investments support steady project awards and fill contractor backlogs for several years.
Restraints Impact Analysis
| Restraint | Impact on CAGR Forecast | Geographic Relevance | Impact Timeline |
| Fixed-price risk, cost overruns, and thin margins | High | Global | Long term (≥4 years) |
| Supply chain constraints and skilled labor shortages | Medium | Global | Medium term (2-4 years) |
Two restraints limit how quickly the EPC construction market grows.
Fixed-Price Risk Slows the EPC Construction Market
Fixed-price risk, cost overruns, and thin margins slow the EPC construction market. Contractors carry heavy risks on large projects.
The specific causes are contract structure and project complexity. Under lump-sum turnkey contracts, EPC contractors agree to a fixed price and schedule but must absorb cost increases from inflation, design changes, or delays. Several large contractors, including Fluor and McDermott, have suffered major losses from fixed-price projects. Margins in EPC are often low, leaving little buffer for problems. Disputes over changes and delays can take years to resolve. These risks make contractors more selective about which projects they bid on, and some have shifted to lower-risk contract models. This caution slows growth in some segments, and owners sometimes struggle to attract bids for high-risk projects in remote locations.
Supply Chain Constraints Restrict the EPC Construction Market
Supply chain constraints and skilled labor shortages restrict the EPC construction market. Projects depend on equipment and workers.
The underlying causes are tight markets for key items and people. Lead times for large transformers, turbines, compressors, and heavy forgings have lengthened. Steel and cable prices remain volatile. Engineers, project managers, welders, and electricians are in short supply in North America, Europe, and Middle East & Africa. Large projects compete for the same workers and suppliers. Geopolitical tensions, tariffs, and sanctions affect equipment sourcing and force contractors to qualify new vendors. Shipping disruptions add further delays for heavy cargo. Contractors respond by ordering long-lead items early and training local workforces, but these steps add upfront cost. Together, these factors delay schedules, raise costs, and reduce the number of projects contractors can execute at once.
Market Opportunities
Low-Carbon and Nuclear Projects Open a Fast-Growth Revenue Pool
Low-carbon and nuclear projects open a fast-growth revenue pool in the EPC construction market. Decarbonization requires new kinds of plants.
EPC contractors with engineering depth can capture this opportunity. Green hydrogen and ammonia plants, carbon capture facilities, sustainable aviation fuel refineries, and battery factories need specialized design and construction. Nuclear reactors, including small modular reactors, and fuel facilities are being planned in many countries. Fluor and Centrus Energy advanced a multi-billion-dollar uranium enrichment expansion in Ohio in April 2026. Grid upgrades and offshore wind connections add work. Governments support these projects with tax credits, grants, and low-cost loans. Contractors that combine technical expertise, licensed technologies, and strong safety records can win long-term programs and move into higher-margin front-end engineering and consulting work.
Digital and Modular Delivery Create an Efficiency Revenue Pool
Digital and modular delivery create an efficiency revenue pool in the EPC construction market. Better methods reduce risk and cost.
Contractors and technology firms can capture this opportunity. Digital twins, building information modeling, and AI-based scheduling improve project execution and help spot problems early. Modular construction, where large sections are built in yards and shipped to site, reduces field labor and weather delays, and it is widely used in LNG and petrochemical projects. Drones and sensors track progress. Collaborative contracts, such as alliances and progressive design-build, share risk fairly between owners and contractors. Standardized plant designs can be reused across several projects, cutting engineering hours. Companies that master digital delivery and modular methods can win more profitable work, improve schedule certainty, and build stronger relationships with repeat clients.
Segment Analysis
By Service Type: Construction Leads While Engineering Grows Fastest
Construction held 44.0% share in 2026. Site construction, installation, and commissioning make up the largest share of EPC value because they involve large workforces, heavy equipment, and materials. Larsen & Toubro, Bechtel, and Kiewit have strong construction capabilities, with large direct-hire workforces and equipment fleets. Construction is also where most cost overruns occur, so contractors invest heavily in planning, safety, and site supervision.
Engineering is the fastest-growing service type, expanding at a 4.6% CAGR through 2033. Complex energy transition projects need more design, studies, and digital engineering. Front-end engineering design studies often decide which contractor wins the later EPC award. Procurement covers buying equipment and materials, and supply chain strength has become a competitive advantage. For the market, engineering growth raises margins and gives contractors earlier influence over project scope.
By Industry: Power & Energy Leads While Infrastructure Grows Fastest
Power & Energy held 36.0% share in 2026. Power plants, renewables, grids, and energy facilities are the largest source of EPC work, supported by rising electricity demand from data centers, industry, and electric vehicles. BHEL, Larsen & Toubro, and Bechtel hold large power backlogs.
Infrastructure is the fastest-growing industry, expanding at a 4.4% CAGR through 2033. Railways, metro systems, airports, water treatment, and ports are expanding. Governments in India, Saudi Arabia, and the United States have committed large budgets to transport and water networks. Oil and gas, chemicals, mining, and manufacturing are other industries, with semiconductor and battery plants adding new manufacturing work. For the market, infrastructure growth adds stable public demand that balances cyclical energy spending.
By Contract Type: Lump-Sum Turnkey Leads While EPCM Grows Fastest
Lump-Sum Turnkey held 48.0% share in 2026. Owners and lenders prefer fixed-price contracts that transfer cost and schedule risk to contractors, which makes financing large projects easier. National oil companies in Middle East & Africa and power utilities in Asia Pacific commonly use this model.
EPCM is the fastest-growing contract type, expanding at a 4.5% CAGR through 2033. Under EPCM, contractors manage design and construction for a fee while owners hold more risk. Mining companies and North American owners use EPCM widely for large, uncertain projects. Cost-plus and reimbursable contracts are also gaining ground after several contractors suffered losses on fixed-price work. For the market, EPCM growth reflects a shift toward risk sharing and more stable contractor margins.
Geography Analysis
North America Builds the EPC Construction Market Through LNG, Nuclear, and Industrial Projects
North America is a major EPC construction market. The United States is building LNG export terminals, semiconductor and battery plants, data centers, and nuclear fuel facilities. Bechtel, Fluor, Kiewit, and Jacobs are key players. Federal incentives for clean energy and domestic manufacturing have created a large project pipeline. Fluor is the EPC contractor for a uranium enrichment expansion in Ohio. Canada adds LNG export, oil sands, and mining projects, and Mexico is often analyzed with Latin America. Key barriers include craft labor shortages and high wages. One change shaping the region is nuclear revival, with new reactors and fuel facilities planned.
Europe Builds the EPC Construction Market Through Energy Transition
Europe is a significant EPC construction market. Italy, France, Germany, the Netherlands, and the United Kingdom host major contractors such as Saipem, MAIRE, and Technip Energies. These companies earn much of their revenue from projects in Middle East & Africa and Asia Pacific. At home, offshore wind, hydrogen, carbon capture, and interconnector projects add work, supported by European Union climate targets. Energy security concerns have also driven new LNG import terminals. Key barriers include slow permitting and high energy costs. One opportunity is grid expansion, as utilities upgrade transmission networks to connect renewables.
Which Region Is Leading the EPC Construction Market?
Asia Pacific is leading the EPC construction market with a 43.0% share in 2026. China and India are the largest contributors, with large power, refining, metro rail, highway, and industrial programs funded by central and state governments. BHEL won a 1,320 MW thermal power EPC contract in India in December 2025. Japan and South Korea host JGC and Samsung E&C, which win projects across the world. Indonesia, Vietnam, and Australia add energy, mining, and transport work. Key barriers include intense price competition from Chinese state contractors. One change shaping the region is renewables, with large solar, wind, and pumped hydro projects.
Latin America Grows the EPC Construction Market Through Energy and Mining
Latin America is a growing EPC construction market. Brazil invests in offshore oil platforms, refining, and transport infrastructure, while Mexico spends on energy and rail projects. Chile and Peru invest in copper and lithium mining, which often uses EPCM contracts. Argentina is developing Vaca Muerta gas, pipelines, and LNG export capacity, while Colombia invests in roads and energy. Guyana adds offshore oil work. Key barriers include political risk, currency swings, and financing limits. Infrastructure concessions and public-private partnerships are expanding in Brazil and Colombia. One opportunity is mining, as demand for copper and lithium rises with electrification and battery production.
Which Region Is Growing Fastest in the EPC Construction Market?
Middle East & Africa is growing fastest in the EPC construction market at a 5.0% CAGR through 2033. Saudi Arabia leads with energy, petrochemical, and giga-projects, and Qatar is expanding LNG capacity sharply. The United Arab Emirates and Kuwait invest in gas processing and refining, while Egypt, Nigeria, and Mozambique add energy and infrastructure work. Saipem, Samsung E&C, and Larsen & Toubro win large orders here. National content rules require contractors to hire local workers and use local suppliers. Key barriers include project delays, payment terms, and budget changes linked to oil prices. One change shaping the region is gas expansion.
Competitive Landscape
The EPC construction market is fragmented. Bechtel, Fluor, Larsen & Toubro, Saipem, and Technip Energies are leading global contractors, while MAIRE, Samsung E&C, JGC, Kiewit, Jacobs, Tata Projects, and Chinese state contractors compete strongly. Many regional firms serve local markets, especially in construction-heavy infrastructure work. Chinese contractors are strong in Asia Pacific, Middle East & Africa, and Latin America, often supported by state financing.
Companies compete on technical expertise, track record, price, financing support, safety, and local presence. Licensed process technologies help Technip Energies and MAIRE win chemical and fertilizer work. Large balance sheets let Bechtel and Larsen & Toubro take on mega-projects. Risk management is critical, because one troubled fixed-price project can erase years of profit. Many contractors now screen bids more strictly, form joint ventures, and use digital tools to control cost and schedule.
Strategic moves show how competition is changing. In December 2025, BHEL won a large thermal power EPC contract in India. In March 2026, Tecnimont won a US$ 1.3 billion petrochemical contract. In April 2026, Fluor advanced a nuclear fuel project in Ohio. These moves show competition shifting toward power, nuclear, and process projects.
Three themes shape vendor strategy. First, companies are reducing fixed-price risk by favoring reimbursable and EPCM contracts. Second, they are targeting low-carbon projects such as hydrogen, carbon capture, and nuclear. Third, they are digitalizing delivery with digital twins and modular methods to protect margins.
EPC Construction Market Industry Leaders
- Bechtel
- Fluor
- Larsen & Toubro
- Saipem
- Technip Energies
Recent Industry Developments
- April 2026: Centrus Energy and Fluor advanced a multi-billion-dollar uranium enrichment plant expansion in Ohio, with Fluor as EPC contractor - expands nuclear engineering procurement and construction work.
- March 2026: Tecnimont, part of MAIRE, won a US$ 1.3 billion EPC contract for a hydrocarbon petrochemical plant - shows demand for large process turnkey projects.
- December 2025: BHEL received an INR 7,300 crore EPC contract from Tamil Nadu’s power utility for a 1,320 MW thermal power project at Udangudi - adds power sector work in India.
Companies Covered in the Report
- Bechtel
- Fluor
- Larsen & Toubro
- Saipem
- Technip Energies
- MAIRE
- Samsung E&C
- JGC
- Kiewit
- Jacobs
- Tata Projects
- BHEL
EPC Construction Market Report Scope
This report covers engineering, procurement, and construction services, delivered through lump-sum turnkey, EPCM, cost-plus, and other contracts, for power and energy, oil and gas, chemicals, infrastructure, mining, manufacturing, and other industries. The base year is 2025, and the forecast period runs from 2026 to 2033. All values are expressed in US$ Billion.
Service Type
- Engineering
- Procurement
- Construction
Industry
- Power & Energy
- Oil & Gas
- Chemicals
- Infrastructure
- Mining
- Manufacturing
- Others
Contract Type
- Lump-Sum Turnkey
- EPCM
- Cost-Plus
- Others
Regions
- North America
- Europe
- Asia Pacific
- Latin America
- Middle East & Africa
Key Questions Answered in the Report
How big is the EPC construction market in 2026?
The EPC construction market is valued at US$ 331.5 billion in 2026, led by construction services and Asia Pacific.
What is the EPC construction market forecast to 2033?
The market is projected to reach US$ 424.6 billion by 2033, growing at a 3.6% CAGR and adding US$ 93.1 billion.
Which service type is growing fastest in the EPC construction market?
Engineering is growing fastest at a 4.6% CAGR through 2033, driven by complex energy transition projects and digital design.
Which region is growing fastest in the EPC construction market?
Middle East & Africa is growing fastest at a 5.0% CAGR through 2033, driven by energy and giga-projects in Saudi Arabia and Qatar.
Which region holds the largest EPC construction market share?
Asia Pacific holds the largest share at 43.0% in 2026, supported by large power and infrastructure programs in China and India.
1. Executive Summary
1.1. Global EPC Construction Market Snapshot
1.2. Future Projections
1.3. Key Report Takeaways
1.4. Regional Snapshot
2. Market Overview
2.1. Market Definition and Report Scope
2.2. Historical Trends 2020–2025
2.3. Market Dynamics
2.3.1. Drivers
2.3.1.1. Energy Transition Is Driving the EPC Construction Market
2.3.1.2. Oil, Gas, and Infrastructure Spending Is Expanding the EPC Construction Market
2.3.2. Restraints
2.3.2.1. Fixed-Price Risk Slows the EPC Construction Market
2.3.2.2. Supply Chain Constraints Restrict the EPC Construction Market
2.3.3. Market Opportunities
2.3.3.1. Low-Carbon and Nuclear Projects Open a Fast-Growth Revenue Pool
2.3.3.2. Digital and Modular Delivery Create an Efficiency Revenue Pool
3. Global EPC Construction Market Outlook, 2020-2033
3.1. Global EPC Construction Market Outlook, by Service Type, Value (US$ Billion), 2020-2033
3.1.1. Engineering
3.1.2. Procurement
3.1.3. Construction
3.2. Global EPC Construction Market Outlook, by Industry, Value (US$ Billion), 2020-2033
3.2.1. Power & Energy
3.2.2. Oil & Gas
3.2.3. Chemicals
3.2.4. Infrastructure
3.2.5. Mining
3.2.6. Manufacturing
3.2.7. Others
3.3. Global EPC Construction Market Outlook, by Contract Type, Value (US$ Billion), 2020-2033
3.3.1. Lump-Sum Turnkey
3.3.2. EPCM
3.3.3. Cost-Plus
3.3.4. Others
3.4. Global EPC Construction Market Outlook, by Region, Value (US$ Billion), 2020-2033
3.4.1. North America
3.4.2. Europe
3.4.3. Asia Pacific
3.4.4. Latin America
3.4.5. Middle East & Africa
4. North America EPC Construction Market Outlook, 2020-2033
4.1. North America EPC Construction Market Outlook, by Service Type, Value (US$ Billion), 2020-2033
4.1.1. Engineering
4.1.2. Procurement
4.1.3. Construction
4.2. North America EPC Construction Market Outlook, by Industry, Value (US$ Billion), 2020-2033
4.2.1. Power & Energy
4.2.2. Oil & Gas
4.2.3. Chemicals
4.2.4. Infrastructure
4.2.5. Mining
4.2.6. Manufacturing
4.2.7. Others
4.3. North America EPC Construction Market Outlook, by Contract Type, Value (US$ Billion), 2020-2033
4.3.1. Lump-Sum Turnkey
4.3.2. EPCM
4.3.3. Cost-Plus
4.3.4. Others
4.4. North America EPC Construction Market Outlook, by Country, Value (US$ Billion), 2020-2033
4.4.1. United States EPC Construction Market Outlook, by Service Type, 2020-2033
4.4.2. United States EPC Construction Market Outlook, by Industry, 2020-2033
4.4.3. United States EPC Construction Market Outlook, by Contract Type, 2020-2033
4.4.4. Canada EPC Construction Market Outlook, by Service Type, 2020-2033
4.4.5. Canada EPC Construction Market Outlook, by Industry, 2020-2033
4.4.6. Canada EPC Construction Market Outlook, by Contract Type, 2020-2033
4.4.7. Mexico EPC Construction Market Outlook, by Service Type, 2020-2033
4.4.8. Mexico EPC Construction Market Outlook, by Industry, 2020-2033
4.4.9. Mexico EPC Construction Market Outlook, by Contract Type, 2020-2033
5. Europe EPC Construction Market Outlook, 2020-2033
5.1. Europe EPC Construction Market Outlook, by Service Type, Value (US$ Billion), 2020-2033
5.1.1. Engineering
5.1.2. Procurement
5.1.3. Construction
5.2. Europe EPC Construction Market Outlook, by Industry, Value (US$ Billion), 2020-2033
5.2.1. Power & Energy
5.2.2. Oil & Gas
5.2.3. Chemicals
5.2.4. Infrastructure
5.2.5. Mining
5.2.6. Manufacturing
5.2.7. Others
5.3. Europe EPC Construction Market Outlook, by Contract Type, Value (US$ Billion), 2020-2033
5.3.1. Lump-Sum Turnkey
5.3.2. EPCM
5.3.3. Cost-Plus
5.3.4. Others
5.4. Europe EPC Construction Market Outlook, by Country, Value (US$ Billion), 2020-2033
5.4.1. Italy EPC Construction Market Outlook, by Service Type, 2020-2033
5.4.2. Italy EPC Construction Market Outlook, by Industry, 2020-2033
5.4.3. Italy EPC Construction Market Outlook, by Contract Type, 2020-2033
5.4.4. France EPC Construction Market Outlook, by Service Type, 2020-2033
5.4.5. France EPC Construction Market Outlook, by Industry, 2020-2033
5.4.6. France EPC Construction Market Outlook, by Contract Type, 2020-2033
5.4.7. Germany EPC Construction Market Outlook, by Service Type, 2020-2033
5.4.8. Germany EPC Construction Market Outlook, by Industry, 2020-2033
5.4.9. Germany EPC Construction Market Outlook, by Contract Type, 2020-2033
5.4.10. Netherlands EPC Construction Market Outlook, by Service Type, 2020-2033
5.4.11. Netherlands EPC Construction Market Outlook, by Industry, 2020-2033
5.4.12. Netherlands EPC Construction Market Outlook, by Contract Type, 2020-2033
5.4.13. United Kingdom EPC Construction Market Outlook, by Service Type, 2020-2033
5.4.14. United Kingdom EPC Construction Market Outlook, by Industry, 2020-2033
5.4.15. United Kingdom EPC Construction Market Outlook, by Contract Type, 2020-2033
6. Asia Pacific EPC Construction Market Outlook, 2020-2033
6.1. Asia Pacific EPC Construction Market Outlook, by Service Type, Value (US$ Billion), 2020-2033
6.1.1. Engineering
6.1.2. Procurement
6.1.3. Construction
6.2. Asia Pacific EPC Construction Market Outlook, by Industry, Value (US$ Billion), 2020-2033
6.2.1. Power & Energy
6.2.2. Oil & Gas
6.2.3. Chemicals
6.2.4. Infrastructure
6.2.5. Mining
6.2.6. Manufacturing
6.2.7. Others
6.3. Asia Pacific EPC Construction Market Outlook, by Contract Type, Value (US$ Billion), 2020-2033
6.3.1. Lump-Sum Turnkey
6.3.2. EPCM
6.3.3. Cost-Plus
6.3.4. Others
6.4. Asia Pacific EPC Construction Market Outlook, by Country, Value (US$ Billion), 2020-2033
6.4.1. China EPC Construction Market Outlook, by Service Type, 2020-2033
6.4.2. China EPC Construction Market Outlook, by Industry, 2020-2033
6.4.3. China EPC Construction Market Outlook, by Contract Type, 2020-2033
6.4.4. India EPC Construction Market Outlook, by Service Type, 2020-2033
6.4.5. India EPC Construction Market Outlook, by Industry, 2020-2033
6.4.6. India EPC Construction Market Outlook, by Contract Type, 2020-2033
6.4.7. Japan EPC Construction Market Outlook, by Service Type, 2020-2033
6.4.8. Japan EPC Construction Market Outlook, by Industry, 2020-2033
6.4.9. Japan EPC Construction Market Outlook, by Contract Type, 2020-2033
6.4.10. South Korea EPC Construction Market Outlook, by Service Type, 2020-2033
6.4.11. South Korea EPC Construction Market Outlook, by Industry, 2020-2033
6.4.12. South Korea EPC Construction Market Outlook, by Contract Type, 2020-2033
6.4.13. Indonesia EPC Construction Market Outlook, by Service Type, 2020-2033
6.4.14. Indonesia EPC Construction Market Outlook, by Industry, 2020-2033
6.4.15. Indonesia EPC Construction Market Outlook, by Contract Type, 2020-2033
6.4.16. Vietnam EPC Construction Market Outlook, by Service Type, 2020-2033
6.4.17. Vietnam EPC Construction Market Outlook, by Industry, 2020-2033
6.4.18. Vietnam EPC Construction Market Outlook, by Contract Type, 2020-2033
6.4.19. Australia EPC Construction Market Outlook, by Service Type, 2020-2033
6.4.20. Australia EPC Construction Market Outlook, by Industry, 2020-2033
6.4.21. Australia EPC Construction Market Outlook, by Contract Type, 2020-2033
7. Latin America EPC Construction Market Outlook, 2020-2033
7.1. Latin America EPC Construction Market Outlook, by Service Type, Value (US$ Billion), 2020-2033
7.1.1. Engineering
7.1.2. Procurement
7.1.3. Construction
7.2. Latin America EPC Construction Market Outlook, by Industry, Value (US$ Billion), 2020-2033
7.2.1. Power & Energy
7.2.2. Oil & Gas
7.2.3. Chemicals
7.2.4. Infrastructure
7.2.5. Mining
7.2.6. Manufacturing
7.2.7. Others
7.3. Latin America EPC Construction Market Outlook, by Contract Type, Value (US$ Billion), 2020-2033
7.3.1. Lump-Sum Turnkey
7.3.2. EPCM
7.3.3. Cost-Plus
7.3.4. Others
7.4. Latin America EPC Construction Market Outlook, by Country, Value (US$ Billion), 2020-2033
7.4.1. Brazil EPC Construction Market Outlook, by Service Type, 2020-2033
7.4.2. Brazil EPC Construction Market Outlook, by Industry, 2020-2033
7.4.3. Brazil EPC Construction Market Outlook, by Contract Type, 2020-2033
7.4.4. Mexico EPC Construction Market Outlook, by Service Type, 2020-2033
7.4.5. Mexico EPC Construction Market Outlook, by Industry, 2020-2033
7.4.6. Mexico EPC Construction Market Outlook, by Contract Type, 2020-2033
7.4.7. Chile EPC Construction Market Outlook, by Service Type, 2020-2033
7.4.8. Chile EPC Construction Market Outlook, by Industry, 2020-2033
7.4.9. Chile EPC Construction Market Outlook, by Contract Type, 2020-2033
7.4.10. Peru EPC Construction Market Outlook, by Service Type, 2020-2033
7.4.11. Peru EPC Construction Market Outlook, by Industry, 2020-2033
7.4.12. Peru EPC Construction Market Outlook, by Contract Type, 2020-2033
7.4.13. Argentina EPC Construction Market Outlook, by Service Type, 2020-2033
7.4.14. Argentina EPC Construction Market Outlook, by Industry, 2020-2033
7.4.15. Argentina EPC Construction Market Outlook, by Contract Type, 2020-2033
7.4.16. Colombia EPC Construction Market Outlook, by Service Type, 2020-2033
7.4.17. Colombia EPC Construction Market Outlook, by Industry, 2020-2033
7.4.18. Colombia EPC Construction Market Outlook, by Contract Type, 2020-2033
7.4.19. Guyana EPC Construction Market Outlook, by Service Type, 2020-2033
7.4.20. Guyana EPC Construction Market Outlook, by Industry, 2020-2033
7.4.21. Guyana EPC Construction Market Outlook, by Contract Type, 2020-2033
8. Middle East & Africa EPC Construction Market Outlook, 2020-2033
8.1. Middle East & Africa EPC Construction Market Outlook, by Service Type, Value (US$ Billion), 2020-2033
8.1.1. Engineering
8.1.2. Procurement
8.1.3. Construction
8.2. Middle East & Africa EPC Construction Market Outlook, by Industry, Value (US$ Billion), 2020-2033
8.2.1. Power & Energy
8.2.2. Oil & Gas
8.2.3. Chemicals
8.2.4. Infrastructure
8.2.5. Mining
8.2.6. Manufacturing
8.2.7. Others
8.3. Middle East & Africa EPC Construction Market Outlook, by Contract Type, Value (US$ Billion), 2020-2033
8.3.1. Lump-Sum Turnkey
8.3.2. EPCM
8.3.3. Cost-Plus
8.3.4. Others
8.4. Middle East & Africa EPC Construction Market Outlook, by Country, Value (US$ Billion), 2020-2033
8.4.1. Saudi Arabia EPC Construction Market Outlook, by Service Type, 2020-2033
8.4.2. Saudi Arabia EPC Construction Market Outlook, by Industry, 2020-2033
8.4.3. Saudi Arabia EPC Construction Market Outlook, by Contract Type, 2020-2033
8.4.4. Qatar EPC Construction Market Outlook, by Service Type, 2020-2033
8.4.5. Qatar EPC Construction Market Outlook, by Industry, 2020-2033
8.4.6. Qatar EPC Construction Market Outlook, by Contract Type, 2020-2033
8.4.7. United Arab Emirates EPC Construction Market Outlook, by Service Type, 2020-2033
8.4.8. United Arab Emirates EPC Construction Market Outlook, by Industry, 2020-2033
8.4.9. United Arab Emirates EPC Construction Market Outlook, by Contract Type, 2020-2033
8.4.10. Kuwait EPC Construction Market Outlook, by Service Type, 2020-2033
8.4.11. Kuwait EPC Construction Market Outlook, by Industry, 2020-2033
8.4.12. Kuwait EPC Construction Market Outlook, by Contract Type, 2020-2033
8.4.13. Egypt EPC Construction Market Outlook, by Service Type, 2020-2033
8.4.14. Egypt EPC Construction Market Outlook, by Industry, 2020-2033
8.4.15. Egypt EPC Construction Market Outlook, by Contract Type, 2020-2033
8.4.16. Nigeria EPC Construction Market Outlook, by Service Type, 2020-2033
8.4.17. Nigeria EPC Construction Market Outlook, by Industry, 2020-2033
8.4.18. Nigeria EPC Construction Market Outlook, by Contract Type, 2020-2033
8.4.19. Mozambique EPC Construction Market Outlook, by Service Type, 2020-2033
8.4.20. Mozambique EPC Construction Market Outlook, by Industry, 2020-2033
8.4.21. Mozambique EPC Construction Market Outlook, by Contract Type, 2020-2033
9. Competitive Landscape
9.1. Market Concentration and Industry Leaders
9.2. Competitive Differentiation
9.3. Strategic Moves and Market Direction
9.4. Recent Industry Developments
9.5. Company Profiles
9.5.1. Bechtel
9.5.2. Fluor
9.5.3. Larsen & Toubro
9.5.4. Saipem
9.5.5. Technip Energies
9.5.6. MAIRE
9.5.7. Samsung E&C
9.5.8. JGC
9.5.9. Kiewit
9.5.10. Jacobs
9.5.11. Tata Projects
9.5.12. BHEL
10. Appendix
10.1. Research Methodology
10.2. Report Assumptions
10.3. Acronyms and Abbreviations
| Service Type | Engineering, Procurement, Construction |
| Industry | Power & Energy, Oil & Gas, Chemicals, Infrastructure, Mining, Manufacturing, Others |
| Contract Type | Lump-Sum Turnkey, EPCM, Cost-Plus, Others |
| Regions | North America, Europe, Asia Pacific, Latin America, Middle East & Africa |
Our Research Methodology
Considering the volatility of business today, traditional approaches to strategizing a game plan can be unfruitful if not detrimental. True ambiguity is no way to determine a forecast. A myriad of predetermined factors must be accounted for such as the degree of risk involved, the magnitude of circumstances, as well as conditions or consequences that are not known or unpredictable. To circumvent binary views that cast uncertainty, the application of market research intelligence to strategically posture, move, and enable actionable outcomes is necessary.
View Methodology
Quality Assured
Rigorous Validation Process

Confidentiality Assured
End-to-end Data Security

Custom Research Services
Tailored To Your Objectives
FAQs
The EPC construction market is valued at US$ 331.5 billion in 2026, led by construction services and Asia Pacific.
The market is projected to reach US$ 424.6 billion by 2033, growing at a 3.6% CAGR and adding US$ 93.1 billion.
Engineering is growing fastest at a 4.6% CAGR through 2033, driven by complex energy transition projects and digital design.
Middle East & Africa is growing fastest at a 5.0% CAGR through 2033, driven by energy and giga-projects in Saudi Arabia and Qatar.
Asia Pacific holds the largest share at 43.0% in 2026, supported by large power and infrastructure programs in China and India.
Related Reports
Conveying Equipment Market Size, Share, Insights, Competitive Landscape, and Forecast 2026 to 2033
Explore the conveying equipment market, projected to reach US$ 56.9 billion by 2033 at a 4.5% CAGR, with equipment, services and regional insights.
Bakery Packaging Machine Market Size, Share, Insights, Competitive Landscape, and Forecast 2026 to 2033
Explore the bakery packaging machine market, projected to reach US$ 4.44 billion by 2033 at a 4.6% CAGR, with automation, machine and regional insights.
Hydraulic Manifold Market Size, Share, Insights, Competitive Landscape, and Forecast 2026 to 2033
Hydraulic manifold market to grow from US$ 750.0 million in 2026 to US$ 947.8 million by 2033 at a 3.4% CAGR. Explore types, applications and regional trends.
Hydrogen Compressor Market Size, Share, Insights, Competitive Landscape, and Forecast 2026 to 2033
Hydrogen compressor market to grow from US$ 3.3 billion in 2026 to US$ 4.7 billion by 2033 at a 5.2% CAGR. Explore types, end users and regional insights.
Non-Residential Building Market Size, Share, Insights, Competitive Landscape, and Forecast 2026 to 2033
The global non-residential building market is valued at US$8.30 trillion in 2026, reaching US$14.90 trillion by 2033, growing at an 8.7% CAGR
Pet Food Extrusion Market Size, Share, Insights, Competitive Landscape, and Forecast 2026 to 2033
The global pet food extrusion market is valued at US$2.29 billion in 2026, reaching US$3.68 billion by 2033, growing at a 7.0% CAGR