



Ethylene Dichloride Market
Ethylene Dichloride Market Size, Share, Insights, Competitive Landscape, and Forecast 2026 to 2033
Ethylene Dichloride Market Size and Trend Analysis
What Is the Ethylene Dichloride Market Outlook to 2033?
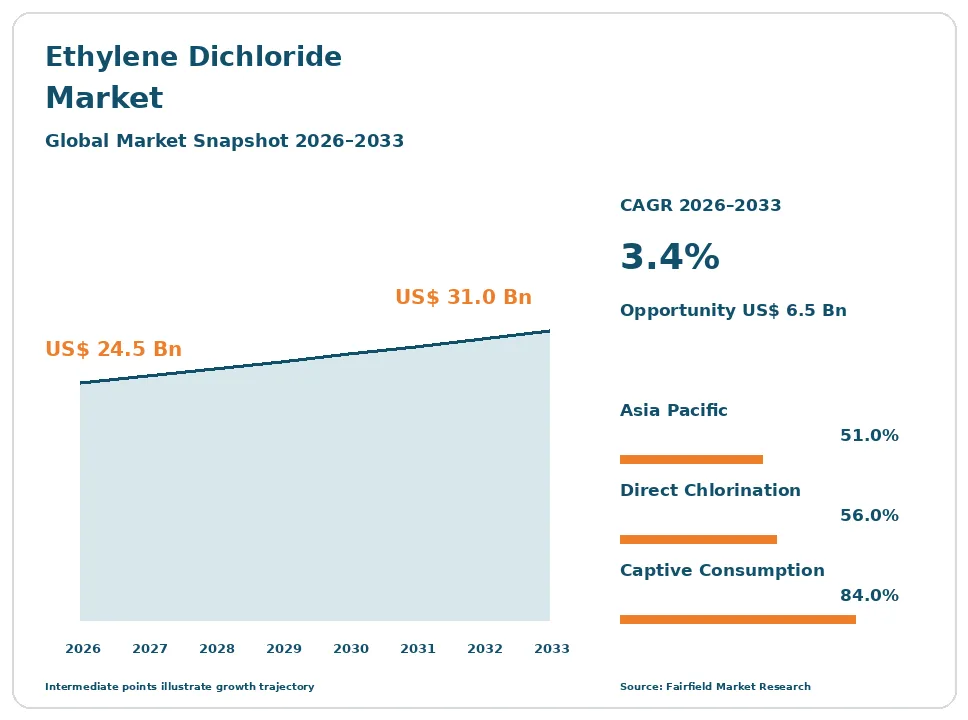
The global Ethylene Dichloride market size is expected to be valued at US$ 24.5 billion in 2026 and projected to reach US$ 31.0 billion by 2033, growing at a CAGR of 3.4% between 2026 and 2033.
The market expanded at a 2.6% CAGR between 2020 and 2025 to reach US$ 23.7 billion, driven by polyvinyl chloride demand and feedstock prices rather than by new uses. Three factors shape the trajectory. Construction in developing economies keeps adding pipe, profile, cable and sheet volume, which is the only real growth engine this chain has. Energy cost divergence has redrawn competitiveness, because chlor-alkali electrolysis is electricity-intensive while ethylene cost tracks regional feedstock, so advantaged regions export and high-cost regions shut units. Regulatory attention to 1,2-dichloroethane handling, emissions and worker exposure raises the fixed cost of operating and siting plants. The direction is a mature intermediate growing roughly with building activity, where position rests on integration and energy cost.
Key Report Takeaways
- By Production Process: Direct chlorination held 56.0% share in 2026, while oxychlorination is projected to expand at a 3.7% CAGR through 2033, because balanced complexes must consume the hydrogen chloride that vinyl chloride cracking returns.
- By Derivative Application: Vinyl chloride monomer held 93.0% share in 2026, while ethyleneamines are projected to grow at a 4.6% CAGR through 2033, on demand from epoxy curing agents, lubricant additives and gas treating chemicals.
- By End Use Industry: Building and construction held 62.0% share in 2026, while healthcare and medical is projected to grow at a 4.5% CAGR through 2033, led by tubing, blood bags and single-use devices in expanding hospital systems.
- By Sales Channel: Captive consumption held 84.0% share in 2026, while spot and export cargoes are projected to advance at a 4.2% CAGR through 2033, as energy-advantaged producers push surplus tonnage into import-dependent markets.
- By Geography: Asia Pacific held 51.0% share in 2026, while Middle East & Africa is projected to expand at a 4.7% CAGR through 2033, on integrated gas-based complexes and regional construction programmes.
Global Ethylene Dichloride Market Trends and Insights
Drivers Impact Analysis
| Driver | Impact on CAGR Forecast | Geographic Relevance | Impact Timeline |
| Infrastructure and housing demand for polyvinyl chloride pipe, profile and cable | High | Asia Pacific, Middle East & Africa, Latin America | Long term ≥4 years |
| Caustic soda demand pulling electrolysis output that ethylene dichloride absorbs | Medium | Global | Medium term 2–4 years |
Two mechanisms, one downstream and one upstream, explain almost all demand movement for 1,2-dichloroethane.
Water, Sewer and Housing Programmes Keep Pulling Ethylene Dichloride Through the PVC Chain
Infrastructure spending is the clearest demand signal in this market, because roughly nine-tenths of 1,2-dichloroethane becomes vinyl chloride monomer and then polyvinyl chloride. Water supply and sewer networks, irrigation, electrical conduit, window profiles, roofing membrane and wire insulation all consume the resin in bulk. Where governments fund piped water, sanitation, rural electrification and affordable housing, resin offtake rises predictably, and converters order against programme schedules rather than against consumer sentiment.
The mechanism is substitution economics in buried and concealed applications. Polyvinyl chloride pipe is lighter than ductile iron, cheaper than copper, corrosion-resistant in aggressive soils and simple to joint with unskilled labour, so utilities specify it wherever codes allow. Rising replacement of ageing cast iron and asbestos cement mains in older networks adds a second, steadier layer of demand on top of new construction.
Caustic Soda Demand Forces Chlorine Out of Electrolysis and Into Ethylene Dichloride
The upstream driver is the co-product nature of chlor-alkali. Every tonne of chlorine arrives with roughly 1.1 tonnes of caustic soda, and electrolysis is run to meet whichever of the two is pulling harder. When alumina refining, pulp and paper, soaps and water treatment lift caustic demand, cells run harder and the chlorine produced alongside must find an immediate outlet, because it cannot be stored economically in volume.
That outlet is overwhelmingly 1,2-dichloroethane, which absorbs the largest single share of global chlorine. Producers therefore push ethylene dichloride and vinyl chloride output to balance the cell room rather than purely to chase downstream margin. The result is a market where upstream caustic economics can set regional supply, and where the ethylene–chlorine spread, rather than resin pricing alone, decides which units keep running through a weak quarter.
Restraints Impact Analysis
| Restraint | Impact on CAGR Forecast | Geographic Relevance | Impact Timeline |
| Demand entirely derivative of polyvinyl chloride and therefore of construction cycles | High | Global | Long term ≥4 years |
| Carcinogen classification, regulatory review and legacy chlor-alkali conversion costs | Medium | Europe, North America | Medium term 2–4 years |
Two structural constraints cap how fast this intermediate can grow and how freely it can be traded.
Derivative Demand Means Ethylene Dichloride Cannot Outgrow Building Activity
This market has no independent growth story. Because almost every tonne is consumed internally on the route to vinyl chloride and polyvinyl chloride, demand tracks construction starts, utility spending and durable goods output with very little lag and no offsetting end use to cushion a downturn. When housing completions fall in a large economy, converters cut resin orders, resin producers cut monomer, and ethylene dichloride units reduce rates within weeks.
Trade adds a second limit. Moving a hazardous, classified liquid intermediate requires dedicated stainless or lined tankage, nitrogen blanketing, specialised parcel tankers and insurance cover that reflects the cargo, so freight and risk costs are high relative to product value. That cost structure keeps most volume inside integrated complexes and confines merchant trade to a few established deep-water routes between fixed loading and discharge ports.
Carcinogen Classification and Plant Conversion Costs Raise the Price of Operating Safely
Regulatory status is a real cost line rather than a reputational matter. 1,2-dichloroethane carries a harmonised classification as a category 1B carcinogen under the European Union classification, labelling and packaging rules, and the International Agency for Research on Cancer classifies it as possibly carcinogenic to humans. Operators therefore manage closed handling, fugitive emission monitoring, low occupational exposure limits and effluent controls, and permitting a new unit near population is difficult in several jurisdictions.
The cost sources are specific. Vapour recovery, leak detection and repair programmes, double mechanical seals and continuous monitoring all carry capital and labour cost. Older chlor-alkali plants faced a separate bill, because mercury-cell and asbestos-diaphragm technology had to be converted to membrane cells or shut, and conversion requires a full cell room rebuild, an extended outage and site remediation afterwards.
Market Opportunities
Merchant Supply to Non-Integrated Converters Opens the Thin Slice That Actually Trades
The merchant layer is small but it is where commercial opportunity concentrates. Non-integrated vinyl chloride and polyvinyl chloride producers in India, Vietnam, Turkey, Indonesia and parts of Africa operate without a chlor-alkali unit behind them, so they buy ethylene dichloride or vinyl chloride monomer outright. That buying is price-elastic, contract terms reset frequently, and realised margins move far more than captive transfer values ever do.
Producers with surplus tonnage, deep-water jetties and dedicated parcel shipping can capture it, selling into import-dependent converters that lack upstream integration. Growth is supported by continued investment in downstream polyvinyl chloride compounding and pipe extrusion in markets that have chosen not to build chlorine production of their own, because high electricity cost, scarce coastal land or difficult environmental permitting makes building local electrolysis unattractive at any realistic scale.
Energy-Advantaged Gulf and North American Complexes Create an Export Revenue Pool
Low-cost ethane and competitively priced power have created a durable cost gap that translates directly into export revenue. Integrated complexes on the United States Gulf Coast and in Saudi Arabia and Qatar produce chlorine and ethylene more cheaply than naphtha-based, high-power-cost sites, and the differential is wide enough to absorb freight into distant markets. The pool widens each time a high-cost unit in a mature region closes rather than reinvesting in a new cell room.
Producers able to add membrane-cell electrolysis, oxygen-based oxychlorination and heat integration capture the most, because electricity is the dominant variable cost in the cell room. The customer group is import-dependent converters in developing economies, and the supporting development is continued conversion of older electrolysis technology, which both lowers power consumption per tonne and removes legacy environmental liabilities.
Segment Analysis
By Production Process: Direct Chlorination Leads While Oxychlorination Expands Faster
Direct chlorination accounted for 56.0% of ethylene dichloride output in 2026, because reacting ethylene with elemental chlorine is the simplest route and the first call on chlorine leaving the cell room. Oxychlorination is the faster-growing route at a 3.7% CAGR through 2033, since it converts the hydrogen chloride recovered from vinyl chloride cracking back into usable product. Ethane-based and other routes remain marginal. The two processes are not really competitors: a balanced complex runs both so that chlorine input and hydrogen chloride recycle close on themselves, which is why most new investment arrives as a paired unit. The practical implication is that process share follows complex design rather than customer preference, and the real engineering choice is between air-based and oxygen-based oxychlorination, where oxygen systems cut vent gas volume and emissions.
By Derivative Application: Vinyl Chloride Monomer Dominates While Ethyleneamines Grow Quickest
Vinyl chloride monomer absorbed 93.0% of ethylene dichloride consumption in 2026, a concentration that makes this intermediate effectively a single-purpose molecule. Ethyleneamines are the fastest-growing outlet at a 4.6% CAGR to 2033, pulled by epoxy curing agents, lubricant and fuel additives, chelating agents and gas treating chemicals, though the volumes remain a rounding error against monomer. Chlorinated solvents, including trichloroethylene and perchloroethylene, continue to decline under substitution and regulatory pressure in metal cleaning and dry cleaning. Vinylidene chloride for barrier coatings and other chlorinated intermediates hold small, stable positions that depend on specialised rather than cyclical demand. The business implication is stark: diversification away from the vinyl chain is not available at scale, so producers manage exposure through geography, integration and energy position instead of through application mix.
By End Use Industry: Construction Holds the Volume While Healthcare Sets the Pace
Building and construction represented 62.0% of downstream demand in 2026, reflecting polyvinyl chloride’s role in pipe, fittings, window and door profiles, cable insulation, roofing membrane and wall covering. Healthcare and medical is the fastest-growing end use at a 4.5% CAGR through 2033, driven by flexible tubing, blood and solution bags, catheters and single-use devices as hospital systems expand in developing economies. Packaging, automotive interiors and wire harnesses, electrical and electronics, and agriculture through irrigation pipe and greenhouse film account for the balance. Medical grades sell at higher value and face plasticiser scrutiny that construction grades never encounter, which changes formulation but not volume. The implication is that end use mix barely shifts the overall growth rate, because construction’s weight overwhelms faster-moving smaller sectors.
By Sales Channel: Captive Transfers Dominate While Spot and Export Cargoes Grow Fastest
Captive consumption accounted for 84.0% of ethylene dichloride volume in 2026, the defining structural fact of this market: most production never leaves the integrated chlor-alkali and vinyl complex that made it. Spot and export cargoes form the fastest-growing channel at a 4.2% CAGR through 2033, as energy-advantaged producers move surplus tonnage to import-dependent converters. Merchant contract sales sit between the two, covering term supply to non-integrated monomer and resin producers under annual or quarterly pricing formulas. Because captive transfers are valued internally and merchant parcels are priced against published assessments, the reported size of this market depends entirely on which of the two is counted. The implication for investors is that headline figures must always be read against a stated captive-versus-merchant boundary.
Geography Analysis
North America Converts Cheap Ethane and Power Into Exportable Chlorine Value
North America held 19.0% of the ethylene dichloride market in 2026, with the United States Gulf Coast accounting for the overwhelming majority and Canada and Mexico adding smaller positions. The regional advantage is structural: ethane from shale liquids feeds crackers at low cost, industrial power is competitively priced, and chlor-alkali and vinyl assets sit on the same integrated sites with pipeline connection and deep-water loading. That combination makes the region a consistent net exporter of ethylene dichloride, vinyl chloride monomer and resin. Domestic demand follows housing starts and municipal water spending. The change to watch is regulatory: the federal risk evaluation of 1,2-dichloroethane under chemical safety law could add handling, monitoring and reporting obligations across the chain.
Europe Runs the Highest-Cost Chlorine and Has Been Shedding Units
Europe accounted for 15.0% of demand in 2026, led by Germany, Belgium, the Netherlands, France, Italy and Spain. The region has the most demanding operating environment anywhere: electricity costs are high and volatile, industrial emission permitting is strict, and the chlor-alkali sector completed a costly conversion away from mercury-cell technology that left operators with rebuilt cell rooms and remediation liabilities. Construction demand has been flat, so utilisation depends on export resin and on cost position within the chain. Several integrated sites have been closed or restructured rather than reinvested. The decisive variable is power price, since electrolysis economics determine whether a site runs, and the clearest opportunity lies in low-carbon electricity contracts that stabilise cell room costs.
Which Region Is Leading the Ethylene Dichloride Market?
Asia Pacific leads with 51.0% of the ethylene dichloride market in 2026, a share that follows directly from where polyvinyl chloride is made and used. China operates the largest vinyl industry in the world, split between ethylene-based complexes on the coast and calcium carbide-based plants inland, and it both imports and exports the intermediate depending on domestic chlorine balances. India is the fastest-expanding consumer, running a large resin deficit and buying monomer and intermediate volumes from abroad while building integrated projects. Japan, South Korea and Taiwan host efficient export-oriented producers, and Vietnam, Indonesia and Thailand add converter demand. The regional driver is sustained investment in water networks, housing and electrical infrastructure, which keeps resin consumption growing faster than in mature economies.
Latin America Depends on Imported Intermediate for a Growing Resin Industry
Latin America represented 6.0% of the market in 2026, with Brazil, Mexico, Colombia and Argentina accounting for most consumption. The region has a long-established vinyl industry built around a limited number of integrated sites, but local chlorine and ethylene output has not kept pace with resin demand, so converters rely on imported intermediate and monomer, mainly from the Gulf Coast. Barriers are real: currency volatility raises the landed cost of dollar-priced cargoes, inland logistics for a hazardous liquid are expensive, and electricity tariffs make new electrolysis investment hard to justify. Demand itself is sound, supported by sanitation and housing programmes. The opportunity sits in debottlenecking existing complexes and in long-term import contracts that give converters price visibility.
Which Region Is Growing Fastest in the Ethylene Dichloride Market?
Middle East & Africa is the fastest-growing geography at a 4.7% CAGR between 2026 and 2033, from 9.0% share in 2026. Growth is concentrated in Saudi Arabia, Qatar and the United Arab Emirates, where integrated complexes pair low-cost ethane with competitively priced power to produce chlorine, intermediate and monomer at the bottom of the global cost curve. Egypt, Algeria, Nigeria and South Africa contribute converter demand tied to housing, irrigation and electrification programmes. Diversification policy favours building further downstream vinyl projects rather than exporting feedstock. Barriers include water constraints on cooling, dependence on imported converting technology and project execution delays. The opportunity is clear: advantaged producers can displace high-cost supply in distant markets as uneconomic units elsewhere retire.
Competitive Landscape
The ethylene dichloride market is moderately concentrated, and concentration is best understood at the complex level rather than the molecule level. A relatively small number of integrated chlor-alkali and vinyl producers control the great majority of global output, because the economics only work when electrolysis, direct chlorination, oxychlorination, monomer cracking and polymerisation sit on one site with shared utilities. Regional champions dominate their home markets, and the merchant layer is served by a handful of exporters with surplus tonnage and marine loading facilities. Consolidation has largely taken the form of asset swaps and joint ventures that tidy up chlorine balances rather than outright acquisition.
Competition is not about product, since the molecule is a commodity specification. It is about delivered cost, and delivered cost is set by three variables: industrial electricity price in the cell room, regional ethylene cost, and the value realised for co-product caustic soda. Operators compete further on reliability, because an unplanned outage in a balanced complex strands chlorine with nowhere to go. Newer entrants are national oil and gas companies moving downstream into integrated vinyl projects, using feedstock advantage rather than technology as the entry ticket.
Strategic activity concentrates on converting remaining diaphragm cell rooms to membrane technology, shifting oxychlorination units from air to oxygen operation to cut vent volumes, improving heat integration, and relocating output toward energy-advantaged coastal sites with export logistics.
Strategic direction now centres on three themes: defending the cost position that electricity and feedstock dictate, meeting tightening emission and exposure requirements without rebuilding, and placing new investment where gas and power remain cheap.
Ethylene Dichloride Industry Leaders
- Dow
- Olin Corporation
- Westlake Corporation
- Formosa Plastics Corporation
- Shin-Etsu Chemical
Recent Industry Developments
- August 2017: The Minamata Convention on Mercury entered into force, requiring parties to phase out mercury-cell chlor-alkali operation by 2025 – it set a global deadline that forced conversion or closure of the oldest chlorine units feeding ethylene dichloride production.
- November 2017: The European Union adopted best available techniques conclusions for the large volume organic chemical sector, covering the ethylene dichloride, vinyl chloride monomer and polyvinyl chloride chain – it fixed emission and monitoring benchmarks that permits must now reflect.
- December 2017: The compliance deadline under the European Union chlor-alkali best available techniques conclusions took effect, ending mercury-cell operation across the region – it completed an expensive conversion to membrane technology and permanently raised the sector’s capital base.
- December 2019: The US Environmental Protection Agency designated 1,2-dichloroethane a high-priority substance for risk evaluation under the Toxic Substances Control Act – it opened a formal federal review whose outcome could add handling, monitoring and reporting obligations across the chain.
Companies Covered in the Report
- Dow
- Olin Corporation
- Westlake Corporation
- Occidental Petroleum
- Formosa Plastics Corporation
- Shin-Etsu Chemical
- INEOS
- Tosoh Corporation
- Orbia
- Braskem
- Hanwha Solutions
- LG Chem
- Reliance Industries
- SABIC
Ethylene Dichloride Market Report Scope
This report covers 1,2-dichloroethane made by direct chlorination and oxychlorination of ethylene, counting total production including volumes transferred internally to vinyl chloride monomer units, not merchant sales alone. Downstream monomer and resin values are excluded. Because most output never leaves the integrated complex that makes it, the merchant layer is reported separately. The base year is 2025 and the forecast period runs from 2026 to 2033, valued in US$ Billion.
Production Process
- Direct Chlorination
- Oxychlorination
- Ethane-Based and Other Routes
Derivative Application
- Vinyl Chloride Monomer
- Chlorinated Solvents
- Ethyleneamines
- Vinylidene Chloride
- Other Intermediates
End Use Industry
- Building and Construction
- Packaging
- Automotive
- Electrical and Electronics
- Healthcare and Medical
- Agriculture
Sales Channel
- Captive Consumption
- Merchant Contract Sales
- Spot and Export Cargoes
Regions
- North America
- Europe
- Asia Pacific
- Latin America
- Middle East & Africa
Key Questions Answered in the Report
How big is the ethylene dichloride market in 2026?
The ethylene dichloride market is valued at US$ 24.5 billion in 2026, counting total production including captive transfers rather than merchant sales alone.
What is the ethylene dichloride market forecast and CAGR to 2033?
The market is projected to reach US$ 31.0 billion by 2033, growing at a 3.4% CAGR and adding US$ 6.5 billion in absolute dollar opportunity.
Which application consumes the most ethylene dichloride?
Vinyl chloride monomer consumes 93.0% of volume in 2026, making this intermediate effectively a single-purpose molecule within the polyvinyl chloride chain.
Which ethylene dichloride channel is growing fastest through 2033?
Spot and export cargoes grow fastest at a 4.2% CAGR, as energy-advantaged producers move surplus tonnage toward import-dependent converters abroad.
Which region leads the ethylene dichloride market and how concentrated is it?
Asia Pacific leads with 51.0% share in 2026, and concentration is medium, with integrated chlor-alkali and vinyl complexes controlling most global output.
1. Executive Summary
1.1. Global Ethylene Dichloride Market Snapshot
1.2. Future Projections
1.3. Key Report Takeaways
1.4. Regional Snapshot
2. Market Overview
2.1. Market Definition and Report Scope
2.2. Historical Trends 2020–2025
2.3. Market Dynamics
2.3.1. Drivers
2.3.1.1. Water, Sewer and Housing Programmes Keep Pulling Ethylene Dichloride Through the PVC Chain
2.3.1.2. Caustic Soda Demand Forces Chlorine Out of Electrolysis and Into Ethylene Dichloride
2.3.2. Restraints
2.3.2.1. Derivative Demand Means Ethylene Dichloride Cannot Outgrow Building Activity
2.3.2.2. Carcinogen Classification and Plant Conversion Costs Raise the Price of Operating Safely
2.3.3. Market Opportunities
2.3.3.1. Merchant Supply to Non-Integrated Converters Opens the Thin Slice That Actually Trades
2.3.3.2. Energy-Advantaged Gulf and North American Complexes Create an Export Revenue Pool
3. Global Ethylene Dichloride Market Outlook, 2020–2033
3.1. Global Ethylene Dichloride Market Outlook, by Production Process, Value (US$ Billion), 2020–2033
3.1.1. Direct Chlorination
3.1.2. Oxychlorination
3.1.3. Ethane-Based and Other Routes
3.2. Global Ethylene Dichloride Market Outlook, by Derivative Application, Value (US$ Billion), 2020–2033
3.2.1. Vinyl Chloride Monomer
3.2.2. Chlorinated Solvents
3.2.3. Ethyleneamines
3.2.4. Vinylidene Chloride
3.2.5. Other Intermediates
3.3. Global Ethylene Dichloride Market Outlook, by End Use Industry, Value (US$ Billion), 2020–2033
3.3.1. Building and Construction
3.3.2. Packaging
3.3.3. Automotive
3.3.4. Electrical and Electronics
3.3.5. Healthcare and Medical
3.3.6. Agriculture
3.4. Global Ethylene Dichloride Market Outlook, by Sales Channel, Value (US$ Billion), 2020–2033
3.4.1. Captive Consumption
3.4.2. Merchant Contract Sales
3.4.3. Spot and Export Cargoes
3.5. Global Ethylene Dichloride Market Outlook, by Region, Value (US$ Billion), 2020–2033
3.5.1. North America
3.5.2. Europe
3.5.3. Asia Pacific
3.5.4. Latin America
3.5.5. Middle East & Africa
4. North America Ethylene Dichloride Market Outlook, 2020–2033
4.1. North America Ethylene Dichloride Market Outlook, by Production Process, Value (US$ Billion), 2020–2033
4.1.1. Direct Chlorination
4.1.2. Oxychlorination
4.1.3. Ethane-Based and Other Routes
4.2. North America Ethylene Dichloride Market Outlook, by Derivative Application, Value (US$ Billion), 2020–2033
4.2.1. Vinyl Chloride Monomer
4.2.2. Chlorinated Solvents
4.2.3. Ethyleneamines
4.2.4. Vinylidene Chloride
4.2.5. Other Intermediates
4.3. North America Ethylene Dichloride Market Outlook, by End Use Industry, Value (US$ Billion), 2020–2033
4.3.1. Building and Construction
4.3.2. Packaging
4.3.3. Automotive
4.3.4. Electrical and Electronics
4.3.5. Healthcare and Medical
4.3.6. Agriculture
4.4. North America Ethylene Dichloride Market Outlook, by Sales Channel, Value (US$ Billion), 2020–2033
4.4.1. Captive Consumption
4.4.2. Merchant Contract Sales
4.4.3. Spot and Export Cargoes
4.5. North America Ethylene Dichloride Market Outlook, by Country, Value (US$ Billion), 2020–2033
4.5.1. United States Ethylene Dichloride Market Outlook, by Production Process, 2020–2033
4.5.2. United States Ethylene Dichloride Market Outlook, by Derivative Application, 2020–2033
4.5.3. United States Ethylene Dichloride Market Outlook, by End Use Industry, 2020–2033
4.5.4. United States Ethylene Dichloride Market Outlook, by Sales Channel, 2020–2033
4.5.5. Canada Ethylene Dichloride Market Outlook, by Production Process, 2020–2033
4.5.6. Canada Ethylene Dichloride Market Outlook, by Derivative Application, 2020–2033
4.5.7. Canada Ethylene Dichloride Market Outlook, by End Use Industry, 2020–2033
4.5.8. Canada Ethylene Dichloride Market Outlook, by Sales Channel, 2020–2033
4.5.9. Mexico Ethylene Dichloride Market Outlook, by Production Process, 2020–2033
4.5.10. Mexico Ethylene Dichloride Market Outlook, by Derivative Application, 2020–2033
4.5.11. Mexico Ethylene Dichloride Market Outlook, by End Use Industry, 2020–2033
4.5.12. Mexico Ethylene Dichloride Market Outlook, by Sales Channel, 2020–2033
5. Europe Ethylene Dichloride Market Outlook, 2020–2033
5.1. Europe Ethylene Dichloride Market Outlook, by Production Process, Value (US$ Billion), 2020–2033
5.1.1. Direct Chlorination
5.1.2. Oxychlorination
5.1.3. Ethane-Based and Other Routes
5.2. Europe Ethylene Dichloride Market Outlook, by Derivative Application, Value (US$ Billion), 2020–2033
5.2.1. Vinyl Chloride Monomer
5.2.2. Chlorinated Solvents
5.2.3. Ethyleneamines
5.2.4. Vinylidene Chloride
5.2.5. Other Intermediates
5.3. Europe Ethylene Dichloride Market Outlook, by End Use Industry, Value (US$ Billion), 2020–2033
5.3.1. Building and Construction
5.3.2. Packaging
5.3.3. Automotive
5.3.4. Electrical and Electronics
5.3.5. Healthcare and Medical
5.3.6. Agriculture
5.4. Europe Ethylene Dichloride Market Outlook, by Sales Channel, Value (US$ Billion), 2020–2033
5.4.1. Captive Consumption
5.4.2. Merchant Contract Sales
5.4.3. Spot and Export Cargoes
5.5. Europe Ethylene Dichloride Market Outlook, by Country, Value (US$ Billion), 2020–2033
5.5.1. Germany Ethylene Dichloride Market Outlook, by Production Process, 2020–2033
5.5.2. Germany Ethylene Dichloride Market Outlook, by Derivative Application, 2020–2033
5.5.3. Germany Ethylene Dichloride Market Outlook, by End Use Industry, 2020–2033
5.5.4. Germany Ethylene Dichloride Market Outlook, by Sales Channel, 2020–2033
5.5.5. Belgium Ethylene Dichloride Market Outlook, by Production Process, 2020–2033
5.5.6. Belgium Ethylene Dichloride Market Outlook, by Derivative Application, 2020–2033
5.5.7. Belgium Ethylene Dichloride Market Outlook, by End Use Industry, 2020–2033
5.5.8. Belgium Ethylene Dichloride Market Outlook, by Sales Channel, 2020–2033
5.5.9. Netherlands Ethylene Dichloride Market Outlook, by Production Process, 2020–2033
5.5.10. Netherlands Ethylene Dichloride Market Outlook, by Derivative Application, 2020–2033
5.5.11. Netherlands Ethylene Dichloride Market Outlook, by End Use Industry, 2020–2033
5.5.12. Netherlands Ethylene Dichloride Market Outlook, by Sales Channel, 2020–2033
5.5.13. France Ethylene Dichloride Market Outlook, by Production Process, 2020–2033
5.5.14. France Ethylene Dichloride Market Outlook, by Derivative Application, 2020–2033
5.5.15. France Ethylene Dichloride Market Outlook, by End Use Industry, 2020–2033
5.5.16. France Ethylene Dichloride Market Outlook, by Sales Channel, 2020–2033
5.5.17. Italy Ethylene Dichloride Market Outlook, by Production Process, 2020–2033
5.5.18. Italy Ethylene Dichloride Market Outlook, by Derivative Application, 2020–2033
5.5.19. Italy Ethylene Dichloride Market Outlook, by End Use Industry, 2020–2033
5.5.20. Italy Ethylene Dichloride Market Outlook, by Sales Channel, 2020–2033
5.5.21. Spain Ethylene Dichloride Market Outlook, by Production Process, 2020–2033
5.5.22. Spain Ethylene Dichloride Market Outlook, by Derivative Application, 2020–2033
5.5.23. Spain Ethylene Dichloride Market Outlook, by End Use Industry, 2020–2033
5.5.24. Spain Ethylene Dichloride Market Outlook, by Sales Channel, 2020–2033
6. Asia Pacific Ethylene Dichloride Market Outlook, 2020–2033
6.1. Asia Pacific Ethylene Dichloride Market Outlook, by Production Process, Value (US$ Billion), 2020–2033
6.1.1. Direct Chlorination
6.1.2. Oxychlorination
6.1.3. Ethane-Based and Other Routes
6.2. Asia Pacific Ethylene Dichloride Market Outlook, by Derivative Application, Value (US$ Billion), 2020–2033
6.2.1. Vinyl Chloride Monomer
6.2.2. Chlorinated Solvents
6.2.3. Ethyleneamines
6.2.4. Vinylidene Chloride
6.2.5. Other Intermediates
6.3. Asia Pacific Ethylene Dichloride Market Outlook, by End Use Industry, Value (US$ Billion), 2020–2033
6.3.1. Building and Construction
6.3.2. Packaging
6.3.3. Automotive
6.3.4. Electrical and Electronics
6.3.5. Healthcare and Medical
6.3.6. Agriculture
6.4. Asia Pacific Ethylene Dichloride Market Outlook, by Sales Channel, Value (US$ Billion), 2020–2033
6.4.1. Captive Consumption
6.4.2. Merchant Contract Sales
6.4.3. Spot and Export Cargoes
6.5. Asia Pacific Ethylene Dichloride Market Outlook, by Country, Value (US$ Billion), 2020–2033
6.5.1. China Ethylene Dichloride Market Outlook, by Production Process, 2020–2033
6.5.2. China Ethylene Dichloride Market Outlook, by Derivative Application, 2020–2033
6.5.3. China Ethylene Dichloride Market Outlook, by End Use Industry, 2020–2033
6.5.4. China Ethylene Dichloride Market Outlook, by Sales Channel, 2020–2033
6.5.5. India Ethylene Dichloride Market Outlook, by Production Process, 2020–2033
6.5.6. India Ethylene Dichloride Market Outlook, by Derivative Application, 2020–2033
6.5.7. India Ethylene Dichloride Market Outlook, by End Use Industry, 2020–2033
6.5.8. India Ethylene Dichloride Market Outlook, by Sales Channel, 2020–2033
6.5.9. Japan Ethylene Dichloride Market Outlook, by Production Process, 2020–2033
6.5.10. Japan Ethylene Dichloride Market Outlook, by Derivative Application, 2020–2033
6.5.11. Japan Ethylene Dichloride Market Outlook, by End Use Industry, 2020–2033
6.5.12. Japan Ethylene Dichloride Market Outlook, by Sales Channel, 2020–2033
6.5.13. South Korea Ethylene Dichloride Market Outlook, by Production Process, 2020–2033
6.5.14. South Korea Ethylene Dichloride Market Outlook, by Derivative Application, 2020–2033
6.5.15. South Korea Ethylene Dichloride Market Outlook, by End Use Industry, 2020–2033
6.5.16. South Korea Ethylene Dichloride Market Outlook, by Sales Channel, 2020–2033
6.5.17. Taiwan Ethylene Dichloride Market Outlook, by Production Process, 2020–2033
6.5.18. Taiwan Ethylene Dichloride Market Outlook, by Derivative Application, 2020–2033
6.5.19. Taiwan Ethylene Dichloride Market Outlook, by End Use Industry, 2020–2033
6.5.20. Taiwan Ethylene Dichloride Market Outlook, by Sales Channel, 2020–2033
6.5.21. Vietnam Ethylene Dichloride Market Outlook, by Production Process, 2020–2033
6.5.22. Vietnam Ethylene Dichloride Market Outlook, by Derivative Application, 2020–2033
6.5.23. Vietnam Ethylene Dichloride Market Outlook, by End Use Industry, 2020–2033
6.5.24. Vietnam Ethylene Dichloride Market Outlook, by Sales Channel, 2020–2033
6.5.25. Indonesia Ethylene Dichloride Market Outlook, by Production Process, 2020–2033
6.5.26. Indonesia Ethylene Dichloride Market Outlook, by Derivative Application, 2020–2033
6.5.27. Indonesia Ethylene Dichloride Market Outlook, by End Use Industry, 2020–2033
6.5.28. Indonesia Ethylene Dichloride Market Outlook, by Sales Channel, 2020–2033
6.5.29. Thailand Ethylene Dichloride Market Outlook, by Production Process, 2020–2033
6.5.30. Thailand Ethylene Dichloride Market Outlook, by Derivative Application, 2020–2033
6.5.31. Thailand Ethylene Dichloride Market Outlook, by End Use Industry, 2020–2033
6.5.32. Thailand Ethylene Dichloride Market Outlook, by Sales Channel, 2020–2033
7. Latin America Ethylene Dichloride Market Outlook, 2020–2033
7.1. Latin America Ethylene Dichloride Market Outlook, by Production Process, Value (US$ Billion), 2020–2033
7.1.1. Direct Chlorination
7.1.2. Oxychlorination
7.1.3. Ethane-Based and Other Routes
7.2. Latin America Ethylene Dichloride Market Outlook, by Derivative Application, Value (US$ Billion), 2020–2033
7.2.1. Vinyl Chloride Monomer
7.2.2. Chlorinated Solvents
7.2.3. Ethyleneamines
7.2.4. Vinylidene Chloride
7.2.5. Other Intermediates
7.3. Latin America Ethylene Dichloride Market Outlook, by End Use Industry, Value (US$ Billion), 2020–2033
7.3.1. Building and Construction
7.3.2. Packaging
7.3.3. Automotive
7.3.4. Electrical and Electronics
7.3.5. Healthcare and Medical
7.3.6. Agriculture
7.4. Latin America Ethylene Dichloride Market Outlook, by Sales Channel, Value (US$ Billion), 2020–2033
7.4.1. Captive Consumption
7.4.2. Merchant Contract Sales
7.4.3. Spot and Export Cargoes
7.5. Latin America Ethylene Dichloride Market Outlook, by Country, Value (US$ Billion), 2020–2033
7.5.1. Brazil Ethylene Dichloride Market Outlook, by Production Process, 2020–2033
7.5.2. Brazil Ethylene Dichloride Market Outlook, by Derivative Application, 2020–2033
7.5.3. Brazil Ethylene Dichloride Market Outlook, by End Use Industry, 2020–2033
7.5.4. Brazil Ethylene Dichloride Market Outlook, by Sales Channel, 2020–2033
7.5.5. Mexico Ethylene Dichloride Market Outlook, by Production Process, 2020–2033
7.5.6. Mexico Ethylene Dichloride Market Outlook, by Derivative Application, 2020–2033
7.5.7. Mexico Ethylene Dichloride Market Outlook, by End Use Industry, 2020–2033
7.5.8. Mexico Ethylene Dichloride Market Outlook, by Sales Channel, 2020–2033
7.5.9. Colombia Ethylene Dichloride Market Outlook, by Production Process, 2020–2033
7.5.10. Colombia Ethylene Dichloride Market Outlook, by Derivative Application, 2020–2033
7.5.11. Colombia Ethylene Dichloride Market Outlook, by End Use Industry, 2020–2033
7.5.12. Colombia Ethylene Dichloride Market Outlook, by Sales Channel, 2020–2033
7.5.13. Argentina Ethylene Dichloride Market Outlook, by Production Process, 2020–2033
7.5.14. Argentina Ethylene Dichloride Market Outlook, by Derivative Application, 2020–2033
7.5.15. Argentina Ethylene Dichloride Market Outlook, by End Use Industry, 2020–2033
7.5.16. Argentina Ethylene Dichloride Market Outlook, by Sales Channel, 2020–2033
8. Middle East & Africa Ethylene Dichloride Market Outlook, 2020–2033
8.1. Middle East & Africa Ethylene Dichloride Market Outlook, by Production Process, Value (US$ Billion), 2020–2033
8.1.1. Direct Chlorination
8.1.2. Oxychlorination
8.1.3. Ethane-Based and Other Routes
8.2. Middle East & Africa Ethylene Dichloride Market Outlook, by Derivative Application, Value (US$ Billion), 2020–2033
8.2.1. Vinyl Chloride Monomer
8.2.2. Chlorinated Solvents
8.2.3. Ethyleneamines
8.2.4. Vinylidene Chloride
8.2.5. Other Intermediates
8.3. Middle East & Africa Ethylene Dichloride Market Outlook, by End Use Industry, Value (US$ Billion), 2020–2033
8.3.1. Building and Construction
8.3.2. Packaging
8.3.3. Automotive
8.3.4. Electrical and Electronics
8.3.5. Healthcare and Medical
8.3.6. Agriculture
8.4. Middle East & Africa Ethylene Dichloride Market Outlook, by Sales Channel, Value (US$ Billion), 2020–2033
8.4.1. Captive Consumption
8.4.2. Merchant Contract Sales
8.4.3. Spot and Export Cargoes
8.5. Middle East & Africa Ethylene Dichloride Market Outlook, by Country, Value (US$ Billion), 2020–2033
8.5.1. Saudi Arabia Ethylene Dichloride Market Outlook, by Production Process, 2020–2033
8.5.2. Saudi Arabia Ethylene Dichloride Market Outlook, by Derivative Application, 2020–2033
8.5.3. Saudi Arabia Ethylene Dichloride Market Outlook, by End Use Industry, 2020–2033
8.5.4. Saudi Arabia Ethylene Dichloride Market Outlook, by Sales Channel, 2020–2033
8.5.5. Qatar Ethylene Dichloride Market Outlook, by Production Process, 2020–2033
8.5.6. Qatar Ethylene Dichloride Market Outlook, by Derivative Application, 2020–2033
8.5.7. Qatar Ethylene Dichloride Market Outlook, by End Use Industry, 2020–2033
8.5.8. Qatar Ethylene Dichloride Market Outlook, by Sales Channel, 2020–2033
8.5.9. United Arab Emirates Ethylene Dichloride Market Outlook, by Production Process, 2020–2033
8.5.10. United Arab Emirates Ethylene Dichloride Market Outlook, by Derivative Application, 2020–2033
8.5.11. United Arab Emirates Ethylene Dichloride Market Outlook, by End Use Industry, 2020–2033
8.5.12. United Arab Emirates Ethylene Dichloride Market Outlook, by Sales Channel, 2020–2033
8.5.13. Egypt Ethylene Dichloride Market Outlook, by Production Process, 2020–2033
8.5.14. Egypt Ethylene Dichloride Market Outlook, by Derivative Application, 2020–2033
8.5.15. Egypt Ethylene Dichloride Market Outlook, by End Use Industry, 2020–2033
8.5.16. Egypt Ethylene Dichloride Market Outlook, by Sales Channel, 2020–2033
8.5.17. Algeria Ethylene Dichloride Market Outlook, by Production Process, 2020–2033
8.5.18. Algeria Ethylene Dichloride Market Outlook, by Derivative Application, 2020–2033
8.5.19. Algeria Ethylene Dichloride Market Outlook, by End Use Industry, 2020–2033
8.5.20. Algeria Ethylene Dichloride Market Outlook, by Sales Channel, 2020–2033
8.5.21. Nigeria Ethylene Dichloride Market Outlook, by Production Process, 2020–2033
8.5.22. Nigeria Ethylene Dichloride Market Outlook, by Derivative Application, 2020–2033
8.5.23. Nigeria Ethylene Dichloride Market Outlook, by End Use Industry, 2020–2033
8.5.24. Nigeria Ethylene Dichloride Market Outlook, by Sales Channel, 2020–2033
8.5.25. South Africa Ethylene Dichloride Market Outlook, by Production Process, 2020–2033
8.5.26. South Africa Ethylene Dichloride Market Outlook, by Derivative Application, 2020–2033
8.5.27. South Africa Ethylene Dichloride Market Outlook, by End Use Industry, 2020–2033
8.5.28. South Africa Ethylene Dichloride Market Outlook, by Sales Channel, 2020–2033
9. Competitive Landscape
9.1. Market Concentration and Industry Leaders
9.2. Competitive Differentiation
9.3. Strategic Moves and Market Direction
9.4. Recent Industry Developments
9.5. Company Profiles
9.5.1. Dow
9.5.2. Olin Corporation
9.5.3. Westlake Corporation
9.5.4. Occidental Petroleum
9.5.5. Formosa Plastics Corporation
9.5.6. Shin-Etsu Chemical
9.5.7. INEOS
9.5.8. Tosoh Corporation
9.5.9. Orbia
9.5.10. Braskem
9.5.11. Hanwha Solutions
9.5.12. LG Chem
9.5.13. Reliance Industries
9.5.14. SABIC
10. Appendix
10.1. Research Methodology
10.2. Report Assumptions
10.3. Acronyms and Abbreviations
| Production Process | Direct Chlorination, Oxychlorination, Ethane-Based and Other Routes |
| Derivative Application | Vinyl Chloride Monomer, Chlorinated Solvents, Ethyleneamines, Vinylidene Chloride, Other Intermediates |
| End Use Industry | Building and Construction, Packaging, Automotive, Electrical and Electronics, Healthcare and Medical, Agriculture |
| Sales Channel | Captive Consumption, Merchant Contract Sales, Spot and Export Cargoes |
| Regions | North America, Europe, Asia Pacific, Latin America, Middle East & Africa |
Our Research Methodology
Considering the volatility of business today, traditional approaches to strategizing a game plan can be unfruitful if not detrimental. True ambiguity is no way to determine a forecast. A myriad of predetermined factors must be accounted for such as the degree of risk involved, the magnitude of circumstances, as well as conditions or consequences that are not known or unpredictable. To circumvent binary views that cast uncertainty, the application of market research intelligence to strategically posture, move, and enable actionable outcomes is necessary.
View Methodology
Quality Assured
Rigorous Validation Process

Confidentiality Assured
End-to-end Data Security

Custom Research Services
Tailored To Your Objectives
FAQs
The ethylene dichloride market is valued at US$ 24.5 billion in 2026, counting total production including captive transfers rather than merchant sales alone.
The market is projected to reach US$ 31.0 billion by 2033, growing at a 3.4% CAGR and adding US$ 6.5 billion in absolute dollar opportunity.
Vinyl chloride monomer consumes 93.0% of volume in 2026, making this intermediate effectively a single-purpose molecule within the polyvinyl chloride chain.
Spot and export cargoes grow fastest at a 4.2% CAGR, as energy-advantaged producers move surplus tonnage toward import-dependent converters abroad.
Asia Pacific leads with 51.0% share in 2026, and concentration is medium, with integrated chlor-alkali and vinyl complexes controlling most global output.
Related Reports
Non-load Bearing Walls Market Size, Share, Insights, Competitive Landscape, and Forecast 2026 to 2033
The non-load bearing walls market is projected to grow from US$96.0 billion in 2026 to US$136.0 billion by 2033, at a 5.1% CAGR. Explore key trends.
Nanoparticle Technology Market Size, Share, Insights, Competitive Landscape, and Forecast 2026 to 2033
The nanoparticle technology market is projected to grow from US$24.0 billion in 2026 to US$48.0 billion by 2033, at a 10.4% CAGR. Explore key trends.
Expanded PTFE (ePTFE) Market Size, Share, Insights, Competitive Landscape, and Forecast 2026 to 2033
The expanded PTFE market is projected to grow from US$2.4 billion in 2026 to US$3.8 billion by 2033, at a 6.8% CAGR. Explore segments and regional trends.
3D Printing Photopolymers Market Size, Share, Insights, Competitive Landscape, and Forecast 2026 to 2033
The global 3D printing photopolymers market is valued at US$4.04 billion in 2026, reaching US$10.93 billion by 2033, growing at a 15.3% CAGR
Abaca Fiber Market Size, Share, Insights, Competitive Landscape, and Forecast 2026 to 2033
The global abaca fiber market is valued at US$542.7 million in 2026, reaching US$1,207.5 million by 2033, growing at a 12.1% CAGR
Ethyl Acetate Market Size, Share, Insights, Competitive Landscape, and Forecast 2026 to 2033
The ethyl acetate market is projected to grow from US$4.6 billion in 2026 to US$6.1 billion by 2033, at a CAGR of 4.1%, led by Asia Pacific packaging demand.