



Nanoparticle Technology Market
Nanoparticle Technology Market Size, Share, Insights, Competitive Landscape, and Forecast 2026 to 2033
Nanoparticle Technology Market Size and Trend Analysis
How Large Is the Nanoparticle Technology Market by 2033?
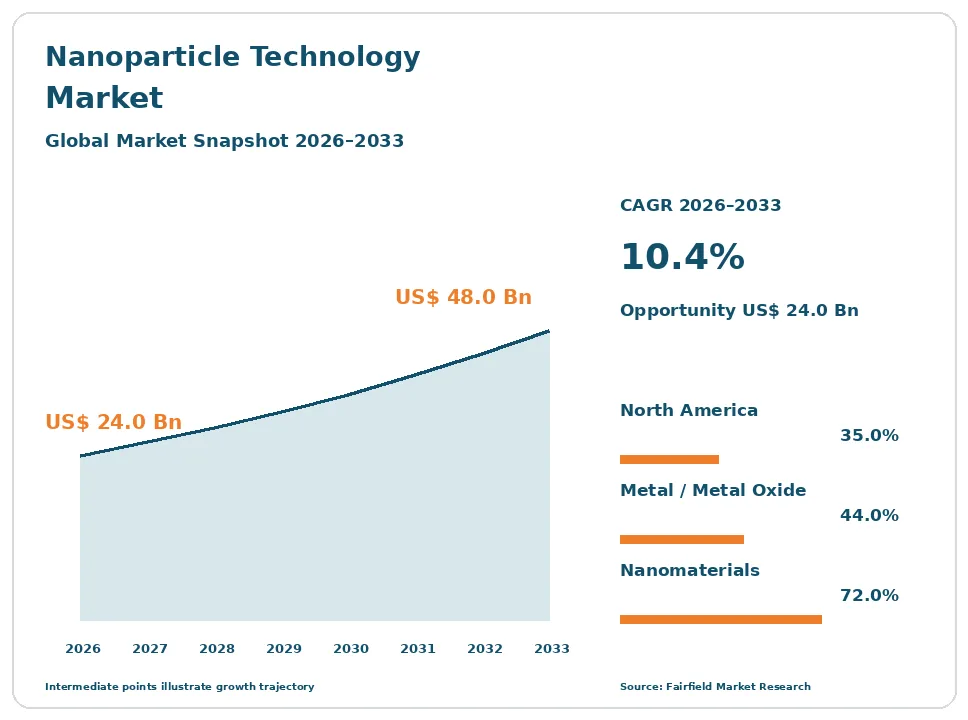
The global Nanoparticle Technology market size is expected to be valued at US$ 24.0 billion in 2026 and projected to reach US$ 48.0 billion by 2033, growing at a CAGR of 10.4% between 2026 and 2033.
The market grew at an 8.4% CAGR between 2020 and 2025 to reach US$ 21.8 billion on the boundary used here, which counts nanomaterials plus related services and instruments, not the devices they end up in. Estimates diverge mainly over where that line is drawn, because this is not one industry but several sharing only a length scale. Semiconductor and display materials moved to contracted volume purchasing, led by polishing slurries and quantum dot films. Conductive carbon additives became standard content in lithium-ion electrodes rather than an optional upgrade. Lipid and polymeric carriers turned formulation and characterisation into a service business alongside material supply. Against that, several long-promised materials remain pre-commercial, so growth is uneven rather than broad.
Key Report Takeaways
- By Material Type: Metal and metal oxide nanoparticles held 44.0% share in 2026, while quantum dots and semiconductor nanocrystals are projected to expand at a 14.2% CAGR through 2033, on display, sensor and emerging photovoltaic demand.
- By Synthesis Method: Gas-phase synthesis held 38.0% share in 2026, while chemical and colloidal synthesis is projected to grow at an 11.9% CAGR through 2033, because precise size control is required for nanocrystals and lipid carriers.
- By Application: Coatings, polymers and composites held 25.0% share in 2026, while energy storage and catalysis is projected to grow at a 13.5% CAGR through 2033, driven by conductive additives in lithium-ion electrodes.
- By Offering: Nanomaterials held 72.0% share in 2026, while formulation, dispersion and functionalisation services are projected to advance at a 12.4% CAGR through 2033, because customers buy stable dispersions rather than dry powder.
- By Geography: North America held 35.0% share in 2026, while Asia Pacific is projected to expand at a 12.6% CAGR through 2033, on its concentration of electronics, display and battery materials manufacturing.
Global Nanoparticle Technology Market Trends and Insights
Drivers Impact Analysis
| Driver | Impact on CAGR Forecast | Geographic Relevance | Impact Timeline |
| Semiconductor and display materials moving from speciality to volume purchasing | High | Asia Pacific, North America | Medium term 2–4 years |
| Conductive carbon nanomaterials becoming standard in lithium-ion electrodes | High | Asia Pacific, Europe | Short term ≤2 years |
Two mature, high-volume demand pools account for most of the growth, and both sit in electronics rather than in healthcare.
Chip and Display Manufacturing Has Turned Nanoparticles Into a Volume Purchase
Semiconductor and display production is the single largest pull on engineered nanoparticles today. Chemical mechanical planarisation slurries consume colloidal silica, ceria and alumina in tonnage quantities, and every additional wafer layer adds polishing steps. Quantum dot films are now standard in premium televisions and monitors, and nanoscale metal inks and pastes are used in printed and flexible electronics. These buyers purchase to specification on repeat contracts rather than sampling for development.
The mechanism is process control, not novelty. As device geometries shrink, particle size distribution, purity and defect counts translate directly into yield, so fabs qualify a supplier’s nanomaterial and then resist changing it. Investment in new wafer and display fabrication plants across several economies therefore converts into predictable, contracted nanomaterial demand several years ahead of the plant starting commercial production.
Conductive Carbon Nanomaterials Have Become Standard Content in Lithium-Ion Electrodes
Battery manufacturing has delivered the fastest genuine volume increase in carbon nanomaterials. Multi-walled carbon nanotubes are now routinely added to cathode and anode formulations, where a small weight fraction builds a conductive network more efficiently than conventional carbon black. That raises usable energy density and improves fast-charge performance, which is exactly what cell makers are being asked to deliver.
The causal mechanism is formulation economics. Because nanotubes form a percolating network at low loading, cell makers can displace several times their weight of conventional additive and free volume for active material. The effect is strongest in high-nickel cathodes and silicon-containing anodes, where electrode cracking and conductivity loss across cycling are real failure modes rather than theoretical ones. Adoption therefore follows directly from the industry’s move toward higher-energy chemistries and faster charging.
Restraints Impact Analysis
| Restraint | Impact on CAGR Forecast | Geographic Relevance | Impact Timeline |
| Nanoform registration cost and unresolved toxicology for several materials | High | Europe, North America | Long term ≥4 years |
| Dispersion, agglomeration and the economics of scaling synthesis | Medium | Global | Medium term 2–4 years |
Two constraints hold back materials that work in the laboratory but struggle to reach commercial use.
Nanoform Registration and Unresolved Toxicology Keep Several Materials Off the Market
Regulatory burden falls unevenly and hits small producers hardest. Information requirements specific to nanoforms sit inside European chemicals registration, so each distinct size, shape, surface treatment and coating can require its own characterisation and hazard data set. A producer selling one chemical in six surface variants may therefore face six data packages, which together can cost more than the revenue those variants generate in a year.
The underlying cause is scientific uncertainty. For several materials, including some fibre-like nanotubes and certain metal oxides, inhalation toxicology and long-term worker exposure effects remain contested, and occupational exposure recommendations differ between authorities. Formulators respond by avoiding nanoforms in consumer-facing products where labelling obligations apply, and by preferring bound, granulated or pre-dispersed forms over free powder wherever a customer specification still allows the choice to be made.
Dispersion and Scale-Up Economics Explain Why Nanomaterials Underperform Their Data Sheets
The most common commercial disappointment in this market has nothing to do with the particle. Nanoparticles agglomerate, and once agglomerated they behave like a coarse filler, so a material that performs superbly in a laboratory dispersion often delivers a fraction of the promised property improvement in a real coating, resin or electrode slurry. Customers usually blame the material, when the failure actually sits in dispersion equipment and interface chemistry.
Scale-up is the second cost. Gas-phase and colloidal routes that are stable at kilogram scale often lose size distribution control at tonne scale, and surface functionalisation steps add solvent handling, washing and drying. For materials that must compete against established fillers and additives on price per kilogram, those extra unit operations frequently decide that the economics never close at commercial volume.
Market Opportunities
Diagnostics and Nanoparticle Drug Delivery Open a Formulation Services Revenue Pool
Healthcare offers the highest value per gram in this market, and increasingly it is sold as a service rather than as a material. Lipid nanoparticles for nucleic acid delivery, polymeric carriers for controlled release, gold nanoparticles in lateral flow and point-of-care tests, and iron oxide particles in imaging and cell separation all require formulation, encapsulation and analytical work that most developers cannot perform in-house. The pool grows with clinical pipelines rather than with industrial output.
Specialist contract developers, instrument suppliers and excipient producers with regulatory experience can capture it, selling to biotechnology companies and diagnostics manufacturers. Demand is reinforced by regulatory guidance on nanotechnology in medicinal and regulated products, which rewards suppliers able to provide full physicochemical characterisation and stability packages rather than material with a simple certificate of analysis attached.
Catalysis for Emissions, Chemicals and Hydrogen Creates a High-Value Nanoparticle Pool
Catalysis is the quietest large opportunity in nanotechnology, because the function depends entirely on nanoscale structure. Cerium oxide in emissions control, platinum-group metal nanoparticles on supports, nickel and cobalt particles in chemical synthesis, and dispersed catalysts in water electrolysis and fuel cells all sell on activity per gram of precious metal. Thrifting expensive metal by controlling particle size and dispersion has direct, measurable commercial value.
Catalyst manufacturers, refiners and electrolyser builders are positioned to capture this pool, and the customer group is widening steadily from refining and automotive aftertreatment toward hydrogen production and chemical recycling. Supporting developments include the sustained push to cut iridium and platinum loading per kilowatt in water electrolysers, and tightening industrial emission limits that require higher-activity formulations to fit within existing reactor volumes rather than justifying larger installations.
Segment Analysis
By Material Type: Metal Oxides Carry the Volume While Quantum Dots Grow Fastest
Metal and metal oxide nanoparticles held 44.0% of the market in 2026, the largest group because fumed and colloidal silica, titanium dioxide, zinc oxide, alumina, ceria and iron oxide are ordinary industrial inputs with established supply chains and decades of use. Quantum dots and semiconductor nanocrystals grow fastest at a 14.2% CAGR through 2033, pulled by display films, image sensors and emerging photovoltaic work. Carbon nanomaterials, covering nanotubes, graphene and fullerenes, sit between the two, with nanotubes commercially mature in batteries while graphene remains uneven. Nanoclays, nanocellulose and polymeric and lipid carriers complete the set. The important distinction is maturity, not chemistry: some of these materials are commodities with price curves, while others have been described as near-commercial for two decades.
By Synthesis Method: Gas-Phase Routes Lead While Colloidal Synthesis Gains Ground
Gas-phase synthesis accounted for 38.0% of production in 2026, because flame pyrolysis, plasma and vapour deposition routes make the highest-tonnage materials, including fumed silica, titania and most carbon nanomaterials, continuously and at low unit cost. Chemical and colloidal synthesis is the fastest-growing route at an 11.9% CAGR through 2033, since precise control of size, shape and surface chemistry is unavoidable for quantum dots, catalyst particles and lipid carriers. Mechanical and top-down methods, including milling and exfoliation, remain important for nanoclays and some graphene grades, while biological and green synthesis stays small and mostly pre-commercial. The implication is that process selection follows the required precision, and that value migrates toward routes where particle uniformity, rather than tonnage, determines what a customer will pay.
By Application: Coatings and Composites Lead While Energy Storage Sets the Pace
Coatings, polymers and composites held 25.0% of demand in 2026, the largest application because reinforcing silica, rheology modifiers, ultraviolet absorbers and pigment-grade oxides are embedded across paints, adhesives, sealants, tyres and plastics. Energy storage and catalysis expands fastest at a 13.5% CAGR through 2033, led by conductive additives in lithium-ion electrodes and by catalysts in emissions control, chemical production and water electrolysis. Electronics and semiconductors form a close second by value, with healthcare and diagnostics commanding the highest price per gram. Cosmetics and personal care, textiles and environmental applications complete the structure, with cosmetics facing the most specific labelling obligations. The implication is that an averaged growth rate conceals very different trajectories, so application-level forecasting is the only reliable approach here.
By Offering: Materials Dominate Revenue While Services Grow Faster
Nanomaterials themselves represented 72.0% of revenue in 2026, which is unsurprising given that most demand is for tonnage products sold by the kilogram. Formulation, dispersion and functionalisation services are the fastest-growing offering at a 12.4% CAGR through 2033, because customers have learned that buying dry powder transfers the hardest problem to their own factory. Suppliers increasingly sell a stable masterbatch, slurry or pre-dispersed concentrate matched to a specific resin or electrolyte, and charge for the formulation knowledge rather than the solids. Characterisation instrumentation, covering particle sizing, electron microscopy and surface area analysis, makes up the remainder and benefits from regulatory data requirements. The implication is that margin is moving from making particles toward making them usable in a customer’s process.
Geography Analysis
Which Region Is Leading the Nanoparticle Technology Market?
North America leads the nanoparticle technology market with 35.0% share in 2026, a position that reflects the boundary drawn in this report rather than tonnage produced. The United States holds the largest concentration of value-dense activity: pharmaceutical and diagnostic nanoparticle formulation, semiconductor materials supply, catalyst development, characterisation instrumentation and specialised contract development. Federal research funding and defence-related materials programmes sustain a deep base of early-stage suppliers, while Canada contributes nanocellulose and quantum dot work. Regulatory treatment is comparatively permissive, with product-specific guidance from the US Food and Drug Administration rather than a horizontal nanomaterial law. The regional change to watch is onshoring of chip and battery materials supply, which is pulling nanomaterial production closer to the plants that consume it.
Europe Regulates Nanomaterials More Tightly Than Anywhere Else
Europe accounted for 23.0% of the market in 2026, led by Germany, France, the United Kingdom, Belgium and the Netherlands. The region hosts several of the largest producers of fumed silica, carbon nanomaterials and catalyst systems, alongside a strong instrumentation base. What distinguishes it is regulation: nanoform-specific information requirements in chemicals registration, nano labelling obligations in cosmetics, a separate authorisation route for engineered nanomaterials in food, and a formal definition that has been revised once already. Compliance cost is therefore a genuine competitive variable, favouring large producers able to amortise data packages. The opportunity lies in catalysis and battery materials tied to industrial decarbonisation programmes, where performance requirements justify the registration burden.
Which Region Is Growing Fastest in the Nanoparticle Technology Market?
Asia Pacific is the fastest-growing geography at a 12.6% CAGR between 2026 and 2033, from 34.0% share in 2026, and it is where most physical production already happens. China manufactures the bulk of global carbon nanotube output for batteries and a large share of metal oxide nanoparticles, supported by an integrated electrode and cell supply chain. Japan supplies high-purity materials, single-wall nanotubes and precision instruments, while South Korea and Taiwan anchor display, semiconductor and battery materials demand. India is building formulation and pharmaceutical nanoparticle work from a smaller base. Growth is underwritten by electronics and cell manufacturing investment rather than by research funding. The main constraint is price competition in commodity grades, which compresses margins for undifferentiated producers.
Latin America Applies Nanoparticles Mainly Through Imported Formulations
Latin America represented 4.5% of the nanoparticle technology market in 2026, with Brazil and Mexico accounting for most activity and Argentina, Chile and Colombia adding research-led demand. Consumption is overwhelmingly applied rather than produced: nanoparticle-containing coatings, agricultural formulations, sunscreens and construction additives arrive as finished dispersions from abroad, while local production concentrates on nanocellulose from pulp operations and on silver nanoparticles for antimicrobial uses. Barriers are structural, including limited characterisation infrastructure, currency exposure on imported materials, few local toxicology testing facilities and regulatory frameworks that do not yet address nanoforms explicitly. The clearest opportunity lies in agriculture, where controlled-release and nanoscale delivery formulations can cut applied volumes of crop inputs across very large planted areas.
Middle East & Africa Builds Nanoparticle Demand Around Water, Energy and Research Investment
Middle East & Africa held 3.5% share in 2026, with Saudi Arabia, the United Arab Emirates, Israel, Egypt and South Africa accounting for most activity. Demand is concentrated in three places: catalysts and additives for refining and petrochemical operations, membranes and nanomaterials for desalination and water treatment, and research-driven work at well-funded universities and national laboratories. Diversification programmes have financed laboratories and pilot lines, so the region has stronger research output than commercial production. Barriers include almost complete dependence on imported materials, a thin local supplier base, limited scale-up facilities and few specialist testing laboratories. The main opportunity is water treatment, where nanomaterial-enabled membranes and adsorbents address a permanent structural scarcity rather than a cyclical need.
Competitive Landscape
The nanoparticle technology market is fragmented, and more deeply than most materials markets, because it is really several markets stacked under one label. Large diversified chemical producers dominate high-tonnage metal oxides, fumed silica and catalyst systems, where scale, energy integration and distribution decide the winner. Carbon nanomaterials are concentrated among a smaller group of specialists and battery-chain suppliers. Quantum dots, nanocellulose and delivery carriers are held mainly by venture-backed companies and university spin-outs, many of which have operated for a decade without reaching profitable volume. Instrument suppliers form a separate competitive set again, and almost no company competes across all of these.
The basis of competition differs by tier. In commodity grades it is cost per kilogram, consistency and supply security, and buyers qualify second sources aggressively. In precision materials it is particle uniformity, purity and lot-to-lot reproducibility, measured against the customer’s own process rather than a data sheet. In regulated applications the deciding factor is documentation, because a complete characterisation and toxicology package is often harder to assemble than the material itself. New entrants arrive mainly from downstream customers integrating backwards into dispersion and from contract developers adding formulation.
Strategic activity concentrates on moving from powder supply to pre-dispersed concentrates, building the regulatory data packages that nanoform registration requires, co-locating production with battery and electronics customers, and consolidating sub-scale speciality producers into larger platforms.
Strategic direction now centres on three themes: selling usability rather than particles, separating genuinely commercial materials from perpetual pre-commercial ones, and treating regulatory data as an asset.
Nanoparticle Technology Industry Leaders
- Evonik Industries
- Cabot Corporation
- BASF
- Merck KGaA
- Arkema
Recent Industry Developments
- October 2011: The European Commission adopted its recommendation on the definition of a nanomaterial – it gave regulators across chemicals, cosmetics and food a common size-based boundary and became the reference point for every later nano-specific obligation.
- July 2013: The European Union Cosmetic Products Regulation became fully applicable, requiring pre-market notification of nanomaterials and a nano suffix in ingredient lists – it created the first consumer-visible labelling obligation for engineered nanoparticles.
- January 2020: Nanoform-specific information requirements added to the REACH annexes became applicable – each distinct size, shape, surface treatment and coating can now require its own characterisation and hazard data, which raised the fixed cost of selling nanomaterial variants in Europe.
- February 2022: The European Union withdrew the authorisation of titanium dioxide as a food additive following a safety reassessment that could not exclude genotoxicity concerns, with a transition period ending in August 2022 – it is the clearest example yet of a nanoscale ingredient losing an established market.
- June 2022: The European Commission adopted a revised recommendation on the definition of a nanomaterial, replacing the earlier text – it tightened the measurement basis and reduced ambiguity about which materials fall inside nano-specific rules.
Companies Covered in the Report
- Evonik Industries
- Cabot Corporation
- BASF
- Merck KGaA
- Arkema
- Nouryon
- Zeon Corporation
- LG Chem
- Resonac Holdings
- Nanocyl
- Nanoco Group
- Nanophase Technologies
- American Elements
- Thermo Fisher Scientific
Nanoparticle Technology Market Report Scope
This report covers engineered nanoparticles with at least one dimension at the nanoscale, together with the synthesis, dispersion, functionalisation, characterisation instrumentation and formulation services around them. Downstream devices, batteries, chips and finished drug products are excluded, which is why this figure sits well below estimates that count end products. The base year is 2025 and the forecast period runs from 2026 to 2033, valued in US$ Billion.
Material Type
- Metal and Metal Oxide Nanoparticles
- Carbon Nanomaterials
- Quantum Dots and Semiconductor Nanocrystals
- Nanoclays
- Nanocellulose
- Polymeric and Lipid Nanoparticles
Synthesis Method
- Gas-Phase Synthesis
- Chemical and Colloidal Synthesis
- Mechanical and Top-Down Methods
- Biological and Green Synthesis
Application
- Electronics and Semiconductors
- Energy Storage and Catalysis
- Coatings, Polymers and Composites
- Healthcare and Diagnostics
- Cosmetics and Personal Care
- Textiles
- Environmental Applications
Offering
- Nanomaterials
- Formulation, Dispersion and Functionalisation Services
- Characterisation Instrumentation
Regions
- North America
- Europe
- Asia Pacific
- Latin America
- Middle East & Africa
Key Questions Answered in the Report
How big is the nanoparticle technology market in 2026?
The nanoparticle technology market is valued at US$ 24.0 billion in 2026, counting nanomaterials, related services and instrumentation but excluding downstream finished products.
What is the nanoparticle technology market forecast and CAGR to 2033?
The market is projected to reach US$ 48.0 billion by 2033, growing at a 10.4% CAGR and adding US$ 24.0 billion in absolute dollar opportunity.
Which nanomaterial type holds the largest market share?
Metal and metal oxide nanoparticles lead with 44.0% share in 2026, because silica, titania, alumina and ceria are established high-volume industrial inputs.
Which nanoparticle application is growing fastest through 2033?
Energy storage and catalysis grows fastest at a 13.5% CAGR, led by conductive additives in lithium-ion electrodes and catalysts for emissions and hydrogen.
Which region leads the nanoparticle technology market and how concentrated is it?
North America leads with 35.0% share in 2026, and the market is fragmented, with different competitive sets behind each class of nanomaterial.
1. Executive Summary
1.1. Global Nanoparticle Technology Market Snapshot
1.2. Future Projections
1.3. Key Report Takeaways
1.4. Regional Snapshot
2. Market Overview
2.1. Market Definition and Report Scope
2.2. Historical Trends 2020–2025
2.3. Market Dynamics
2.3.1. Drivers
2.3.1.1. Chip and Display Manufacturing Has Turned Nanoparticles Into a Volume Purchase
2.3.1.2. Conductive Carbon Nanomaterials Have Become Standard Content in Lithium-Ion Electrodes
2.3.2. Restraints
2.3.2.1. Nanoform Registration and Unresolved Toxicology Keep Several Materials Off the Market
2.3.2.2. Dispersion and Scale-Up Economics Explain Why Nanomaterials Underperform Their Data Sheets
2.3.3. Market Opportunities
2.3.3.1. Diagnostics and Nanoparticle Drug Delivery Open a Formulation Services Revenue Pool
2.3.3.2. Catalysis for Emissions, Chemicals and Hydrogen Creates a High-Value Nanoparticle Pool
3. Global Nanoparticle Technology Market Outlook, 2020–2033
3.1. Global Nanoparticle Technology Market Outlook, by Material Type, Value (US$ Billion), 2020–2033
3.1.1. Metal and Metal Oxide Nanoparticles
3.1.2. Carbon Nanomaterials
3.1.3. Quantum Dots and Semiconductor Nanocrystals
3.1.4. Nanoclays
3.1.5. Nanocellulose
3.1.6. Polymeric and Lipid Nanoparticles
3.2. Global Nanoparticle Technology Market Outlook, by Synthesis Method, Value (US$ Billion), 2020–2033
3.2.1. Gas-Phase Synthesis
3.2.2. Chemical and Colloidal Synthesis
3.2.3. Mechanical and Top-Down Methods
3.2.4. Biological and Green Synthesis
3.3. Global Nanoparticle Technology Market Outlook, by Application, Value (US$ Billion), 2020–2033
3.3.1. Electronics and Semiconductors
3.3.2. Energy Storage and Catalysis
3.3.3. Coatings, Polymers and Composites
3.3.4. Healthcare and Diagnostics
3.3.5. Cosmetics and Personal Care
3.3.6. Textiles
3.3.7. Environmental Applications
3.4. Global Nanoparticle Technology Market Outlook, by Offering, Value (US$ Billion), 2020–2033
3.4.1. Nanomaterials
3.4.2. Formulation, Dispersion and Functionalisation Services
3.4.3. Characterisation Instrumentation
3.5. Global Nanoparticle Technology Market Outlook, by Region, Value (US$ Billion), 2020–2033
3.5.1. North America
3.5.2. Europe
3.5.3. Asia Pacific
3.5.4. Latin America
3.5.5. Middle East & Africa
4. North America Nanoparticle Technology Market Outlook, 2020–2033
4.1. North America Nanoparticle Technology Market Outlook, by Material Type, Value (US$ Billion), 2020–2033
4.1.1. Metal and Metal Oxide Nanoparticles
4.1.2. Carbon Nanomaterials
4.1.3. Quantum Dots and Semiconductor Nanocrystals
4.1.4. Nanoclays
4.1.5. Nanocellulose
4.1.6. Polymeric and Lipid Nanoparticles
4.2. North America Nanoparticle Technology Market Outlook, by Synthesis Method, Value (US$ Billion), 2020–2033
4.2.1. Gas-Phase Synthesis
4.2.2. Chemical and Colloidal Synthesis
4.2.3. Mechanical and Top-Down Methods
4.2.4. Biological and Green Synthesis
4.3. North America Nanoparticle Technology Market Outlook, by Application, Value (US$ Billion), 2020–2033
4.3.1. Electronics and Semiconductors
4.3.2. Energy Storage and Catalysis
4.3.3. Coatings, Polymers and Composites
4.3.4. Healthcare and Diagnostics
4.3.5. Cosmetics and Personal Care
4.3.6. Textiles
4.3.7. Environmental Applications
4.4. North America Nanoparticle Technology Market Outlook, by Offering, Value (US$ Billion), 2020–2033
4.4.1. Nanomaterials
4.4.2. Formulation, Dispersion and Functionalisation Services
4.4.3. Characterisation Instrumentation
4.5. North America Nanoparticle Technology Market Outlook, by Country, Value (US$ Billion), 2020–2033
4.5.1. United States Nanoparticle Technology Market Outlook, by Material Type, 2020–2033
4.5.2. United States Nanoparticle Technology Market Outlook, by Synthesis Method, 2020–2033
4.5.3. United States Nanoparticle Technology Market Outlook, by Application, 2020–2033
4.5.4. United States Nanoparticle Technology Market Outlook, by Offering, 2020–2033
4.5.5. Canada Nanoparticle Technology Market Outlook, by Material Type, 2020–2033
4.5.6. Canada Nanoparticle Technology Market Outlook, by Synthesis Method, 2020–2033
4.5.7. Canada Nanoparticle Technology Market Outlook, by Application, 2020–2033
4.5.8. Canada Nanoparticle Technology Market Outlook, by Offering, 2020–2033
5. Europe Nanoparticle Technology Market Outlook, 2020–2033
5.1. Europe Nanoparticle Technology Market Outlook, by Material Type, Value (US$ Billion), 2020–2033
5.1.1. Metal and Metal Oxide Nanoparticles
5.1.2. Carbon Nanomaterials
5.1.3. Quantum Dots and Semiconductor Nanocrystals
5.1.4. Nanoclays
5.1.5. Nanocellulose
5.1.6. Polymeric and Lipid Nanoparticles
5.2. Europe Nanoparticle Technology Market Outlook, by Synthesis Method, Value (US$ Billion), 2020–2033
5.2.1. Gas-Phase Synthesis
5.2.2. Chemical and Colloidal Synthesis
5.2.3. Mechanical and Top-Down Methods
5.2.4. Biological and Green Synthesis
5.3. Europe Nanoparticle Technology Market Outlook, by Application, Value (US$ Billion), 2020–2033
5.3.1. Electronics and Semiconductors
5.3.2. Energy Storage and Catalysis
5.3.3. Coatings, Polymers and Composites
5.3.4. Healthcare and Diagnostics
5.3.5. Cosmetics and Personal Care
5.3.6. Textiles
5.3.7. Environmental Applications
5.4. Europe Nanoparticle Technology Market Outlook, by Offering, Value (US$ Billion), 2020–2033
5.4.1. Nanomaterials
5.4.2. Formulation, Dispersion and Functionalisation Services
5.4.3. Characterisation Instrumentation
5.5. Europe Nanoparticle Technology Market Outlook, by Country, Value (US$ Billion), 2020–2033
5.5.1. Germany Nanoparticle Technology Market Outlook, by Material Type, 2020–2033
5.5.2. Germany Nanoparticle Technology Market Outlook, by Synthesis Method, 2020–2033
5.5.3. Germany Nanoparticle Technology Market Outlook, by Application, 2020–2033
5.5.4. Germany Nanoparticle Technology Market Outlook, by Offering, 2020–2033
5.5.5. France Nanoparticle Technology Market Outlook, by Material Type, 2020–2033
5.5.6. France Nanoparticle Technology Market Outlook, by Synthesis Method, 2020–2033
5.5.7. France Nanoparticle Technology Market Outlook, by Application, 2020–2033
5.5.8. France Nanoparticle Technology Market Outlook, by Offering, 2020–2033
5.5.9. United Kingdom Nanoparticle Technology Market Outlook, by Material Type, 2020–2033
5.5.10. United Kingdom Nanoparticle Technology Market Outlook, by Synthesis Method, 2020–2033
5.5.11. United Kingdom Nanoparticle Technology Market Outlook, by Application, 2020–2033
5.5.12. United Kingdom Nanoparticle Technology Market Outlook, by Offering, 2020–2033
5.5.13. Belgium Nanoparticle Technology Market Outlook, by Material Type, 2020–2033
5.5.14. Belgium Nanoparticle Technology Market Outlook, by Synthesis Method, 2020–2033
5.5.15. Belgium Nanoparticle Technology Market Outlook, by Application, 2020–2033
5.5.16. Belgium Nanoparticle Technology Market Outlook, by Offering, 2020–2033
5.5.17. Netherlands Nanoparticle Technology Market Outlook, by Material Type, 2020–2033
5.5.18. Netherlands Nanoparticle Technology Market Outlook, by Synthesis Method, 2020–2033
5.5.19. Netherlands Nanoparticle Technology Market Outlook, by Application, 2020–2033
5.5.20. Netherlands Nanoparticle Technology Market Outlook, by Offering, 2020–2033
6. Asia Pacific Nanoparticle Technology Market Outlook, 2020–2033
6.1. Asia Pacific Nanoparticle Technology Market Outlook, by Material Type, Value (US$ Billion), 2020–2033
6.1.1. Metal and Metal Oxide Nanoparticles
6.1.2. Carbon Nanomaterials
6.1.3. Quantum Dots and Semiconductor Nanocrystals
6.1.4. Nanoclays
6.1.5. Nanocellulose
6.1.6. Polymeric and Lipid Nanoparticles
6.2. Asia Pacific Nanoparticle Technology Market Outlook, by Synthesis Method, Value (US$ Billion), 2020–2033
6.2.1. Gas-Phase Synthesis
6.2.2. Chemical and Colloidal Synthesis
6.2.3. Mechanical and Top-Down Methods
6.2.4. Biological and Green Synthesis
6.3. Asia Pacific Nanoparticle Technology Market Outlook, by Application, Value (US$ Billion), 2020–2033
6.3.1. Electronics and Semiconductors
6.3.2. Energy Storage and Catalysis
6.3.3. Coatings, Polymers and Composites
6.3.4. Healthcare and Diagnostics
6.3.5. Cosmetics and Personal Care
6.3.6. Textiles
6.3.7. Environmental Applications
6.4. Asia Pacific Nanoparticle Technology Market Outlook, by Offering, Value (US$ Billion), 2020–2033
6.4.1. Nanomaterials
6.4.2. Formulation, Dispersion and Functionalisation Services
6.4.3. Characterisation Instrumentation
6.5. Asia Pacific Nanoparticle Technology Market Outlook, by Country, Value (US$ Billion), 2020–2033
6.5.1. China Nanoparticle Technology Market Outlook, by Material Type, 2020–2033
6.5.2. China Nanoparticle Technology Market Outlook, by Synthesis Method, 2020–2033
6.5.3. China Nanoparticle Technology Market Outlook, by Application, 2020–2033
6.5.4. China Nanoparticle Technology Market Outlook, by Offering, 2020–2033
6.5.5. Japan Nanoparticle Technology Market Outlook, by Material Type, 2020–2033
6.5.6. Japan Nanoparticle Technology Market Outlook, by Synthesis Method, 2020–2033
6.5.7. Japan Nanoparticle Technology Market Outlook, by Application, 2020–2033
6.5.8. Japan Nanoparticle Technology Market Outlook, by Offering, 2020–2033
6.5.9. South Korea Nanoparticle Technology Market Outlook, by Material Type, 2020–2033
6.5.10. South Korea Nanoparticle Technology Market Outlook, by Synthesis Method, 2020–2033
6.5.11. South Korea Nanoparticle Technology Market Outlook, by Application, 2020–2033
6.5.12. South Korea Nanoparticle Technology Market Outlook, by Offering, 2020–2033
6.5.13. Taiwan Nanoparticle Technology Market Outlook, by Material Type, 2020–2033
6.5.14. Taiwan Nanoparticle Technology Market Outlook, by Synthesis Method, 2020–2033
6.5.15. Taiwan Nanoparticle Technology Market Outlook, by Application, 2020–2033
6.5.16. Taiwan Nanoparticle Technology Market Outlook, by Offering, 2020–2033
6.5.17. India Nanoparticle Technology Market Outlook, by Material Type, 2020–2033
6.5.18. India Nanoparticle Technology Market Outlook, by Synthesis Method, 2020–2033
6.5.19. India Nanoparticle Technology Market Outlook, by Application, 2020–2033
6.5.20. India Nanoparticle Technology Market Outlook, by Offering, 2020–2033
7. Latin America Nanoparticle Technology Market Outlook, 2020–2033
7.1. Latin America Nanoparticle Technology Market Outlook, by Material Type, Value (US$ Billion), 2020–2033
7.1.1. Metal and Metal Oxide Nanoparticles
7.1.2. Carbon Nanomaterials
7.1.3. Quantum Dots and Semiconductor Nanocrystals
7.1.4. Nanoclays
7.1.5. Nanocellulose
7.1.6. Polymeric and Lipid Nanoparticles
7.2. Latin America Nanoparticle Technology Market Outlook, by Synthesis Method, Value (US$ Billion), 2020–2033
7.2.1. Gas-Phase Synthesis
7.2.2. Chemical and Colloidal Synthesis
7.2.3. Mechanical and Top-Down Methods
7.2.4. Biological and Green Synthesis
7.3. Latin America Nanoparticle Technology Market Outlook, by Application, Value (US$ Billion), 2020–2033
7.3.1. Electronics and Semiconductors
7.3.2. Energy Storage and Catalysis
7.3.3. Coatings, Polymers and Composites
7.3.4. Healthcare and Diagnostics
7.3.5. Cosmetics and Personal Care
7.3.6. Textiles
7.3.7. Environmental Applications
7.4. Latin America Nanoparticle Technology Market Outlook, by Offering, Value (US$ Billion), 2020–2033
7.4.1. Nanomaterials
7.4.2. Formulation, Dispersion and Functionalisation Services
7.4.3. Characterisation Instrumentation
7.5. Latin America Nanoparticle Technology Market Outlook, by Country, Value (US$ Billion), 2020–2033
7.5.1. Brazil Nanoparticle Technology Market Outlook, by Material Type, 2020–2033
7.5.2. Brazil Nanoparticle Technology Market Outlook, by Synthesis Method, 2020–2033
7.5.3. Brazil Nanoparticle Technology Market Outlook, by Application, 2020–2033
7.5.4. Brazil Nanoparticle Technology Market Outlook, by Offering, 2020–2033
7.5.5. Mexico Nanoparticle Technology Market Outlook, by Material Type, 2020–2033
7.5.6. Mexico Nanoparticle Technology Market Outlook, by Synthesis Method, 2020–2033
7.5.7. Mexico Nanoparticle Technology Market Outlook, by Application, 2020–2033
7.5.8. Mexico Nanoparticle Technology Market Outlook, by Offering, 2020–2033
7.5.9. Argentina Nanoparticle Technology Market Outlook, by Material Type, 2020–2033
7.5.10. Argentina Nanoparticle Technology Market Outlook, by Synthesis Method, 2020–2033
7.5.11. Argentina Nanoparticle Technology Market Outlook, by Application, 2020–2033
7.5.12. Argentina Nanoparticle Technology Market Outlook, by Offering, 2020–2033
7.5.13. Chile Nanoparticle Technology Market Outlook, by Material Type, 2020–2033
7.5.14. Chile Nanoparticle Technology Market Outlook, by Synthesis Method, 2020–2033
7.5.15. Chile Nanoparticle Technology Market Outlook, by Application, 2020–2033
7.5.16. Chile Nanoparticle Technology Market Outlook, by Offering, 2020–2033
7.5.17. Colombia Nanoparticle Technology Market Outlook, by Material Type, 2020–2033
7.5.18. Colombia Nanoparticle Technology Market Outlook, by Synthesis Method, 2020–2033
7.5.19. Colombia Nanoparticle Technology Market Outlook, by Application, 2020–2033
7.5.20. Colombia Nanoparticle Technology Market Outlook, by Offering, 2020–2033
8. Middle East & Africa Nanoparticle Technology Market Outlook, 2020–2033
8.1. Middle East & Africa Nanoparticle Technology Market Outlook, by Material Type, Value (US$ Billion), 2020–2033
8.1.1. Metal and Metal Oxide Nanoparticles
8.1.2. Carbon Nanomaterials
8.1.3. Quantum Dots and Semiconductor Nanocrystals
8.1.4. Nanoclays
8.1.5. Nanocellulose
8.1.6. Polymeric and Lipid Nanoparticles
8.2. Middle East & Africa Nanoparticle Technology Market Outlook, by Synthesis Method, Value (US$ Billion), 2020–2033
8.2.1. Gas-Phase Synthesis
8.2.2. Chemical and Colloidal Synthesis
8.2.3. Mechanical and Top-Down Methods
8.2.4. Biological and Green Synthesis
8.3. Middle East & Africa Nanoparticle Technology Market Outlook, by Application, Value (US$ Billion), 2020–2033
8.3.1. Electronics and Semiconductors
8.3.2. Energy Storage and Catalysis
8.3.3. Coatings, Polymers and Composites
8.3.4. Healthcare and Diagnostics
8.3.5. Cosmetics and Personal Care
8.3.6. Textiles
8.3.7. Environmental Applications
8.4. Middle East & Africa Nanoparticle Technology Market Outlook, by Offering, Value (US$ Billion), 2020–2033
8.4.1. Nanomaterials
8.4.2. Formulation, Dispersion and Functionalisation Services
8.4.3. Characterisation Instrumentation
8.5. Middle East & Africa Nanoparticle Technology Market Outlook, by Country, Value (US$ Billion), 2020–2033
8.5.1. Saudi Arabia Nanoparticle Technology Market Outlook, by Material Type, 2020–2033
8.5.2. Saudi Arabia Nanoparticle Technology Market Outlook, by Synthesis Method, 2020–2033
8.5.3. Saudi Arabia Nanoparticle Technology Market Outlook, by Application, 2020–2033
8.5.4. Saudi Arabia Nanoparticle Technology Market Outlook, by Offering, 2020–2033
8.5.5. United Arab Emirates Nanoparticle Technology Market Outlook, by Material Type, 2020–2033
8.5.6. United Arab Emirates Nanoparticle Technology Market Outlook, by Synthesis Method, 2020–2033
8.5.7. United Arab Emirates Nanoparticle Technology Market Outlook, by Application, 2020–2033
8.5.8. United Arab Emirates Nanoparticle Technology Market Outlook, by Offering, 2020–2033
8.5.9. Israel Nanoparticle Technology Market Outlook, by Material Type, 2020–2033
8.5.10. Israel Nanoparticle Technology Market Outlook, by Synthesis Method, 2020–2033
8.5.11. Israel Nanoparticle Technology Market Outlook, by Application, 2020–2033
8.5.12. Israel Nanoparticle Technology Market Outlook, by Offering, 2020–2033
8.5.13. Egypt Nanoparticle Technology Market Outlook, by Material Type, 2020–2033
8.5.14. Egypt Nanoparticle Technology Market Outlook, by Synthesis Method, 2020–2033
8.5.15. Egypt Nanoparticle Technology Market Outlook, by Application, 2020–2033
8.5.16. Egypt Nanoparticle Technology Market Outlook, by Offering, 2020–2033
8.5.17. South Africa Nanoparticle Technology Market Outlook, by Material Type, 2020–2033
8.5.18. South Africa Nanoparticle Technology Market Outlook, by Synthesis Method, 2020–2033
8.5.19. South Africa Nanoparticle Technology Market Outlook, by Application, 2020–2033
8.5.20. South Africa Nanoparticle Technology Market Outlook, by Offering, 2020–2033
9. Competitive Landscape
9.1. Market Concentration and Industry Leaders
9.2. Competitive Differentiation
9.3. Strategic Moves and Market Direction
9.4. Recent Industry Developments
9.5. Company Profiles
9.5.1. Evonik Industries
9.5.2. Cabot Corporation
9.5.3. BASF
9.5.4. Merck KGaA
9.5.5. Arkema
9.5.6. Nouryon
9.5.7. Zeon Corporation
9.5.8. LG Chem
9.5.9. Resonac Holdings
9.5.10. Nanocyl
9.5.11. Nanoco Group
9.5.12. Nanophase Technologies
9.5.13. American Elements
9.5.14. Thermo Fisher Scientific
10. Appendix
10.1. Research Methodology
10.2. Report Assumptions
10.3. Acronyms and Abbreviations
| Material Type | Metal and Metal Oxide Nanoparticles, Carbon Nanomaterials, Quantum Dots and Semiconductor Nanocrystals, Nanoclays, Nanocellulose, Polymeric and Lipid Nanoparticles |
| Synthesis Method | Gas-Phase Synthesis, Chemical and Colloidal Synthesis, Mechanical and Top-Down Methods, Biological and Green Synthesis |
| Application | Electronics and Semiconductors, Energy Storage and Catalysis, Coatings, Polymers and Composites, Healthcare and Diagnostics, Cosmetics and Personal Care, Textiles, Environmental Applications |
| Offering | Nanomaterials, Formulation, Dispersion and Functionalisation Services, Characterisation Instrumentation |
| Regions | North America, Europe, Asia Pacific, Latin America, Middle East & Africa |
Our Research Methodology
Considering the volatility of business today, traditional approaches to strategizing a game plan can be unfruitful if not detrimental. True ambiguity is no way to determine a forecast. A myriad of predetermined factors must be accounted for such as the degree of risk involved, the magnitude of circumstances, as well as conditions or consequences that are not known or unpredictable. To circumvent binary views that cast uncertainty, the application of market research intelligence to strategically posture, move, and enable actionable outcomes is necessary.
View Methodology
Quality Assured
Rigorous Validation Process

Confidentiality Assured
End-to-end Data Security

Custom Research Services
Tailored To Your Objectives
FAQs
The nanoparticle technology market is valued at US$ 24.0 billion in 2026, counting nanomaterials, related services and instrumentation but excluding downstream finished products.
The market is projected to reach US$ 48.0 billion by 2033, growing at a 10.4% CAGR and adding US$ 24.0 billion in absolute dollar opportunity.
Metal and metal oxide nanoparticles lead with 44.0% share in 2026, because silica, titania, alumina and ceria are established high-volume industrial inputs.
Energy storage and catalysis grows fastest at a 13.5% CAGR, led by conductive additives in lithium-ion electrodes and catalysts for emissions and hydrogen.
North America leads with 35.0% share in 2026, and the market is fragmented, with different competitive sets behind each class of nanomaterial.
Related Reports
Ultra high Molecular Weight Polyethylene Market Size, Share, Insights, Competitive Landscape, and Forecast 2026 to 2033
Explore the UHMWPE market, forecast to reach US$4.8 billion by 2033 at 7.5% CAGR, with insights into grades, applications, regions and leading companies.
Steel Drums & IBCs Market Size, Share, Insights, Competitive Landscape, and Forecast 2026 to 2033
Explore the steel drums & IBCs market, projected to reach US$29.8 billion by 2033 at 4.8% CAGR, with segment, regional and competitive insights.
Semiconductor Gases Market Size, Share, Insights, Competitive Landscape, and Forecast 2026 to 2033
The semiconductor gases market is projected to grow from US$9.6 billion in 2026 to US$16.8 billion by 2033, at an 8.3% CAGR. Explore segments and trends.
Non-load Bearing Walls Market Size, Share, Insights, Competitive Landscape, and Forecast 2026 to 2033
The non-load bearing walls market is projected to grow from US$96.0 billion in 2026 to US$136.0 billion by 2033, at a 5.1% CAGR. Explore key trends.
Expanded PTFE (ePTFE) Market Size, Share, Insights, Competitive Landscape, and Forecast 2026 to 2033
The expanded PTFE market is projected to grow from US$2.4 billion in 2026 to US$3.8 billion by 2033, at a 6.8% CAGR. Explore segments and regional trends.
Ethylene Dichloride Market Size, Share, Insights, Competitive Landscape, and Forecast 2026 to 2033
The ethylene dichloride market is projected to grow from US$24.5 billion in 2026 to US$31.0 billion by 2033, at a 3.4% CAGR. Explore segments and regions.