



Steel Drums & IBCs Market
Steel Drums & IBCs Market Size, Share, Insights, Competitive Landscape, and Forecast 2026 to 2033
Steel Drums & IBCs Market Size and Trend Analysis
How Fast Will the Steel Drums and IBCs Market Grow?
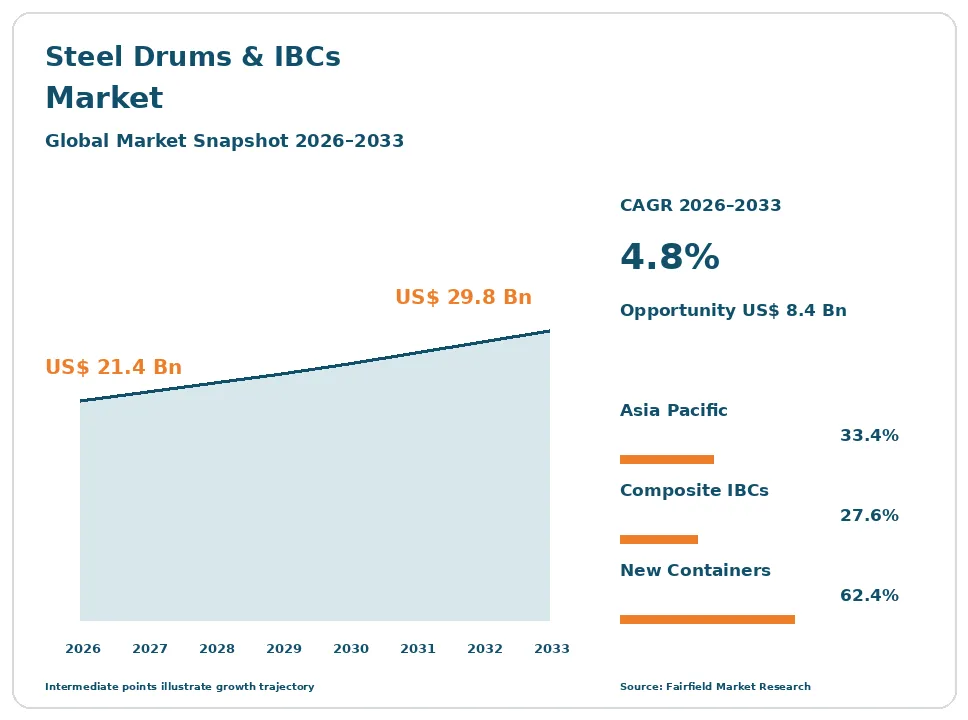
The global steel drums & IBCs market size is expected to be valued at US$ 21.4 billion in 2026 and projected to reach US$ 29.8 billion by 2033, growing at a CAGR of 4.8% between 2026 and 2033.
Between 2020 and 2025 the market advanced at roughly 3.6% a year, held back by a soft chemical production cycle and by steel price swings that delayed fleet replacement. Composite intermediate bulk containers keep taking bulk liquid volume from drums, and each one carries a higher unit value than the five drums it displaces. Reconditioning and container management are being priced as recurring service contracts rather than scrap transactions, which raises the revenue captured per container over its working life. Chemical, lubricant and agrochemical plants continue to be built close to demand in Asia and the Gulf, and certified rigid packaging demand follows directly. The direction is modest volume growth with a pronounced mix shift toward larger, reusable, service-wrapped containers.
Key Report Takeaways
- By Product Type: Composite intermediate bulk containers held 27.6% share in 2026, while stainless steel intermediate bulk containers are projected to expand at a 6.5% CAGR through 2033, driven by pharmaceutical and food ingredient users needing cleanable, long-life assets.
- By Capacity: The 201–500 litre band held 38.2% share in 2026, while containers above 500 litres are projected to grow at a 5.9% CAGR through 2033, driven by handling cost per litre favouring single-trip-equivalent bulk units.
- By End Use: Chemicals and petrochemicals held 34.5% share in 2026, while pharmaceuticals is projected to expand at a 6.8% CAGR through 2033, driven by documented cleaning validation and traceability requirements on container reuse.
- By Offering: New containers held 62.4% share in 2026, while container management and leasing services are projected to advance at a 7.4% CAGR through 2033, driven by fillers outsourcing collection, washing and retest administration.
- By Geography: Asia Pacific held 33.4% share in 2026, while Middle East & Africa is projected to post a 6.4% CAGR through 2033, driven by Gulf petrochemical and lubricant capacity shipping product in certified rigid packaging.
Global Steel Drums & IBCs Market Trends and Insights
Drivers Impact Analysis
| Driver | Impact on CAGR Forecast | Geographic Relevance | Impact Timeline |
| UN certification requirements confining dangerous goods to tested containers | High | Global | Long term (≥4 years) |
| Composite IBC handling economics displacing drum volume | High | Asia Pacific, Europe, North America | Medium term (2–4 years) |
Two forces account for most of the value added to rigid industrial packaging through 2033.
UN Certification Makes the Tested Container the Only Legal Option for Dangerous Goods
Certification is this product’s licence to exist, and it is the single biggest reason the market holds value. A container used for dangerous goods must carry a United Nations mark earned through drop, stack, leakproof and hydraulic pressure testing of a design type. Without that mark the container cannot legally be filled, carried or exported, so a chemical shipper has no cheap informal alternative and must buy from a certified manufacturer or a certified reconditioner.
The mechanism is enforcement at the point of carriage. The UN Recommendations on the Transport of Dangerous Goods Model Regulations set the design-type test regime, and it is written into ADR in Europe and into 49 CFR by the US Department of Transportation. Intermediate bulk containers additionally require periodic inspection and retesting at fixed intervals, and a reconditioned container must be re-marked and re-tested. Compliance cost therefore protects the certified fleet.
Composite IBC Handling Economics Pull Bulk Liquid Volume Away From Steel Drums
Handling cost per litre, not purchase price, is moving liquid volume into composite intermediate bulk containers. One thousand litres arriving as a single caged bottle replaces five drums, and that means one forklift movement instead of five, one connection instead of five decants, and far less spillage and residue loss at the filling line. For a lubricant blender or a resin user, labour and downtime savings repay the higher unit price quickly.
The mechanism is visible in plant design. Composite containers stack on standard footprints, discharge through a bottom valve without tipping, and fit automated filling lines more easily than a drum that must be handled upright and decanted. Warehouse cube is used better, and residual heel losses fall. Because the steel cage and pallet outlive several inner bottles, the economics improve further when the cage re-enters a reconditioning loop rather than being scrapped.
Restraints Impact Analysis
| Restraint | Impact on CAGR Forecast | Geographic Relevance | Impact Timeline |
| Steel and resin price volatility passing through a low-margin product | High | Global | Short term (≤2 years) |
| Reconditioned supply, flexible formats and empty container freight cost | Medium | Europe, North America, Asia Pacific | Medium term (2–4 years) |
Two structural pressures sit on pricing power and on new container volumes.
Steel and Resin Price Swings Pass Straight Through Thin Industrial Packaging Margins
Raw material cost dominates the economics of a drum or an intermediate bulk container, and producers control very little of it. Cold-rolled steel coil accounts for the bulk of a steel drum’s cost, and high-density polyethylene resin does the same for a plastic drum or a composite inner bottle. Conversion adds modest value on top, so a coil or resin spike that cannot be repriced within a quarter removes most of the margin on a supply contract.
The cause is that both inputs are traded commodities priced by forces outside packaging. Steel follows iron ore, scrap, energy and trade measures including import duties and safeguard quotas. Polyethylene follows naphtha and ethane cracking economics. Industrial customers negotiate annually against index formulas and resist mid-year increases, and the chemical production cycle that sets fill volumes often turns down at the same time input costs rise.
Reconditioned Supply and Empty Container Freight Hold Down New Drum Demand
This is a circular business, and that circularity directly limits new container sales. A steel drum or an IBC cage is routinely collected, washed, repaired, re-tested and sold again at a fraction of the new price. Because a reconditioned unit carries a valid certification mark, it competes head-on with a new one. New container demand is therefore a function of fleet losses and net fleet growth, not of total fills, and reconditioners are simultaneously customers and competitors of manufacturers.
Freight compounds the limit. An empty container is mostly air, so shipping it any distance is expensive relative to its value, which keeps manufacturing and reconditioning regional and prevents low-cost producers from exporting their advantage. At the low end, flexible intermediate bulk containers and bag-in-box formats take share from rigid packaging wherever hazard classification permits.
Market Opportunities
Container Management and Leasing Services Build a Recurring Revenue Layer
Container management is the most attractive revenue pool in this industry, because it converts a one-off product sale into a contracted service annuity. Instead of selling a drum and losing contact with it, a provider leases a fleet, collects empties from the filler’s customers, washes and repairs them, administers periodic inspection and retest records, and bills per trip. Margins are steadier than on new container manufacture, and the customer relationship becomes difficult to displace.
Chemical companies, lubricant blenders and food ingredient suppliers create the demand, because they want the asset and the compliance paperwork off their own books. Digital identification is what makes it workable at scale: serialised barcodes and radio frequency tags on cages and drums let a provider prove chain of custody, schedule retests before they fall due, and bill accurately. Providers with dense regional depot networks capture this pool first.
Reuse and Recycled-Content Rules Create a Certified Sustainable Container Pool
Packaging regulation is opening a premium pool for containers that can document reuse cycles and recycled content. Buyers subject to reporting duties increasingly ask suppliers for packaging that counts toward reuse targets and carries verified recycled polymer or steel content, and they will pay a differential for documentation they can audit. That turns an environmental attribute into a specified product characteristic with its own price, rather than a marketing claim attached to a commodity container.
The EU Packaging and Packaging Waste framework drives this most directly, setting recovery obligations and pushing reuse and recycled-content requirements onto industrial as well as consumer packaging. Chemical and coatings customers with corporate reporting commitments create the pull. Manufacturers and reconditioners holding verified reuse cycle data, recycled resin supply agreements and food contact and good manufacturing practice documentation are best placed to convert the requirement into revenue.
Segment Analysis
By Product Type: Composite IBCs Lead the Mix While Stainless Steel Units Grow Quickest
Composite intermediate bulk containers led with 27.6% share in 2026, because a blow-moulded inner bottle in a welded steel cage delivers one thousand litres at the lowest cost per litre of any certified rigid format. Tight-head steel drums followed at 21.4%, the default for solvents, resins and flammable liquids, with open-head steel drums at 15.8% for pastes, powders and semi-solids. Plastic drums took 14.2%, rigid plastic intermediate bulk containers 9.5%, and closures, liners and fittings 7.1%.
Stainless steel intermediate bulk containers hold 4.4% share and grow fastest at a 6.5% CAGR through 2033. They cost far more initially but survive hundreds of cleaning cycles, which suits pharmaceutical intermediates, flavours and high-value food ingredients where cleaning validation matters. The implication is that the fastest value growth sits in assets designed to be owned and circulated rather than sold once.
By Capacity: The 200 Litre Drum Band Dominates as Bulk Units Above 500 Litres Advance
The 201–500 litre band held 38.2% share in 2026, reflecting the enduring position of the two hundred litre drum as the standard trading unit for chemicals, lubricants and coatings. Pallet dimensions, warehouse racking, filling line design and dangerous goods documentation have all been built around it for decades. Smaller formats of 51–200 litres took 14.9% for specialty chemicals and laboratory volumes, and containers up to 50 litres accounted for 11.3%, mostly pails and small drums.
Containers above 500 litres hold 35.6% share and grow fastest at a 5.9% CAGR through 2033. This band is essentially the intermediate bulk container, and it advances because handling, storage and decanting costs per litre fall sharply at that size. For manufacturers the consequence is a steady reallocation of steel and resin tonnage from drum lines to cage and bottle production.
By End Use: Chemicals Anchor Volume While Pharmaceuticals Expand Fastest
Chemicals and petrochemicals consumed 34.5% of rigid industrial packaging in 2026, a share no other sector approaches, because solvents, intermediates, surfactants and specialty chemicals move almost entirely in certified drums and intermediate bulk containers. Lubricants and oils followed at 17.2%, paints, coatings and inks at 13.6%, and agrochemicals at 12.4%, where REACH registration data and chemical compatibility testing govern which container a formulation may enter. Food and beverage ingredients took 11.8% and other industrial uses 4.2%.
Pharmaceuticals, at 6.3% share, grows fastest at a 6.8% CAGR through 2033. Active ingredient and excipient shipments demand documented cleaning validation, material traceability and good manufacturing practice compliant handling, which pushes buyers toward stainless steel and dedicated liner systems. The business implication is that container suppliers increasingly sell audit evidence alongside hardware.
By Offering: New Containers Still Lead While Management Services Grow Fastest
New containers accounted for 62.4% of market value in 2026, because fleet losses, damage write-offs, dedicated single-use applications and net demand growth all have to be met with newly manufactured units. Many hazardous and food contact applications also prohibit reuse for specific product groups, which preserves a floor under new container volumes regardless of how efficient the collection loop becomes.
Reconditioned and refurbished containers held 26.8%, a substantial share that explains why new demand tracks fleet attrition rather than total fills. Container management and leasing services, at 10.8%, grow fastest at a 7.4% CAGR through 2033, as fillers hand over collection, washing, repair, retest administration and fleet tracking to specialists. For the industry this is the clearest structural change: the revenue model shifts from selling steel and resin toward charging for the use of a circulating asset.
Geography Analysis
North America Runs a Mature Fleet Under Federal Dangerous Goods Rules
North America held 26.5% share in 2026 and grows at 4.0% a year to 2033, the second slowest of the five regions. The United States dominates, with Canada and Mexico adding chemical, lubricant and agrochemical filling capacity. A dense network of reconditioning plants and drum collection routes already covers the main industrial corridors, so most incremental demand is replacement rather than fleet building.
Regulation is the organising force. The US Department of Transportation sets packaging, marking and retest requirements under 49 CFR, and enforcement at the point of carriage keeps uncertified containers out of the dangerous goods chain. Petrochemical expansion along the Gulf coast remains the main source of new fill volume. The clearest opportunity is leasing and container management contracts, which large chemical buyers increasingly prefer to owning and administering their own fleets.
Europe Leads on Reuse Obligations and Certified Reconditioning Depth
Europe accounted for 25.0% of global demand in 2026 and grows at 3.5% through 2033, the slowest regional rate, reflecting a mature chemical sector and flat industrial output. Germany, France, Italy, the Netherlands, Belgium and Poland account for most consumption, supported by the highest density of certified reconditioning capacity anywhere and by cross-border collection networks that move empties efficiently between filling sites.
Regulatory intensity shapes product design more than volume growth. ADR governs road carriage of dangerous goods, packaging waste rules push reuse and recycled content, and REACH obligations determine labelling and compatibility for filled containers. Energy and steel cost relative to other producing regions is the main barrier, squeezing commodity drum margins. The opportunity lies in documented reuse cycles and verified recycled content, which regional buyers are beginning to specify and pay for.
Which Region Is Leading the Steel Drums and IBCs Market?
Asia Pacific is leading the steel drums & IBCs market, with 33.4% share in 2026 and a 5.8% CAGR to 2033, the largest absolute growth of any region. China and India supply and consume the greatest volumes, with Japan, Korea, Indonesia, Vietnam and Thailand adding steadily. Scale follows chemical capacity: the region hosts most of the world’s new petrochemical, agrochemical and specialty chemical plants, and every tonne filled into drummed or bulk packaging generates container demand.
The structure differs from older markets. Reconditioning is less consolidated and collection rates are lower, so a larger proportion of demand is met with new containers than in mature regions. National adoption of United Nations packaging certification has tightened steadily, which is pushing informal operators out and formalising the fleet. The change to watch is reconditioning networks professionalising around the largest industrial clusters.
Latin America Grows on Agrochemical and Lubricant Filling Demand
Latin America represented 7.6% share in 2026 and grows at 5.0% to 2033, ahead of the mature regions. Brazil and Mexico account for most consumption, with Argentina, Colombia and Chile contributing. Agrochemical packaging is unusually important here because of the scale of row crop agriculture, and lubricant and industrial chemical filling adds steady drum and intermediate bulk container volume around the main ports and industrial zones.
Barriers are real. Currency volatility makes dollar-priced steel and resin purchases unpredictable, inland logistics costs are high, and enforcement of dangerous goods packaging rules varies between national jurisdictions. Collection infrastructure for empties is patchy outside the largest industrial centres. The opportunity is formalised reconditioning: as agrochemical container stewardship schemes mature and certification is enforced more consistently, certified refurbishment capacity becomes a defensible regional business.
Which Region Is Growing Fastest in the Steel Drums and IBCs Market?
Middle East & Africa is growing fastest in the steel drums & IBCs market, at a 6.4% CAGR through 2033 from 7.5% share in 2026, the smallest base of the five regions. Saudi Arabia, the United Arab Emirates, Egypt, Nigeria and South Africa drive most of the increase. Gulf petrochemical, lubricant and specialty chemical capacity has expanded substantially, and much of that output ships in certified rigid packaging to customers who buy in drum and bulk container quantities.
Two causes explain the pace. Downstream diversification programmes are deliberately moving Gulf economies from exporting crude toward exporting packaged chemical products. Separately, industrial and agricultural chemical consumption across African markets is rising from a low base. Barriers include limited local reconditioning capacity, uneven certification enforcement and reliance on imported steel. The change underway is container manufacturing being localised alongside new chemical complexes.
Competitive Landscape
The steel drums & IBCs market is moderately concentrated globally and fragmented regionally, a structure dictated by freight. Several large groups operate multi-continent plant networks and hold the leading global positions, yet in any individual country a regional manufacturer or an independent reconditioner can hold meaningful share simply by sitting closer to the filling site. Shipping empty containers is expensive relative to their value, so a plant’s economic radius is short and national markets stay contestable. Consolidation has proceeded by acquiring regional plants, reconditioning depots and collection networks rather than by building export scale.
Competition runs on four things. Certification and compliance capability comes first, because a manufacturer that cannot hold design-type approvals and retest records has no product. Network density is second: whoever has depots near the fillers wins the collection and reconditioning economics. Raw material purchasing power is third, since steel coil and polyethylene dominate cost and scale buyers survive price spikes better. Service breadth completes the set, as buyers increasingly want fleet tracking, retest administration and cleaning validation documentation bundled with the container.
Strategic activity concentrates on the service layer rather than on new manufacturing capacity. Producers are acquiring or building reconditioning and washing operations, adding serialised identification to returnable fleets, and offering leasing contracts that keep the asset on the supplier’s balance sheet. The relationship with independent reconditioners is deliberately ambiguous, since they are at once a customer for new cages and bottles and a competitor for the refill sale.
The broad direction is a shift from selling a container to managing a circulating fleet, where certification records, depot coverage and tracking data create the switching cost that a steel drum alone never could.
Steel Drums & IBCs Industry Leaders
- Greif, Inc.
- Mauser Packaging Solutions
- Schütz GmbH & Co. KGaA
- Time Technoplast Limited
- THIELMANN Group
Recent Industry Developments
- December 1994: The European Union adopted its Packaging and Packaging Waste directive, setting recovery and recycling targets and essential requirements covering reusable packaging – it gave industrial container reuse and reconditioning schemes their first common legal basis across member states.
- June 2007: REACH entered into force in the European Union, requiring registration of substances and safety information to travel with them – it fixed the labelling, compatibility and documentation obligations that follow a filled drum or intermediate bulk container through the supply chain.
- January 2025: The 2025 edition of ADR, the European agreement on international carriage of dangerous goods by road, entered into force – its biennial updates to packaging, marking and periodic inspection provisions set the compliance baseline for every certified container sold in the region.
- February 2025: The European Union Packaging and Packaging Waste regulation entered into force, replacing the earlier directive with directly applicable rules – it moves reuse targets and recycled content obligations from national transposition to uniform requirements, raising the value of documented reuse cycles.
Companies Covered in the Report
- Greif, Inc.
- Mauser Packaging Solutions
- Schütz GmbH & Co. KGaA
- Time Technoplast Limited
- Balmer Lawrie & Co. Ltd.
- THIELMANN Group
- Hoover Ferguson Group, Inc.
- WERIT Kunststoffwerke W. Schneider GmbH & Co. KG
- JFE Container Co., Ltd.
- Snyder Industries, LLC
- Pyramid Technoplast Limited
- Great Western Containers Inc.
Steel Drums & IBCs Market Report Scope
This report covers rigid industrial packaging for bulk liquids, powders and semi-solids: tight-head and open-head steel drums, plastic drums, composite, rigid plastic and stainless steel intermediate bulk containers, their closures, liners and fittings, and the reconditioning, washing and container management services sold alongside them. Flexible packaging, small consumer containers and bulk road or rail tanks are excluded. The base year is 2025, the forecast period 2026 to 2033, in US$ Billion.
Product Type
- Tight-head Steel Drums
- Open-head Steel Drums
- Plastic Drums
- Composite Intermediate Bulk Containers
- Rigid Plastic Intermediate Bulk Containers
- Stainless Steel Intermediate Bulk Containers
- Closures, Liners and Fittings
Capacity
- Up to 50 Litres
- 51–200 Litres
- 201–500 Litres
- Above 500 Litres
End Use
- Chemicals and Petrochemicals
- Lubricants and Oils
- Paints, Coatings and Inks
- Agrochemicals
- Food and Beverage Ingredients
- Pharmaceuticals
- Other Industrial
Offering
- New Containers
- Reconditioned and Refurbished Containers
- Container Management and Leasing Services
Regions
- North America
- Europe
- Asia Pacific
- Latin America
- Middle East & Africa
Key Questions Answered in the Report
How big is the steel drums and IBCs market in 2026?
The global steel drums & IBCs market is valued at US$ 21.4 billion in 2026, covering new containers, reconditioned units and container management services worldwide.
What is the forecast size and CAGR of the steel drums and IBCs market by 2033?
The market is projected to reach US$ 29.8 billion by 2033, growing at a 4.8% CAGR and adding an absolute opportunity of US$ 8.4 billion.
Which product type leads the steel drums and IBCs market?
Composite intermediate bulk containers lead with 27.6% share in 2026, because a caged bottle delivers one thousand litres at the lowest certified cost per litre.
Which segment and region are growing fastest in the steel drums and IBCs market?
Container management and leasing services grow fastest at 7.4%, and Middle East & Africa is the quickest region at a 6.4% CAGR.
Which region holds the largest steel drums and IBCs market share?
Asia Pacific holds the largest share at 33.4% in 2026, supported by its concentration of new petrochemical, agrochemical and specialty chemical filling capacity.
1. Executive Summary
1.1. Global Steel Drums & IBCs Market Snapshot
1.2. Future Projections
1.3. Key Report Takeaways
1.4. Regional Snapshot
2. Market Overview
2.1. Market Definition and Report Scope
2.2. Historical Trends 2020–2025
2.3. Market Dynamics
2.3.1. Drivers
2.3.1.1. UN Certification Makes the Tested Container the Only Legal Option for Dangerous Goods
2.3.1.2. Composite IBC Handling Economics Pull Bulk Liquid Volume Away From Steel Drums
2.3.2. Restraints
2.3.2.1. Steel and Resin Price Swings Pass Straight Through Thin Industrial Packaging Margins
2.3.2.2. Reconditioned Supply and Empty Container Freight Hold Down New Drum Demand
2.3.3. Market Opportunities
2.3.3.1. Container Management and Leasing Services Build a Recurring Revenue Layer
2.3.3.2. Reuse and Recycled-Content Rules Create a Certified Sustainable Container Pool
3. Global Steel Drums & IBCs Market Outlook, 2020–2033
3.1. Global Steel Drums & IBCs Market Outlook, by Product Type, Value (US$ Billion), 2020–2033
3.1.1. Tight-head Steel Drums
3.1.2. Open-head Steel Drums
3.1.3. Plastic Drums
3.1.4. Composite Intermediate Bulk Containers
3.1.5. Rigid Plastic Intermediate Bulk Containers
3.1.6. Stainless Steel Intermediate Bulk Containers
3.1.7. Closures, Liners and Fittings
3.2. Global Steel Drums & IBCs Market Outlook, by Capacity, Value (US$ Billion), 2020–2033
3.2.1. Up to 50 Litres
3.2.2. 51–200 Litres
3.2.3. 201–500 Litres
3.2.4. Above 500 Litres
3.3. Global Steel Drums & IBCs Market Outlook, by End Use, Value (US$ Billion), 2020–2033
3.3.1. Chemicals and Petrochemicals
3.3.2. Lubricants and Oils
3.3.3. Paints, Coatings and Inks
3.3.4. Agrochemicals
3.3.5. Food and Beverage Ingredients
3.3.6. Pharmaceuticals
3.3.7. Other Industrial
3.4. Global Steel Drums & IBCs Market Outlook, by Offering, Value (US$ Billion), 2020–2033
3.4.1. New Containers
3.4.2. Reconditioned and Refurbished Containers
3.4.3. Container Management and Leasing Services
3.5. Global Steel Drums & IBCs Market Outlook, by Region, Value (US$ Billion), 2020–2033
3.5.1. North America
3.5.2. Europe
3.5.3. Asia Pacific
3.5.4. Latin America
3.5.5. Middle East & Africa
4. North America Steel Drums & IBCs Market Outlook, 2020–2033
4.1. North America Steel Drums & IBCs Market Outlook, by Product Type, Value (US$ Billion), 2020–2033
4.1.1. Tight-head Steel Drums
4.1.2. Open-head Steel Drums
4.1.3. Plastic Drums
4.1.4. Composite Intermediate Bulk Containers
4.1.5. Rigid Plastic Intermediate Bulk Containers
4.1.6. Stainless Steel Intermediate Bulk Containers
4.1.7. Closures, Liners and Fittings
4.2. North America Steel Drums & IBCs Market Outlook, by Capacity, Value (US$ Billion), 2020–2033
4.2.1. Up to 50 Litres
4.2.2. 51–200 Litres
4.2.3. 201–500 Litres
4.2.4. Above 500 Litres
4.3. North America Steel Drums & IBCs Market Outlook, by End Use, Value (US$ Billion), 2020–2033
4.3.1. Chemicals and Petrochemicals
4.3.2. Lubricants and Oils
4.3.3. Paints, Coatings and Inks
4.3.4. Agrochemicals
4.3.5. Food and Beverage Ingredients
4.3.6. Pharmaceuticals
4.3.7. Other Industrial
4.4. North America Steel Drums & IBCs Market Outlook, by Offering, Value (US$ Billion), 2020–2033
4.4.1. New Containers
4.4.2. Reconditioned and Refurbished Containers
4.4.3. Container Management and Leasing Services
4.5. North America Steel Drums & IBCs Market Outlook, by Country, Value (US$ Billion), 2020–2033
4.5.1. United States Steel Drums & IBCs Market Outlook, by Product Type, 2020–2033
4.5.2. United States Steel Drums & IBCs Market Outlook, by Capacity, 2020–2033
4.5.3. United States Steel Drums & IBCs Market Outlook, by End Use, 2020–2033
4.5.4. United States Steel Drums & IBCs Market Outlook, by Offering, 2020–2033
4.5.5. Canada Steel Drums & IBCs Market Outlook, by Product Type, 2020–2033
4.5.6. Canada Steel Drums & IBCs Market Outlook, by Capacity, 2020–2033
4.5.7. Canada Steel Drums & IBCs Market Outlook, by End Use, 2020–2033
4.5.8. Canada Steel Drums & IBCs Market Outlook, by Offering, 2020–2033
4.5.9. Mexico Steel Drums & IBCs Market Outlook, by Product Type, 2020–2033
4.5.10. Mexico Steel Drums & IBCs Market Outlook, by Capacity, 2020–2033
4.5.11. Mexico Steel Drums & IBCs Market Outlook, by End Use, 2020–2033
4.5.12. Mexico Steel Drums & IBCs Market Outlook, by Offering, 2020–2033
5. Europe Steel Drums & IBCs Market Outlook, 2020–2033
5.1. Europe Steel Drums & IBCs Market Outlook, by Product Type, Value (US$ Billion), 2020–2033
5.1.1. Tight-head Steel Drums
5.1.2. Open-head Steel Drums
5.1.3. Plastic Drums
5.1.4. Composite Intermediate Bulk Containers
5.1.5. Rigid Plastic Intermediate Bulk Containers
5.1.6. Stainless Steel Intermediate Bulk Containers
5.1.7. Closures, Liners and Fittings
5.2. Europe Steel Drums & IBCs Market Outlook, by Capacity, Value (US$ Billion), 2020–2033
5.2.1. Up to 50 Litres
5.2.2. 51–200 Litres
5.2.3. 201–500 Litres
5.2.4. Above 500 Litres
5.3. Europe Steel Drums & IBCs Market Outlook, by End Use, Value (US$ Billion), 2020–2033
5.3.1. Chemicals and Petrochemicals
5.3.2. Lubricants and Oils
5.3.3. Paints, Coatings and Inks
5.3.4. Agrochemicals
5.3.5. Food and Beverage Ingredients
5.3.6. Pharmaceuticals
5.3.7. Other Industrial
5.4. Europe Steel Drums & IBCs Market Outlook, by Offering, Value (US$ Billion), 2020–2033
5.4.1. New Containers
5.4.2. Reconditioned and Refurbished Containers
5.4.3. Container Management and Leasing Services
5.5. Europe Steel Drums & IBCs Market Outlook, by Country, Value (US$ Billion), 2020–2033
5.5.1. Germany Steel Drums & IBCs Market Outlook, by Product Type, 2020–2033
5.5.2. Germany Steel Drums & IBCs Market Outlook, by Capacity, 2020–2033
5.5.3. Germany Steel Drums & IBCs Market Outlook, by End Use, 2020–2033
5.5.4. Germany Steel Drums & IBCs Market Outlook, by Offering, 2020–2033
5.5.5. France Steel Drums & IBCs Market Outlook, by Product Type, 2020–2033
5.5.6. France Steel Drums & IBCs Market Outlook, by Capacity, 2020–2033
5.5.7. France Steel Drums & IBCs Market Outlook, by End Use, 2020–2033
5.5.8. France Steel Drums & IBCs Market Outlook, by Offering, 2020–2033
5.5.9. Italy Steel Drums & IBCs Market Outlook, by Product Type, 2020–2033
5.5.10. Italy Steel Drums & IBCs Market Outlook, by Capacity, 2020–2033
5.5.11. Italy Steel Drums & IBCs Market Outlook, by End Use, 2020–2033
5.5.12. Italy Steel Drums & IBCs Market Outlook, by Offering, 2020–2033
5.5.13. the Netherlands Steel Drums & IBCs Market Outlook, by Product Type, 2020–2033
5.5.14. the Netherlands Steel Drums & IBCs Market Outlook, by Capacity, 2020–2033
5.5.15. the Netherlands Steel Drums & IBCs Market Outlook, by End Use, 2020–2033
5.5.16. the Netherlands Steel Drums & IBCs Market Outlook, by Offering, 2020–2033
5.5.17. Belgium Steel Drums & IBCs Market Outlook, by Product Type, 2020–2033
5.5.18. Belgium Steel Drums & IBCs Market Outlook, by Capacity, 2020–2033
5.5.19. Belgium Steel Drums & IBCs Market Outlook, by End Use, 2020–2033
5.5.20. Belgium Steel Drums & IBCs Market Outlook, by Offering, 2020–2033
5.5.21. Poland Steel Drums & IBCs Market Outlook, by Product Type, 2020–2033
5.5.22. Poland Steel Drums & IBCs Market Outlook, by Capacity, 2020–2033
5.5.23. Poland Steel Drums & IBCs Market Outlook, by End Use, 2020–2033
5.5.24. Poland Steel Drums & IBCs Market Outlook, by Offering, 2020–2033
6. Asia Pacific Steel Drums & IBCs Market Outlook, 2020–2033
6.1. Asia Pacific Steel Drums & IBCs Market Outlook, by Product Type, Value (US$ Billion), 2020–2033
6.1.1. Tight-head Steel Drums
6.1.2. Open-head Steel Drums
6.1.3. Plastic Drums
6.1.4. Composite Intermediate Bulk Containers
6.1.5. Rigid Plastic Intermediate Bulk Containers
6.1.6. Stainless Steel Intermediate Bulk Containers
6.1.7. Closures, Liners and Fittings
6.2. Asia Pacific Steel Drums & IBCs Market Outlook, by Capacity, Value (US$ Billion), 2020–2033
6.2.1. Up to 50 Litres
6.2.2. 51–200 Litres
6.2.3. 201–500 Litres
6.2.4. Above 500 Litres
6.3. Asia Pacific Steel Drums & IBCs Market Outlook, by End Use, Value (US$ Billion), 2020–2033
6.3.1. Chemicals and Petrochemicals
6.3.2. Lubricants and Oils
6.3.3. Paints, Coatings and Inks
6.3.4. Agrochemicals
6.3.5. Food and Beverage Ingredients
6.3.6. Pharmaceuticals
6.3.7. Other Industrial
6.4. Asia Pacific Steel Drums & IBCs Market Outlook, by Offering, Value (US$ Billion), 2020–2033
6.4.1. New Containers
6.4.2. Reconditioned and Refurbished Containers
6.4.3. Container Management and Leasing Services
6.5. Asia Pacific Steel Drums & IBCs Market Outlook, by Country, Value (US$ Billion), 2020–2033
6.5.1. China Steel Drums & IBCs Market Outlook, by Product Type, 2020–2033
6.5.2. China Steel Drums & IBCs Market Outlook, by Capacity, 2020–2033
6.5.3. China Steel Drums & IBCs Market Outlook, by End Use, 2020–2033
6.5.4. China Steel Drums & IBCs Market Outlook, by Offering, 2020–2033
6.5.5. India Steel Drums & IBCs Market Outlook, by Product Type, 2020–2033
6.5.6. India Steel Drums & IBCs Market Outlook, by Capacity, 2020–2033
6.5.7. India Steel Drums & IBCs Market Outlook, by End Use, 2020–2033
6.5.8. India Steel Drums & IBCs Market Outlook, by Offering, 2020–2033
6.5.9. Japan Steel Drums & IBCs Market Outlook, by Product Type, 2020–2033
6.5.10. Japan Steel Drums & IBCs Market Outlook, by Capacity, 2020–2033
6.5.11. Japan Steel Drums & IBCs Market Outlook, by End Use, 2020–2033
6.5.12. Japan Steel Drums & IBCs Market Outlook, by Offering, 2020–2033
6.5.13. Korea Steel Drums & IBCs Market Outlook, by Product Type, 2020–2033
6.5.14. Korea Steel Drums & IBCs Market Outlook, by Capacity, 2020–2033
6.5.15. Korea Steel Drums & IBCs Market Outlook, by End Use, 2020–2033
6.5.16. Korea Steel Drums & IBCs Market Outlook, by Offering, 2020–2033
6.5.17. Indonesia Steel Drums & IBCs Market Outlook, by Product Type, 2020–2033
6.5.18. Indonesia Steel Drums & IBCs Market Outlook, by Capacity, 2020–2033
6.5.19. Indonesia Steel Drums & IBCs Market Outlook, by End Use, 2020–2033
6.5.20. Indonesia Steel Drums & IBCs Market Outlook, by Offering, 2020–2033
6.5.21. Vietnam Steel Drums & IBCs Market Outlook, by Product Type, 2020–2033
6.5.22. Vietnam Steel Drums & IBCs Market Outlook, by Capacity, 2020–2033
6.5.23. Vietnam Steel Drums & IBCs Market Outlook, by End Use, 2020–2033
6.5.24. Vietnam Steel Drums & IBCs Market Outlook, by Offering, 2020–2033
6.5.25. Thailand Steel Drums & IBCs Market Outlook, by Product Type, 2020–2033
6.5.26. Thailand Steel Drums & IBCs Market Outlook, by Capacity, 2020–2033
6.5.27. Thailand Steel Drums & IBCs Market Outlook, by End Use, 2020–2033
6.5.28. Thailand Steel Drums & IBCs Market Outlook, by Offering, 2020–2033
7. Latin America Steel Drums & IBCs Market Outlook, 2020–2033
7.1. Latin America Steel Drums & IBCs Market Outlook, by Product Type, Value (US$ Billion), 2020–2033
7.1.1. Tight-head Steel Drums
7.1.2. Open-head Steel Drums
7.1.3. Plastic Drums
7.1.4. Composite Intermediate Bulk Containers
7.1.5. Rigid Plastic Intermediate Bulk Containers
7.1.6. Stainless Steel Intermediate Bulk Containers
7.1.7. Closures, Liners and Fittings
7.2. Latin America Steel Drums & IBCs Market Outlook, by Capacity, Value (US$ Billion), 2020–2033
7.2.1. Up to 50 Litres
7.2.2. 51–200 Litres
7.2.3. 201–500 Litres
7.2.4. Above 500 Litres
7.3. Latin America Steel Drums & IBCs Market Outlook, by End Use, Value (US$ Billion), 2020–2033
7.3.1. Chemicals and Petrochemicals
7.3.2. Lubricants and Oils
7.3.3. Paints, Coatings and Inks
7.3.4. Agrochemicals
7.3.5. Food and Beverage Ingredients
7.3.6. Pharmaceuticals
7.3.7. Other Industrial
7.4. Latin America Steel Drums & IBCs Market Outlook, by Offering, Value (US$ Billion), 2020–2033
7.4.1. New Containers
7.4.2. Reconditioned and Refurbished Containers
7.4.3. Container Management and Leasing Services
7.5. Latin America Steel Drums & IBCs Market Outlook, by Country, Value (US$ Billion), 2020–2033
7.5.1. Brazil Steel Drums & IBCs Market Outlook, by Product Type, 2020–2033
7.5.2. Brazil Steel Drums & IBCs Market Outlook, by Capacity, 2020–2033
7.5.3. Brazil Steel Drums & IBCs Market Outlook, by End Use, 2020–2033
7.5.4. Brazil Steel Drums & IBCs Market Outlook, by Offering, 2020–2033
7.5.5. Mexico Steel Drums & IBCs Market Outlook, by Product Type, 2020–2033
7.5.6. Mexico Steel Drums & IBCs Market Outlook, by Capacity, 2020–2033
7.5.7. Mexico Steel Drums & IBCs Market Outlook, by End Use, 2020–2033
7.5.8. Mexico Steel Drums & IBCs Market Outlook, by Offering, 2020–2033
7.5.9. Argentina Steel Drums & IBCs Market Outlook, by Product Type, 2020–2033
7.5.10. Argentina Steel Drums & IBCs Market Outlook, by Capacity, 2020–2033
7.5.11. Argentina Steel Drums & IBCs Market Outlook, by End Use, 2020–2033
7.5.12. Argentina Steel Drums & IBCs Market Outlook, by Offering, 2020–2033
7.5.13. Colombia Steel Drums & IBCs Market Outlook, by Product Type, 2020–2033
7.5.14. Colombia Steel Drums & IBCs Market Outlook, by Capacity, 2020–2033
7.5.15. Colombia Steel Drums & IBCs Market Outlook, by End Use, 2020–2033
7.5.16. Colombia Steel Drums & IBCs Market Outlook, by Offering, 2020–2033
7.5.17. Chile Steel Drums & IBCs Market Outlook, by Product Type, 2020–2033
7.5.18. Chile Steel Drums & IBCs Market Outlook, by Capacity, 2020–2033
7.5.19. Chile Steel Drums & IBCs Market Outlook, by End Use, 2020–2033
7.5.20. Chile Steel Drums & IBCs Market Outlook, by Offering, 2020–2033
8. Middle East & Africa Steel Drums & IBCs Market Outlook, 2020–2033
8.1. Middle East & Africa Steel Drums & IBCs Market Outlook, by Product Type, Value (US$ Billion), 2020–2033
8.1.1. Tight-head Steel Drums
8.1.2. Open-head Steel Drums
8.1.3. Plastic Drums
8.1.4. Composite Intermediate Bulk Containers
8.1.5. Rigid Plastic Intermediate Bulk Containers
8.1.6. Stainless Steel Intermediate Bulk Containers
8.1.7. Closures, Liners and Fittings
8.2. Middle East & Africa Steel Drums & IBCs Market Outlook, by Capacity, Value (US$ Billion), 2020–2033
8.2.1. Up to 50 Litres
8.2.2. 51–200 Litres
8.2.3. 201–500 Litres
8.2.4. Above 500 Litres
8.3. Middle East & Africa Steel Drums & IBCs Market Outlook, by End Use, Value (US$ Billion), 2020–2033
8.3.1. Chemicals and Petrochemicals
8.3.2. Lubricants and Oils
8.3.3. Paints, Coatings and Inks
8.3.4. Agrochemicals
8.3.5. Food and Beverage Ingredients
8.3.6. Pharmaceuticals
8.3.7. Other Industrial
8.4. Middle East & Africa Steel Drums & IBCs Market Outlook, by Offering, Value (US$ Billion), 2020–2033
8.4.1. New Containers
8.4.2. Reconditioned and Refurbished Containers
8.4.3. Container Management and Leasing Services
8.5. Middle East & Africa Steel Drums & IBCs Market Outlook, by Country, Value (US$ Billion), 2020–2033
8.5.1. Saudi Arabia Steel Drums & IBCs Market Outlook, by Product Type, 2020–2033
8.5.2. Saudi Arabia Steel Drums & IBCs Market Outlook, by Capacity, 2020–2033
8.5.3. Saudi Arabia Steel Drums & IBCs Market Outlook, by End Use, 2020–2033
8.5.4. Saudi Arabia Steel Drums & IBCs Market Outlook, by Offering, 2020–2033
8.5.5. United Arab Emirates Steel Drums & IBCs Market Outlook, by Product Type, 2020–2033
8.5.6. United Arab Emirates Steel Drums & IBCs Market Outlook, by Capacity, 2020–2033
8.5.7. United Arab Emirates Steel Drums & IBCs Market Outlook, by End Use, 2020–2033
8.5.8. United Arab Emirates Steel Drums & IBCs Market Outlook, by Offering, 2020–2033
8.5.9. Egypt Steel Drums & IBCs Market Outlook, by Product Type, 2020–2033
8.5.10. Egypt Steel Drums & IBCs Market Outlook, by Capacity, 2020–2033
8.5.11. Egypt Steel Drums & IBCs Market Outlook, by End Use, 2020–2033
8.5.12. Egypt Steel Drums & IBCs Market Outlook, by Offering, 2020–2033
8.5.13. Nigeria Steel Drums & IBCs Market Outlook, by Product Type, 2020–2033
8.5.14. Nigeria Steel Drums & IBCs Market Outlook, by Capacity, 2020–2033
8.5.15. Nigeria Steel Drums & IBCs Market Outlook, by End Use, 2020–2033
8.5.16. Nigeria Steel Drums & IBCs Market Outlook, by Offering, 2020–2033
8.5.17. South Africa Steel Drums & IBCs Market Outlook, by Product Type, 2020–2033
8.5.18. South Africa Steel Drums & IBCs Market Outlook, by Capacity, 2020–2033
8.5.19. South Africa Steel Drums & IBCs Market Outlook, by End Use, 2020–2033
8.5.20. South Africa Steel Drums & IBCs Market Outlook, by Offering, 2020–2033
9. Competitive Landscape
9.1. Market Concentration and Industry Leaders
9.2. Competitive Differentiation
9.3. Strategic Moves and Market Direction
9.4. Recent Industry Developments
9.5. Company Profiles
9.5.1. Greif, Inc.
9.5.2. Mauser Packaging Solutions
9.5.3. Schütz GmbH & Co. KGaA
9.5.4. Time Technoplast Limited
9.5.5. Balmer Lawrie & Co. Ltd.
9.5.6. THIELMANN Group
9.5.7. Hoover Ferguson Group, Inc.
9.5.8. WERIT Kunststoffwerke W. Schneider GmbH & Co. KG
9.5.9. JFE Container Co., Ltd.
9.5.10. Snyder Industries, LLC
9.5.11. Pyramid Technoplast Limited
9.5.12. Great Western Containers Inc.
10. Appendix
10.1. Research Methodology
10.2. Report Assumptions
10.3. Acronyms and Abbreviations
| Product Type | Tight-head Steel Drums, Open-head Steel Drums, Plastic Drums, Composite Intermediate Bulk Containers, Rigid Plastic Intermediate Bulk Containers, Stainless Steel Intermediate Bulk Containers, Closures, Liners and Fittings |
| Capacity | Up to 50 Litres, 51–200 Litres, 201–500 Litres, Above 500 Litres |
| End Use | Chemicals and Petrochemicals, Lubricants and Oils, Paints, Coatings and Inks, Agrochemicals, Food and Beverage Ingredients, Pharmaceuticals, Other Industrial |
| Offering | New Containers, Reconditioned and Refurbished Containers, Container Management and Leasing Services |
| Regions | North America, Europe, Asia Pacific, Latin America, Middle East & Africa |
Our Research Methodology
Considering the volatility of business today, traditional approaches to strategizing a game plan can be unfruitful if not detrimental. True ambiguity is no way to determine a forecast. A myriad of predetermined factors must be accounted for such as the degree of risk involved, the magnitude of circumstances, as well as conditions or consequences that are not known or unpredictable. To circumvent binary views that cast uncertainty, the application of market research intelligence to strategically posture, move, and enable actionable outcomes is necessary.
View Methodology
Quality Assured
Rigorous Validation Process

Confidentiality Assured
End-to-end Data Security

Custom Research Services
Tailored To Your Objectives
FAQs
The global steel drums & IBCs market is valued at US$ 21.4 billion in 2026, covering new containers, reconditioned units and container management services worldwide.
The market is projected to reach US$ 29.8 billion by 2033, growing at a 4.8% CAGR and adding an absolute opportunity of US$ 8.4 billion.
Composite intermediate bulk containers lead with 27.6% share in 2026, because a caged bottle delivers one thousand litres at the lowest certified cost per litre.
Container management and leasing services grow fastest at 7.4%, and Middle East & Africa is the quickest region at a 6.4% CAGR.
Asia Pacific holds the largest share at 33.4% in 2026, supported by its concentration of new petrochemical, agrochemical and specialty chemical filling capacity.
Related Reports
Ultra high Molecular Weight Polyethylene Market Size, Share, Insights, Competitive Landscape, and Forecast 2026 to 2033
Explore the UHMWPE market, forecast to reach US$4.8 billion by 2033 at 7.5% CAGR, with insights into grades, applications, regions and leading companies.
Semiconductor Gases Market Size, Share, Insights, Competitive Landscape, and Forecast 2026 to 2033
The semiconductor gases market is projected to grow from US$9.6 billion in 2026 to US$16.8 billion by 2033, at an 8.3% CAGR. Explore segments and trends.
Non-load Bearing Walls Market Size, Share, Insights, Competitive Landscape, and Forecast 2026 to 2033
The non-load bearing walls market is projected to grow from US$96.0 billion in 2026 to US$136.0 billion by 2033, at a 5.1% CAGR. Explore key trends.
Nanoparticle Technology Market Size, Share, Insights, Competitive Landscape, and Forecast 2026 to 2033
The nanoparticle technology market is projected to grow from US$24.0 billion in 2026 to US$48.0 billion by 2033, at a 10.4% CAGR. Explore key trends.
Expanded PTFE (ePTFE) Market Size, Share, Insights, Competitive Landscape, and Forecast 2026 to 2033
The expanded PTFE market is projected to grow from US$2.4 billion in 2026 to US$3.8 billion by 2033, at a 6.8% CAGR. Explore segments and regional trends.
Ethylene Dichloride Market Size, Share, Insights, Competitive Landscape, and Forecast 2026 to 2033
The ethylene dichloride market is projected to grow from US$24.5 billion in 2026 to US$31.0 billion by 2033, at a 3.4% CAGR. Explore segments and regions.