



Semiconductor Gases Market
Semiconductor Gases Market Size, Share, Insights, Competitive Landscape, and Forecast 2026 to 2033
Semiconductor Gases Market Size and Trend Analysis
What Is the Outlook for Semiconductor Gas Demand to 2033?
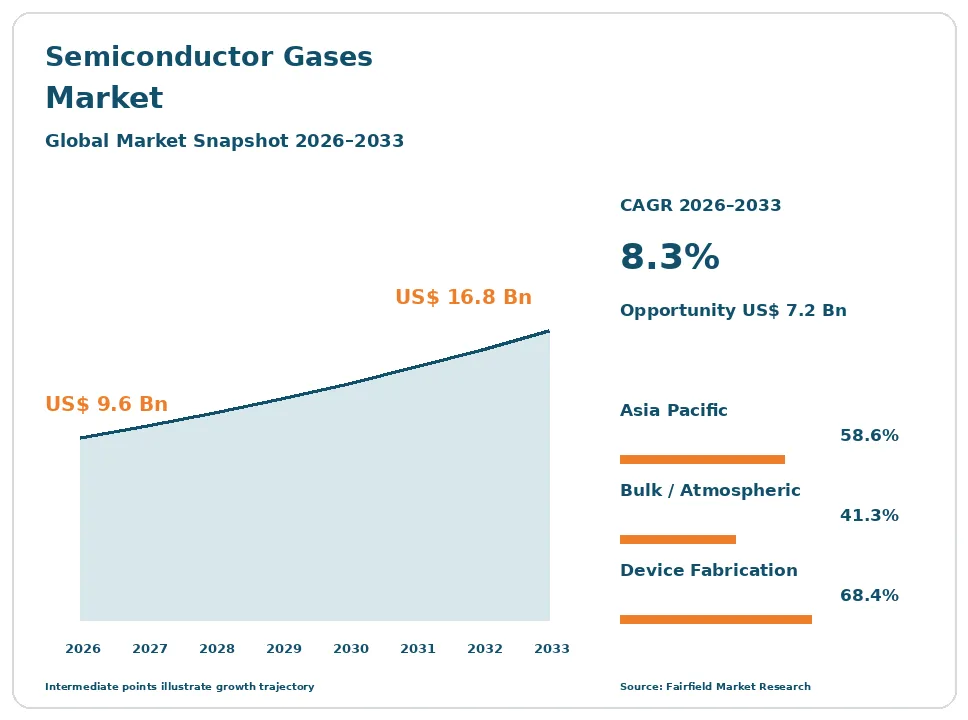
The global semiconductor gases market size is expected to be valued at US$ 9.6 billion in 2026 and projected to reach US$ 16.8 billion by 2033, growing at a CAGR of 8.3% between 2026 and 2033.
Between 2020 and 2025 the market grew at roughly 7.0% a year, tracking wafer starts through a sharp memory downcycle and a strong logic recovery. Three forces carry growth to 2033. Process complexity rises faster than wafer volume, because each advanced node adds deposition, etch and chamber-clean steps that each consume gas. Fab construction programmes in several regions are adding capacity that needs on-site plants and pipeline supply from day one. Advanced packaging and high-bandwidth memory assembly create new consumption outside the front end. The direction is steady volume growth with mix shifting toward higher-value specialty molecules, purification services and abatement obligations attached to supply contracts.
Key Report Takeaways
- By Gas Type: Bulk and atmospheric gases held 41.3% share in 2026, while deposition precursors are projected to expand at a 10.8% CAGR through 2033, driven by atomic layer deposition and new metal and dielectric chemistries entering high-volume production.
- By Supply Mode: On-site generation plants held 34.2% share in 2026, while gas delivery, purification and on-site services are projected to grow at a 10.4% CAGR through 2033, driven by fabs outsourcing panel management, analysis and point-of-use purification.
- By Process Application: Etching and chamber cleaning held 28.4% share in 2026, while annealing and packaging is projected to advance at a 10.6% CAGR through 2033, driven by hybrid bonding and advanced packaging lines adding controlled-atmosphere steps.
- By End Use: Semiconductor device fabrication held 68.4% share in 2026, while advanced packaging and test is projected to expand at a 12.3% CAGR through 2033, driven by chiplet architectures moving value from the wafer into assembly.
- By Geography: Asia Pacific held 58.6% share in 2026, while North America is projected to post a 10.6% CAGR through 2033, driven by new leading-edge and memory fabs entering production under national incentive programmes.
Global Semiconductor Gases Market Trends and Insights
Drivers Impact Analysis
| Driver | Impact on CAGR Forecast | Geographic Relevance | Impact Timeline |
| Rising process step counts at advanced nodes raising gas consumption per wafer | High | Global | Long term (≥4 years) |
| Regional fab construction programmes creating new on-site and pipeline supply contracts | High | North America, Europe, Asia Pacific | Medium term (2–4 years) |
Two forces account for most of the value added to electronic gas supply through 2033.
Process Complexity Lifts Gas Consumption Per Wafer Faster Than Wafer Volume Grows
Gas demand follows process steps, not chip prices, and that distinction explains why this market grows through semiconductor downcycles. A leading-edge logic wafer now passes through far more deposition, etch, clean and implant operations than a mature-node wafer, and each one draws specialty or bulk gas. Multi-patterning, high aspect ratio memory structures and three-dimensional device architectures all multiply the number of chamber cycles per finished wafer.
The mechanism is visible in the chamber. Every deposition step is followed by a chamber clean, usually with a fluorinated gas, so step count drives etchant and clean gas volume directly. Atomic layer processes trade thickness control for many short cycles, each with its own precursor and purge. Nitrogen consumption rises in parallel, because purging, blanketing and tool environments scale with the number of chambers a wafer visits.
Regional Fab Construction Programmes Lock In New On-Site and Pipeline Supply Contracts
New fab construction converts directly into long-duration gas contracts, and the current building wave is unusually geographically spread. Incentive programmes including the CHIPS and Science Act in the United States, the European Chips Act, and national semiconductor support schemes in Japan, Korea, India and elsewhere are funding capacity in places with little existing electronic gas infrastructure. Each new fab needs nitrogen, oxygen, argon and hydrogen supply engineered before tools arrive.
The commercial mechanism favours incumbent suppliers. An on-site nitrogen plant is built, owned and operated by the gas company under a contract that runs for a decade or more, with capacity sized to the fab’s eventual ramp. That contract then carries bulk argon and helium, specialty gas distribution and often on-site services. Winning the construction phase therefore secures the operating-phase revenue that follows.
Restraints Impact Analysis
| Restraint | Impact on CAGR Forecast | Geographic Relevance | Impact Timeline |
| Rare gas and helium supply concentration with geopolitical and price exposure | High | Global | Short term (≤2 years) |
| Fluorinated gas emission rules and per- and polyfluoroalkyl substance restriction pressure | Medium | Europe, North America, Asia Pacific | Long term (≥4 years) |
Two structural pressures constrain supply security and raise the compliance cost of electronic gas use.
Rare Gas and Helium Supply Concentration Leaves Fabs Exposed to Disruption and Price Spikes
Supply concentration is the clearest fragility in this sector, and it has already caused real disruption. Neon, krypton and xenon are recovered as by-products from a small number of large air separation and steelmaking complexes, and semiconductor-grade purification capacity has historically sat in very few places. When that capacity becomes unavailable, there is no rapid substitute, because excimer laser lithography has no alternative to neon and qualification of a new source takes months.
Helium carries a parallel risk from a different cause. It is produced only as a by-product of specific natural gas fields, output is concentrated in a handful of countries, and planned plant outages have repeatedly tightened supply and moved prices sharply. Fabs responded by writing redundant sourcing into contracts, qualifying multiple origins and investing in on-site recovery, all of which raise the cost of assured supply.
Fluorinated Gas Rules and PFAS Restriction Pressure Raise the Compliance Cost of Etch Chemistry
The gases that make modern etch and chamber cleaning possible are among the most potent greenhouse gases in industrial use, and that is now an active compliance problem rather than a future one. Nitrogen trifluoride, sulphur hexafluoride and perfluorinated carbons have very high global warming potentials and long atmospheric lifetimes. Fabs face emission reporting obligations, voluntary industry reduction commitments and growing customer scrutiny of manufacturing footprints.
A second regulatory thread compounds it. The restriction proposal on per- and polyfluoroalkyl substances submitted to the European Chemicals Agency defines the substance group broadly enough to touch some process gases and fluoropolymer components used in gas delivery. The practical consequence is that abatement equipment, point-of-use destruction, process optimisation to cut consumption and qualification of alternative chemistries all become mandatory engineering spend rather than optional sustainability projects.
Market Opportunities
Two revenue pools sit beyond the traditional molecule supply contract.
On-Site Recovery, Recycling and Abatement Services Open a Recurring Revenue Pool
Recovery and abatement services are turning an environmental obligation into a priced service line, and they attach to the fab for its operating life. On-site recycling of neon, xenon, krypton and helium lets a fab recover gas from tool exhaust, repurify it and return it to the process, cutting both exposure to supply shocks and purchase volume. Fluorinated gas destruction units sized for specific tool sets address the emissions problem at the point of use.
Gas companies are best placed to capture this because they already operate inside the fab. The customers are leading-edge logic and memory producers under corporate emission commitments and customer audits, and increasingly display manufacturers facing similar scrutiny. Equipment makers supply the hardware, but the recurring value sits in operating it, analysing gas purity continuously and guaranteeing recovery rates contractually alongside the original supply agreement.
Advanced Packaging and New Deposition Chemistries Create Demand Outside the Front End
Advanced packaging is the fastest-expanding consumption point in the industry and it uses gases differently from wafer fabrication. Hybrid bonding, through-silicon vias, wafer-level packaging and high-bandwidth memory stacking each add plasma activation, controlled-atmosphere annealing, reflow under forming gas and surface preparation steps. Assembly and test sites that once bought modest nitrogen volumes now need specialty supply and purity control closer to front-end standards.
The demand comes from outsourced assembly and test providers, memory makers stacking die, and foundries moving packaging in-house to control chiplet integration. Alongside it, new deposition chemistries for high-k dielectrics, metal gates, molybdenum and ruthenium interconnects and selective deposition bring precursor molecules that are synthesised in small volumes at high value. Suppliers with precursor synthesis and development capability, rather than distribution scale alone, capture most of that margin and the qualification position behind it.
Segment Analysis
By Gas Type: Bulk and Atmospheric Gases Anchor Volume as Deposition Precursors Grow Fastest
Bulk and atmospheric gases held 41.3% of value in 2026, because nitrogen, oxygen, argon, hydrogen and helium are consumed continuously and in enormous quantity across every tool and cleanroom in a fab. Etchant and chamber-clean gases followed at 20.6%, covering nitrogen trifluoride, fluorinated carbons, hydrogen bromide, chlorine and tungsten hexafluoride. Silicon precursors took 13.8%, noble and rare gases 7.6%, and dopant gases 5.3%, a small share that belies their criticality.
Deposition precursors hold 11.4% share and grow fastest at a 10.8% CAGR through 2033. Atomic layer deposition and new metal and dielectric chemistries require molecules synthesised in small batches to extreme purity, and each node transition introduces more of them. The implication is that revenue growth concentrates in chemistry development capability rather than in tonnage.
By Supply Mode: On-Site Plants Dominate While Purification and Services Expand Quickest
On-site generation plants accounted for 34.2% of supply value in 2026, the largest mode, because a large fab’s nitrogen demand is too great and too critical to serve by delivery. The plant sits on the fab boundary, operates under a long contract and cannot practically be replaced mid-term. Bulk and pipeline delivery followed at 26.5% for argon, oxygen, hydrogen and helium, and cylinder and packaged delivery held 24.7% for specialty molecules.
Gas delivery, purification and on-site services hold 14.6% share and grow fastest at a 10.4% CAGR through 2033. Fabs increasingly hand over cylinder panel management, point-of-use purification, continuous purity analysis and emergency response to the supplier. For the business this deepens the switching cost that already makes these relationships unusually durable.
By Process Application: Etch and Chamber Cleaning Lead While Packaging Steps Rise Fastest
Etching and chamber cleaning consumed 28.4% of gas value in 2026, the largest process pool, because every deposition cycle is followed by a clean and because high aspect ratio etching in memory requires long, chemistry-intensive steps. Deposition followed at 26.1%, wafer cleaning and surface preparation at 15.7%, lithography at 11.9% where excimer laser gas mixtures and purge requirements dominate, and doping and ion implantation at 7.7%.
Annealing and packaging holds 10.2% share and grows fastest at a 10.6% CAGR through 2033. Hybrid bonding and stacked die assembly add plasma activation and controlled-atmosphere thermal steps that did not exist in conventional packaging. The business implication is that gas suppliers must now qualify at assembly and test sites, which historically bought on price rather than on purity specification.
By End Use: Device Fabrication Dominates While Advanced Packaging and Test Grows Fastest
Semiconductor device fabrication represented 68.4% of demand in 2026, a share no other end use approaches, since logic, memory and analogue wafer production consume both the bulk volume and nearly all the specialty chemistry. Display manufacturing followed at 13.2%, where large-area deposition and etch use silane, nitrogen trifluoride and bulk nitrogen heavily. Photovoltaic manufacturing accounted for 11.5%, concentrated in very large-scale cell and module lines.
Advanced packaging and test held 6.9% share and grows fastest at a 12.3% CAGR through 2033. Chiplet architectures move a growing share of device value and process difficulty out of the wafer and into assembly, and the gases follow. For suppliers this means building commercial relationships with assembly and test companies that were previously served as general industrial accounts.
Geography Analysis
Which Region Is Growing Fastest in the Semiconductor Gases Market?
North America is growing fastest in the semiconductor gases market, at a 10.6% CAGR through 2033 from 18.4% share in 2026. The United States accounts for almost all of it, with Canada and Mexico contributing assembly, test and materials activity. Growth is unusually visible because it comes from new capacity rather than utilisation: leading-edge logic, advanced memory and specialty fabs are entering production in Arizona, Texas, Ohio, New York and Idaho.
Three causes drive the rate. The CHIPS and Science Act underwrote construction that would not otherwise have been sited domestically. Each new fab requires an on-site nitrogen plant and pipeline network engineered years ahead of first silicon. Advanced packaging capacity is being built alongside, adding a second demand layer. The main constraint is specialty molecule supply, much of which is still imported, which is pushing suppliers to localise purification and cylinder filling.
Europe Supplies Specialty Chemistry While Rebuilding Front-End Capacity
Europe accounted for 13.2% of demand in 2026 and grows at 8.4% through 2033. Germany, Ireland, France, Italy, the Netherlands and Austria host most consumption, spanning automotive and industrial semiconductors, power devices and analogue production rather than leading-edge logic. The region also contains significant specialty chemical synthesis capacity that supplies precursors well beyond its own borders.
Two forces shape the market. The European Chips Act is funding new front-end capacity intended to raise regional self-sufficiency, which creates on-site plant opportunities on greenfield sites. Working against that, energy cost makes air separation and hydrogen production structurally more expensive here than in competing regions, and the European Chemicals Agency restriction process on per- and polyfluoroalkyl substances creates compliance uncertainty around some process chemistries. The opportunity is silicon carbide and power device capacity, which is expanding faster than general logic.
Which Region Is Leading the Semiconductor Gases Market?
Asia Pacific is leading the semiconductor gases market, with 58.6% share in 2026 and a 7.9% CAGR to 2033. Taiwan, Korea, China and Japan hold the overwhelming majority of installed wafer capacity, with Singapore and Malaysia adding fabrication, assembly and test. Leadership is simply a function of where wafers are started: the region runs most of the world’s leading-edge foundry capacity, nearly all advanced memory output and the largest display and photovoltaic manufacturing base.
The structure is correspondingly deep. Regional specialty gas producers supply much of the world’s nitrogen trifluoride, tungsten hexafluoride and silicon precursor volume, and on-site plant density around major fab clusters is the highest anywhere. Export controls on semiconductor materials and equipment have encouraged domestic qualification of locally produced gases in China. The change to watch is rare gas purification capacity being rebuilt within the region to reduce dependence on distant origins.
Latin America Serves Assembly, Test and Photovoltaic Demand From a Small Base
Latin America represented 4.5% share in 2026 and grows at 6.2% to 2033, the slowest regional rate. Mexico, Brazil and Costa Rica account for most consumption. There is very little front-end wafer fabrication, so demand concentrates in semiconductor assembly, test and packaging operations, in medical and automotive electronics manufacturing, and in photovoltaic module production, all of which use bulk nitrogen and hydrogen far more than specialty chemistry.
Barriers are structural. Without leading-edge fabs there is no anchor load to justify dedicated electronic-grade purification capacity, so high-purity specialty gases are imported with long lead times and significant cost. Skilled gas handling and analysis capability is concentrated in a few industrial centres. The opportunity is nearshoring: as electronics assembly relocates closer to the North American market, packaging and test capacity grows, and that eventually justifies regional electronic-grade supply infrastructure.
Middle East & Africa Builds Electronic Gas Capability Around New Industrial Programmes
Middle East & Africa held 5.3% share in 2026 and grows at 7.0% to 2033. Israel accounts for the largest part, hosting advanced wafer fabrication and a substantial design and equipment base, with Saudi Arabia, the United Arab Emirates and South Africa adding smaller electronics and photovoltaic manufacturing demand. Low-cost energy and feedstock make the Gulf attractive for industrial gas production, including hydrogen and air separation at scale.
Barriers remain considerable. Electronic-grade purification, analysis laboratories and specialty cylinder handling are scarce, qualified technical staff are limited, and the absence of a dense fab cluster raises the cost of serving any single site. Transport and storage rules for toxic and pyrophoric gases vary between jurisdictions. The change underway is sovereign investment programmes targeting semiconductor and advanced electronics manufacturing, which would create the anchor demand that local electronic gas infrastructure currently lacks.
Competitive Landscape
The semiconductor gases market is highly concentrated, and the structure is dictated by capital and qualification rather than by technology secrecy. A small number of global industrial gas companies supply most bulk and atmospheric volume, because only they can finance, build and operate on-site plants and pipeline networks under decade-long contracts. Alongside them sits a second tier of specialty chemical producers, heavily weighted toward Japanese and Korean companies, that dominates specific electronic molecules such as fluorinated etchants, silicon precursors and dopants. Vertical overlap is common, with the large gas majors also supplying specialty molecules and the specialty producers partnering for distribution.
Competition is decided before the first molecule is delivered. Qualification is the gate: a gas must be approved for a specific process on specific tools, and requalifying a source costs the fab time it does not have. Supply assurance is next, measured in redundant sourcing, on-site storage, backup plants and documented response times, because an interruption costs more than years of gas spend. Purity consistency, analytical capability and the ability to co-locate engineers inside the fab complete the basis of competition.
Strategic activity clusters around three themes. Suppliers are localising purification, cylinder filling and specialty synthesis near new fab clusters to shorten supply chains and satisfy customers worried about origin concentration. They are building rare gas recovery and recycling capability, partly as a service offer and partly as insurance. They are also investing in precursor development for new deposition chemistries, where margins are far better than in tonnage gases.
The broad direction is a shift from selling molecules to guaranteeing uninterrupted, auditable, lower-emission supply, with abatement performance and recovery rates increasingly written into the contract itself.
Semiconductor Gases Industry Leaders
- Linde plc
- Air Liquide S.A.
- Air Products and Chemicals, Inc.
- Nippon Sanso Holdings Corporation
- Resonac Holdings Corporation
Recent Industry Developments
- October 2016: The Kigali Amendment to the Montreal Protocol was adopted, establishing an international schedule for phasing down high global warming potential fluorinated gases – it set the policy template that now frames voluntary emission reduction commitments covering fluorinated etch and chamber-clean chemistry.
- February 2022: Conflict in Ukraine halted operation of neon purification capacity concentrated there, removing a large share of global semiconductor-grade supply – it forced fabs and gas suppliers to qualify alternative origins and accelerated investment in on-site rare gas recovery.
- August 2022: The United States enacted the CHIPS and Science Act, providing incentives for domestic semiconductor manufacturing and research – it triggered the fab construction programme that is now the single largest source of new on-site gas plant contracts in the region.
- February 2023: The European Chemicals Agency published the restriction proposal on per- and polyfluoroalkyl substances submitted by five national authorities – its broad definition brought certain process gases and fluoropolymer gas-handling components into scope, making alternative chemistry a live engineering question.
- September 2023: The European Chips Act entered into force, creating a framework for public support of semiconductor manufacturing capacity in the European Union – it underpins the greenfield fab projects that determine where regional electronic gas infrastructure is built next.
Companies Covered in the Report
- Linde plc
- Air Liquide S.A.
- Air Products and Chemicals, Inc.
- Nippon Sanso Holdings Corporation
- Messer SE & Co. KGaA
- Matheson Tri-Gas, Inc.
- Resonac Holdings Corporation
- Kanto Denka Kogyo Co., Ltd.
- Central Glass Co., Ltd.
- SK Specialty Co., Ltd.
- Sumitomo Seika Chemicals Company, Limited
- Merck KGaA
- Entegris, Inc.
Semiconductor Gases Market Report Scope
This report covers gases supplied to semiconductor, display and photovoltaic manufacturing: bulk and atmospheric gases, silicon precursors, dopants, etchants and chamber-clean gases, deposition precursors and noble gases, together with gas delivery, purification, blending and on-site services. Gas cabinets, delivery hardware and abatement equipment sold as capital items are excluded, though the services operating them are counted. The base year is 2025, the forecast period 2026 to 2033, in US$ Billion.
Gas Type
- Bulk and Atmospheric Gases
- Silicon Precursors
- Dopant Gases
- Etchant and Chamber-Clean Gases
- Deposition Precursors
- Noble and Rare Gases
Supply Mode
- On-Site Generation Plants
- Bulk and Pipeline Delivery
- Cylinder and Packaged Delivery
- Gas Delivery, Purification and On-Site Services
Process Application
- Deposition
- Etching and Chamber Cleaning
- Lithography
- Doping and Ion Implantation
- Wafer Cleaning and Surface Preparation
- Annealing and Packaging
End Use
- Semiconductor Device Fabrication
- Display Manufacturing
- Photovoltaic Manufacturing
- Advanced Packaging and Test
Regions
- North America
- Europe
- Asia Pacific
- Latin America
- Middle East & Africa
Key Questions Answered in the Report
How big is the semiconductor gases market in 2026?
The global semiconductor gases market is valued at US$ 9.6 billion in 2026, covering bulk gases, electronic specialty gases and associated purification and on-site services.
What is the forecast size and CAGR of the electronic gases market by 2033?
The market is projected to reach US$ 16.8 billion by 2033, growing at an 8.3% CAGR and adding an absolute opportunity of US$ 7.2 billion.
Which gas type leads the semiconductor gases market?
Bulk and atmospheric gases lead with 41.3% share in 2026, since nitrogen, argon, oxygen and hydrogen are consumed continuously across every fab tool.
Which semiconductor gases segment is growing fastest?
Advanced packaging and test grows fastest at a 12.3% CAGR, as chiplet architectures move process value from wafer fabrication into assembly.
Which region holds the largest share of semiconductor gas demand?
Asia Pacific holds 58.6% share in 2026, reflecting its concentration of leading-edge foundry, memory, display and photovoltaic manufacturing capacity.
1. Executive Summary
1.1. Global Semiconductor Gases Market Snapshot
1.2. Future Projections
1.3. Key Report Takeaways
1.4. Regional Snapshot
2. Market Overview
2.1. Market Definition and Report Scope
2.2. Historical Trends 2020–2025
2.3. Market Dynamics
2.3.1. Drivers
2.3.1.1. Process Complexity Lifts Gas Consumption Per Wafer Faster Than Wafer Volume Grows
2.3.1.2. Regional Fab Construction Programmes Lock In New On-Site and Pipeline Supply Contracts
2.3.2. Restraints
2.3.2.1. Rare Gas and Helium Supply Concentration Leaves Fabs Exposed to Disruption and Price Spikes
2.3.2.2. Fluorinated Gas Rules and PFAS Restriction Pressure Raise the Compliance Cost of Etch Chemistry
2.3.3. Market Opportunities
2.3.3.1. On-Site Recovery, Recycling and Abatement Services Open a Recurring Revenue Pool
2.3.3.2. Advanced Packaging and New Deposition Chemistries Create Demand Outside the Front End
3. Global Semiconductor Gases Market Outlook, 2020–2033
3.1. Global Semiconductor Gases Market Outlook, by Gas Type, Value (US$ Billion), 2020–2033
3.1.1. Bulk and Atmospheric Gases
3.1.2. Silicon Precursors
3.1.3. Dopant Gases
3.1.4. Etchant and Chamber-Clean Gases
3.1.5. Deposition Precursors
3.1.6. Noble and Rare Gases
3.2. Global Semiconductor Gases Market Outlook, by Supply Mode, Value (US$ Billion), 2020–2033
3.2.1. On-Site Generation Plants
3.2.2. Bulk and Pipeline Delivery
3.2.3. Cylinder and Packaged Delivery
3.2.4. Gas Delivery, Purification and On-Site Services
3.3. Global Semiconductor Gases Market Outlook, by Process Application, Value (US$ Billion), 2020–2033
3.3.1. Deposition
3.3.2. Etching and Chamber Cleaning
3.3.3. Lithography
3.3.4. Doping and Ion Implantation
3.3.5. Wafer Cleaning and Surface Preparation
3.3.6. Annealing and Packaging
3.4. Global Semiconductor Gases Market Outlook, by End Use, Value (US$ Billion), 2020–2033
3.4.1. Semiconductor Device Fabrication
3.4.2. Display Manufacturing
3.4.3. Photovoltaic Manufacturing
3.4.4. Advanced Packaging and Test
3.5. Global Semiconductor Gases Market Outlook, by Region, Value (US$ Billion), 2020–2033
3.5.1. North America
3.5.2. Europe
3.5.3. Asia Pacific
3.5.4. Latin America
3.5.5. Middle East & Africa
4. North America Semiconductor Gases Market Outlook, 2020–2033
4.1. North America Semiconductor Gases Market Outlook, by Gas Type, Value (US$ Billion), 2020–2033
4.1.1. Bulk and Atmospheric Gases
4.1.2. Silicon Precursors
4.1.3. Dopant Gases
4.1.4. Etchant and Chamber-Clean Gases
4.1.5. Deposition Precursors
4.1.6. Noble and Rare Gases
4.2. North America Semiconductor Gases Market Outlook, by Supply Mode, Value (US$ Billion), 2020–2033
4.2.1. On-Site Generation Plants
4.2.2. Bulk and Pipeline Delivery
4.2.3. Cylinder and Packaged Delivery
4.2.4. Gas Delivery, Purification and On-Site Services
4.3. North America Semiconductor Gases Market Outlook, by Process Application, Value (US$ Billion), 2020–2033
4.3.1. Deposition
4.3.2. Etching and Chamber Cleaning
4.3.3. Lithography
4.3.4. Doping and Ion Implantation
4.3.5. Wafer Cleaning and Surface Preparation
4.3.6. Annealing and Packaging
4.4. North America Semiconductor Gases Market Outlook, by End Use, Value (US$ Billion), 2020–2033
4.4.1. Semiconductor Device Fabrication
4.4.2. Display Manufacturing
4.4.3. Photovoltaic Manufacturing
4.4.4. Advanced Packaging and Test
4.5. North America Semiconductor Gases Market Outlook, by Country, Value (US$ Billion), 2020–2033
4.5.1. United States Semiconductor Gases Market Outlook, by Gas Type, 2020–2033
4.5.2. United States Semiconductor Gases Market Outlook, by Supply Mode, 2020–2033
4.5.3. United States Semiconductor Gases Market Outlook, by Process Application, 2020–2033
4.5.4. United States Semiconductor Gases Market Outlook, by End Use, 2020–2033
4.5.5. Canada Semiconductor Gases Market Outlook, by Gas Type, 2020–2033
4.5.6. Canada Semiconductor Gases Market Outlook, by Supply Mode, 2020–2033
4.5.7. Canada Semiconductor Gases Market Outlook, by Process Application, 2020–2033
4.5.8. Canada Semiconductor Gases Market Outlook, by End Use, 2020–2033
4.5.9. Mexico Semiconductor Gases Market Outlook, by Gas Type, 2020–2033
4.5.10. Mexico Semiconductor Gases Market Outlook, by Supply Mode, 2020–2033
4.5.11. Mexico Semiconductor Gases Market Outlook, by Process Application, 2020–2033
4.5.12. Mexico Semiconductor Gases Market Outlook, by End Use, 2020–2033
5. Europe Semiconductor Gases Market Outlook, 2020–2033
5.1. Europe Semiconductor Gases Market Outlook, by Gas Type, Value (US$ Billion), 2020–2033
5.1.1. Bulk and Atmospheric Gases
5.1.2. Silicon Precursors
5.1.3. Dopant Gases
5.1.4. Etchant and Chamber-Clean Gases
5.1.5. Deposition Precursors
5.1.6. Noble and Rare Gases
5.2. Europe Semiconductor Gases Market Outlook, by Supply Mode, Value (US$ Billion), 2020–2033
5.2.1. On-Site Generation Plants
5.2.2. Bulk and Pipeline Delivery
5.2.3. Cylinder and Packaged Delivery
5.2.4. Gas Delivery, Purification and On-Site Services
5.3. Europe Semiconductor Gases Market Outlook, by Process Application, Value (US$ Billion), 2020–2033
5.3.1. Deposition
5.3.2. Etching and Chamber Cleaning
5.3.3. Lithography
5.3.4. Doping and Ion Implantation
5.3.5. Wafer Cleaning and Surface Preparation
5.3.6. Annealing and Packaging
5.4. Europe Semiconductor Gases Market Outlook, by End Use, Value (US$ Billion), 2020–2033
5.4.1. Semiconductor Device Fabrication
5.4.2. Display Manufacturing
5.4.3. Photovoltaic Manufacturing
5.4.4. Advanced Packaging and Test
5.5. Europe Semiconductor Gases Market Outlook, by Country, Value (US$ Billion), 2020–2033
5.5.1. Germany Semiconductor Gases Market Outlook, by Gas Type, 2020–2033
5.5.2. Germany Semiconductor Gases Market Outlook, by Supply Mode, 2020–2033
5.5.3. Germany Semiconductor Gases Market Outlook, by Process Application, 2020–2033
5.5.4. Germany Semiconductor Gases Market Outlook, by End Use, 2020–2033
5.5.5. Ireland Semiconductor Gases Market Outlook, by Gas Type, 2020–2033
5.5.6. Ireland Semiconductor Gases Market Outlook, by Supply Mode, 2020–2033
5.5.7. Ireland Semiconductor Gases Market Outlook, by Process Application, 2020–2033
5.5.8. Ireland Semiconductor Gases Market Outlook, by End Use, 2020–2033
5.5.9. France Semiconductor Gases Market Outlook, by Gas Type, 2020–2033
5.5.10. France Semiconductor Gases Market Outlook, by Supply Mode, 2020–2033
5.5.11. France Semiconductor Gases Market Outlook, by Process Application, 2020–2033
5.5.12. France Semiconductor Gases Market Outlook, by End Use, 2020–2033
5.5.13. Italy Semiconductor Gases Market Outlook, by Gas Type, 2020–2033
5.5.14. Italy Semiconductor Gases Market Outlook, by Supply Mode, 2020–2033
5.5.15. Italy Semiconductor Gases Market Outlook, by Process Application, 2020–2033
5.5.16. Italy Semiconductor Gases Market Outlook, by End Use, 2020–2033
5.5.17. the Netherlands Semiconductor Gases Market Outlook, by Gas Type, 2020–2033
5.5.18. the Netherlands Semiconductor Gases Market Outlook, by Supply Mode, 2020–2033
5.5.19. the Netherlands Semiconductor Gases Market Outlook, by Process Application, 2020–2033
5.5.20. the Netherlands Semiconductor Gases Market Outlook, by End Use, 2020–2033
5.5.21. Austria Semiconductor Gases Market Outlook, by Gas Type, 2020–2033
5.5.22. Austria Semiconductor Gases Market Outlook, by Supply Mode, 2020–2033
5.5.23. Austria Semiconductor Gases Market Outlook, by Process Application, 2020–2033
5.5.24. Austria Semiconductor Gases Market Outlook, by End Use, 2020–2033
6. Asia Pacific Semiconductor Gases Market Outlook, 2020–2033
6.1. Asia Pacific Semiconductor Gases Market Outlook, by Gas Type, Value (US$ Billion), 2020–2033
6.1.1. Bulk and Atmospheric Gases
6.1.2. Silicon Precursors
6.1.3. Dopant Gases
6.1.4. Etchant and Chamber-Clean Gases
6.1.5. Deposition Precursors
6.1.6. Noble and Rare Gases
6.2. Asia Pacific Semiconductor Gases Market Outlook, by Supply Mode, Value (US$ Billion), 2020–2033
6.2.1. On-Site Generation Plants
6.2.2. Bulk and Pipeline Delivery
6.2.3. Cylinder and Packaged Delivery
6.2.4. Gas Delivery, Purification and On-Site Services
6.3. Asia Pacific Semiconductor Gases Market Outlook, by Process Application, Value (US$ Billion), 2020–2033
6.3.1. Deposition
6.3.2. Etching and Chamber Cleaning
6.3.3. Lithography
6.3.4. Doping and Ion Implantation
6.3.5. Wafer Cleaning and Surface Preparation
6.3.6. Annealing and Packaging
6.4. Asia Pacific Semiconductor Gases Market Outlook, by End Use, Value (US$ Billion), 2020–2033
6.4.1. Semiconductor Device Fabrication
6.4.2. Display Manufacturing
6.4.3. Photovoltaic Manufacturing
6.4.4. Advanced Packaging and Test
6.5. Asia Pacific Semiconductor Gases Market Outlook, by Country, Value (US$ Billion), 2020–2033
6.5.1. Taiwan Semiconductor Gases Market Outlook, by Gas Type, 2020–2033
6.5.2. Taiwan Semiconductor Gases Market Outlook, by Supply Mode, 2020–2033
6.5.3. Taiwan Semiconductor Gases Market Outlook, by Process Application, 2020–2033
6.5.4. Taiwan Semiconductor Gases Market Outlook, by End Use, 2020–2033
6.5.5. Korea Semiconductor Gases Market Outlook, by Gas Type, 2020–2033
6.5.6. Korea Semiconductor Gases Market Outlook, by Supply Mode, 2020–2033
6.5.7. Korea Semiconductor Gases Market Outlook, by Process Application, 2020–2033
6.5.8. Korea Semiconductor Gases Market Outlook, by End Use, 2020–2033
6.5.9. China Semiconductor Gases Market Outlook, by Gas Type, 2020–2033
6.5.10. China Semiconductor Gases Market Outlook, by Supply Mode, 2020–2033
6.5.11. China Semiconductor Gases Market Outlook, by Process Application, 2020–2033
6.5.12. China Semiconductor Gases Market Outlook, by End Use, 2020–2033
6.5.13. Japan Semiconductor Gases Market Outlook, by Gas Type, 2020–2033
6.5.14. Japan Semiconductor Gases Market Outlook, by Supply Mode, 2020–2033
6.5.15. Japan Semiconductor Gases Market Outlook, by Process Application, 2020–2033
6.5.16. Japan Semiconductor Gases Market Outlook, by End Use, 2020–2033
6.5.17. Singapore Semiconductor Gases Market Outlook, by Gas Type, 2020–2033
6.5.18. Singapore Semiconductor Gases Market Outlook, by Supply Mode, 2020–2033
6.5.19. Singapore Semiconductor Gases Market Outlook, by Process Application, 2020–2033
6.5.20. Singapore Semiconductor Gases Market Outlook, by End Use, 2020–2033
6.5.21. Malaysia Semiconductor Gases Market Outlook, by Gas Type, 2020–2033
6.5.22. Malaysia Semiconductor Gases Market Outlook, by Supply Mode, 2020–2033
6.5.23. Malaysia Semiconductor Gases Market Outlook, by Process Application, 2020–2033
6.5.24. Malaysia Semiconductor Gases Market Outlook, by End Use, 2020–2033
7. Latin America Semiconductor Gases Market Outlook, 2020–2033
7.1. Latin America Semiconductor Gases Market Outlook, by Gas Type, Value (US$ Billion), 2020–2033
7.1.1. Bulk and Atmospheric Gases
7.1.2. Silicon Precursors
7.1.3. Dopant Gases
7.1.4. Etchant and Chamber-Clean Gases
7.1.5. Deposition Precursors
7.1.6. Noble and Rare Gases
7.2. Latin America Semiconductor Gases Market Outlook, by Supply Mode, Value (US$ Billion), 2020–2033
7.2.1. On-Site Generation Plants
7.2.2. Bulk and Pipeline Delivery
7.2.3. Cylinder and Packaged Delivery
7.2.4. Gas Delivery, Purification and On-Site Services
7.3. Latin America Semiconductor Gases Market Outlook, by Process Application, Value (US$ Billion), 2020–2033
7.3.1. Deposition
7.3.2. Etching and Chamber Cleaning
7.3.3. Lithography
7.3.4. Doping and Ion Implantation
7.3.5. Wafer Cleaning and Surface Preparation
7.3.6. Annealing and Packaging
7.4. Latin America Semiconductor Gases Market Outlook, by End Use, Value (US$ Billion), 2020–2033
7.4.1. Semiconductor Device Fabrication
7.4.2. Display Manufacturing
7.4.3. Photovoltaic Manufacturing
7.4.4. Advanced Packaging and Test
7.5. Latin America Semiconductor Gases Market Outlook, by Country, Value (US$ Billion), 2020–2033
7.5.1. Mexico Semiconductor Gases Market Outlook, by Gas Type, 2020–2033
7.5.2. Mexico Semiconductor Gases Market Outlook, by Supply Mode, 2020–2033
7.5.3. Mexico Semiconductor Gases Market Outlook, by Process Application, 2020–2033
7.5.4. Mexico Semiconductor Gases Market Outlook, by End Use, 2020–2033
7.5.5. Brazil Semiconductor Gases Market Outlook, by Gas Type, 2020–2033
7.5.6. Brazil Semiconductor Gases Market Outlook, by Supply Mode, 2020–2033
7.5.7. Brazil Semiconductor Gases Market Outlook, by Process Application, 2020–2033
7.5.8. Brazil Semiconductor Gases Market Outlook, by End Use, 2020–2033
7.5.9. Costa Rica Semiconductor Gases Market Outlook, by Gas Type, 2020–2033
7.5.10. Costa Rica Semiconductor Gases Market Outlook, by Supply Mode, 2020–2033
7.5.11. Costa Rica Semiconductor Gases Market Outlook, by Process Application, 2020–2033
7.5.12. Costa Rica Semiconductor Gases Market Outlook, by End Use, 2020–2033
8. Middle East & Africa Semiconductor Gases Market Outlook, 2020–2033
8.1. Middle East & Africa Semiconductor Gases Market Outlook, by Gas Type, Value (US$ Billion), 2020–2033
8.1.1. Bulk and Atmospheric Gases
8.1.2. Silicon Precursors
8.1.3. Dopant Gases
8.1.4. Etchant and Chamber-Clean Gases
8.1.5. Deposition Precursors
8.1.6. Noble and Rare Gases
8.2. Middle East & Africa Semiconductor Gases Market Outlook, by Supply Mode, Value (US$ Billion), 2020–2033
8.2.1. On-Site Generation Plants
8.2.2. Bulk and Pipeline Delivery
8.2.3. Cylinder and Packaged Delivery
8.2.4. Gas Delivery, Purification and On-Site Services
8.3. Middle East & Africa Semiconductor Gases Market Outlook, by Process Application, Value (US$ Billion), 2020–2033
8.3.1. Deposition
8.3.2. Etching and Chamber Cleaning
8.3.3. Lithography
8.3.4. Doping and Ion Implantation
8.3.5. Wafer Cleaning and Surface Preparation
8.3.6. Annealing and Packaging
8.4. Middle East & Africa Semiconductor Gases Market Outlook, by End Use, Value (US$ Billion), 2020–2033
8.4.1. Semiconductor Device Fabrication
8.4.2. Display Manufacturing
8.4.3. Photovoltaic Manufacturing
8.4.4. Advanced Packaging and Test
8.5. Middle East & Africa Semiconductor Gases Market Outlook, by Country, Value (US$ Billion), 2020–2033
8.5.1. Israel Semiconductor Gases Market Outlook, by Gas Type, 2020–2033
8.5.2. Israel Semiconductor Gases Market Outlook, by Supply Mode, 2020–2033
8.5.3. Israel Semiconductor Gases Market Outlook, by Process Application, 2020–2033
8.5.4. Israel Semiconductor Gases Market Outlook, by End Use, 2020–2033
8.5.5. Saudi Arabia Semiconductor Gases Market Outlook, by Gas Type, 2020–2033
8.5.6. Saudi Arabia Semiconductor Gases Market Outlook, by Supply Mode, 2020–2033
8.5.7. Saudi Arabia Semiconductor Gases Market Outlook, by Process Application, 2020–2033
8.5.8. Saudi Arabia Semiconductor Gases Market Outlook, by End Use, 2020–2033
8.5.9. United Arab Emirates Semiconductor Gases Market Outlook, by Gas Type, 2020–2033
8.5.10. United Arab Emirates Semiconductor Gases Market Outlook, by Supply Mode, 2020–2033
8.5.11. United Arab Emirates Semiconductor Gases Market Outlook, by Process Application, 2020–2033
8.5.12. United Arab Emirates Semiconductor Gases Market Outlook, by End Use, 2020–2033
8.5.13. South Africa Semiconductor Gases Market Outlook, by Gas Type, 2020–2033
8.5.14. South Africa Semiconductor Gases Market Outlook, by Supply Mode, 2020–2033
8.5.15. South Africa Semiconductor Gases Market Outlook, by Process Application, 2020–2033
8.5.16. South Africa Semiconductor Gases Market Outlook, by End Use, 2020–2033
9. Competitive Landscape
9.1. Market Concentration and Industry Leaders
9.2. Competitive Differentiation
9.3. Strategic Moves and Market Direction
9.4. Recent Industry Developments
9.5. Company Profiles
9.5.1. Linde plc
9.5.2. Air Liquide S.A.
9.5.3. Air Products and Chemicals, Inc.
9.5.4. Nippon Sanso Holdings Corporation
9.5.5. Messer SE & Co. KGaA
9.5.6. Matheson Tri-Gas, Inc.
9.5.7. Resonac Holdings Corporation
9.5.8. Kanto Denka Kogyo Co., Ltd.
9.5.9. Central Glass Co., Ltd.
9.5.10. SK Specialty Co., Ltd.
9.5.11. Sumitomo Seika Chemicals Company, Limited
9.5.12. Merck KGaA
9.5.13. Entegris, Inc.
10. Appendix
10.1. Research Methodology
10.2. Report Assumptions
10.3. Acronyms and Abbreviations
| Gas Type | Bulk and Atmospheric Gases, Silicon Precursors, Dopant Gases, Etchant and Chamber-Clean Gases, Deposition Precursors, Noble and Rare Gases |
| Supply Mode | On-Site Generation Plants, Bulk and Pipeline Delivery, Cylinder and Packaged Delivery, Gas Delivery, Purification and On-Site Services |
| Process Application | Deposition, Etching and Chamber Cleaning, Lithography, Doping and Ion Implantation, Wafer Cleaning and Surface Preparation, Annealing and Packaging |
| End Use | Semiconductor Device Fabrication, Display Manufacturing, Photovoltaic Manufacturing, Advanced Packaging and Test |
| Regions | North America, Europe, Asia Pacific, Latin America, Middle East & Africa |
Our Research Methodology
Considering the volatility of business today, traditional approaches to strategizing a game plan can be unfruitful if not detrimental. True ambiguity is no way to determine a forecast. A myriad of predetermined factors must be accounted for such as the degree of risk involved, the magnitude of circumstances, as well as conditions or consequences that are not known or unpredictable. To circumvent binary views that cast uncertainty, the application of market research intelligence to strategically posture, move, and enable actionable outcomes is necessary.
View Methodology
Quality Assured
Rigorous Validation Process

Confidentiality Assured
End-to-end Data Security

Custom Research Services
Tailored To Your Objectives
FAQs
The global semiconductor gases market is valued at US$ 9.6 billion in 2026, covering bulk gases, electronic specialty gases and associated purification and on-site services.
The market is projected to reach US$ 16.8 billion by 2033, growing at an 8.3% CAGR and adding an absolute opportunity of US$ 7.2 billion.
Bulk and atmospheric gases lead with 41.3% share in 2026, since nitrogen, argon, oxygen and hydrogen are consumed continuously across every fab tool.
Advanced packaging and test grows fastest at a 12.3% CAGR, as chiplet architectures move process value from wafer fabrication into assembly.
Asia Pacific holds 58.6% share in 2026, reflecting its concentration of leading-edge foundry, memory, display and photovoltaic manufacturing capacity.
Related Reports
Ultra high Molecular Weight Polyethylene Market Size, Share, Insights, Competitive Landscape, and Forecast 2026 to 2033
Explore the UHMWPE market, forecast to reach US$4.8 billion by 2033 at 7.5% CAGR, with insights into grades, applications, regions and leading companies.
Steel Drums & IBCs Market Size, Share, Insights, Competitive Landscape, and Forecast 2026 to 2033
Explore the steel drums & IBCs market, projected to reach US$29.8 billion by 2033 at 4.8% CAGR, with segment, regional and competitive insights.
Non-load Bearing Walls Market Size, Share, Insights, Competitive Landscape, and Forecast 2026 to 2033
The non-load bearing walls market is projected to grow from US$96.0 billion in 2026 to US$136.0 billion by 2033, at a 5.1% CAGR. Explore key trends.
Nanoparticle Technology Market Size, Share, Insights, Competitive Landscape, and Forecast 2026 to 2033
The nanoparticle technology market is projected to grow from US$24.0 billion in 2026 to US$48.0 billion by 2033, at a 10.4% CAGR. Explore key trends.
Expanded PTFE (ePTFE) Market Size, Share, Insights, Competitive Landscape, and Forecast 2026 to 2033
The expanded PTFE market is projected to grow from US$2.4 billion in 2026 to US$3.8 billion by 2033, at a 6.8% CAGR. Explore segments and regional trends.
Ethylene Dichloride Market Size, Share, Insights, Competitive Landscape, and Forecast 2026 to 2033
The ethylene dichloride market is projected to grow from US$24.5 billion in 2026 to US$31.0 billion by 2033, at a 3.4% CAGR. Explore segments and regions.